
Methods and systems for characterizing tissue of a subject

a tissue and subject technology, applied in the field of imaging, can solve the problems of subjective and not very precise clinical judgment, insufficient qualitative visual evaluation of such images, and high variability in blood movement through individual capillaries

Active Publication Date: 2018-02-13
STRYKER EUROPEAN OPERATIONS LIMITED
View PDF5 Cites 18 Cited by
  • Summary
  • Abstract
  • Description
  • Claims
  • Application Information

AI Technical Summary

Benefits of technology

This approach enhances the accuracy and consistency of perfusion assessments, reducing subjectivity and variability, allowing for reliable tracking of tissue health over time and facilitating more informed clinical decisions.

Problems solved by technology

However, compared to blood movement through the larger diameter blood vessels, blood movement through individual capillaries can be highly erratic, principally due to vasomotion, wherein spontaneous oscillation in blood vessel tone manifests as pulsation in erythrocyte movement.
For example, in treating patients with wounded tissue, clinicians must correctly assess blood flow and / or tissue perfusion in and around a wound site, since poor tissue perfusion will have an adverse effect on the healing process.
However, such clinical judgment is subjective and not very precise.
However, a qualitative visual evaluation of such images is not always sufficient for a number of reasons, particularly in instances where the visual information is ambiguous.
For instance, such visual evaluation is limited since many parameters, such as image brightness, image contrast and image noise, can be affected by factors other than the blood flow and / or perfusion properties of the tissue.
Moreover, mere visual evaluation is subjective (e.g., visual evaluation may vary from clinician to clinician, one clinician's visual evaluation protocol may vary somewhat from patient to patient and / or from imaging session to imaging session) and does not support a standardized protocol for assessing blood flow and / or tissue perfusion.
Finally, due to a clinician's lack of memory or inaccurate recollection of previous visual assessments, it can be challenging to reliably and consistently compare and track blood flow and / or perfusion status of a patient over time across multiple imaging sessions.

Method used


Image

  • Methods and systems for characterizing tissue of a subject
  • Methods and systems for characterizing tissue of a subject
  • Methods and systems for characterizing tissue of a subject

Examples


case 1

tic Fracture Wound

[0137]FIGS. 12A to 12H illustrate an application of the method and system of the present invention for quantitative assessment and management of wounds, such as for example, a wound caused by a traumatic fracture. The patient was a 72 year old male who incurred a traumatic, compound bimalleolar fracture of his left ankle that required operative repair with an open reduction / internal-fixation procedure. The surgical site has become fully disrupted, threatening the fixation plates and hence the extremity. Hyperbaric oxygen therapy (HBOT) therapy was recommended.

[0138]The color image in FIG. 12A shows a wound observed during an initial assessment of the patient with the clinician prior to any therapy applied to the wound, and FIG. 12E is a color image of the wound one month after the initial assessment following repeated episodes of treatment. The maximum perfusion maps of the wound were generated as described above, an example of which is illustrated in FIG. 12B take...

case 2 — infected

Case 2—Infected Wound

[0142]FIGS. 13A to 13K illustrate an application of the method and system of the present invention for quantitative assessment and management of wounds, such as for example, an infected wound. The patient was a 48 year old male with an infected wound in the left leg. Open-reduction-internal-fixation reconstruction procedure was performed. The wound has been open for several months. Refractory to aggressive topical wound care and antibiotics treatments were applied, and HBOT therapy was recommended. The methods described above in connection with image acquisition, processing and generation of the wound index value apply to this case.

[0143]FIGS. 13A, 13F and 13I are color images of the wound during an initial assessment (FIG. 13A) and thereafter following treatment, which occurred at 2 weeks (no image available), 2 months (FIG. 13F), and 3 months (FIG. 13I) from the initial assessment. FIGS. 13B, 13D, 13G, and 13J are the corresponding maximum perfusion maps, and ...

case 3

ic Wound

[0145]FIGS. 14A to 14I illustrate an application of the method and system of the present invention for quantitative assessment and management of wounds, such as for example, an ischemic wound. The patient was 51 year old male with left foot ischemic wound with an amputated metatarsal with osteomyelitis and ascending fasciitis, and obliterative end arteritis. Refractory to aggressive topical care and antibiotics treatments have been applied. HBOT was recommended and started. The methods described above in connection with image acquisition, processing and generation of the wound index value apply to this case.

[0146]FIGS. 14A, 14D and 14G are color images of the wound during an initial assessment and thereafter following treatment which occurred at 5 days (FIG. 14D) and 1 month (FIG. 14G) following the initial assessment. FIGS. 14B, 14E, and 14H are the corresponding maximum perfusion maps, and FIGS. 14C, 14F, and 14I are the corresponding wound activity maps. A healthy tissue ...


PUM


Abstract

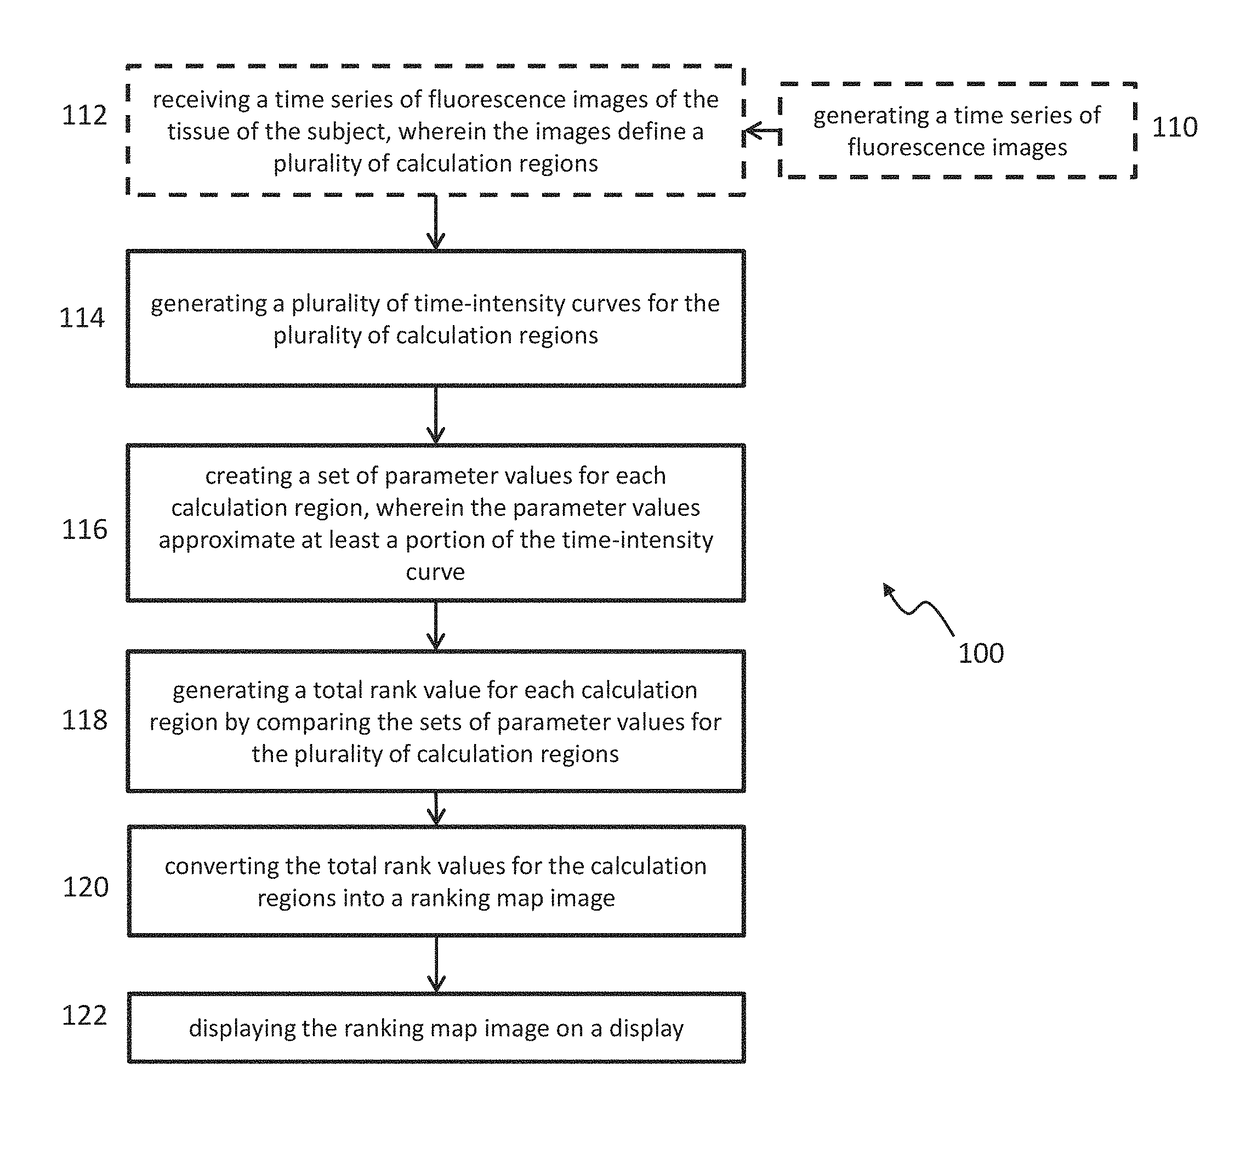
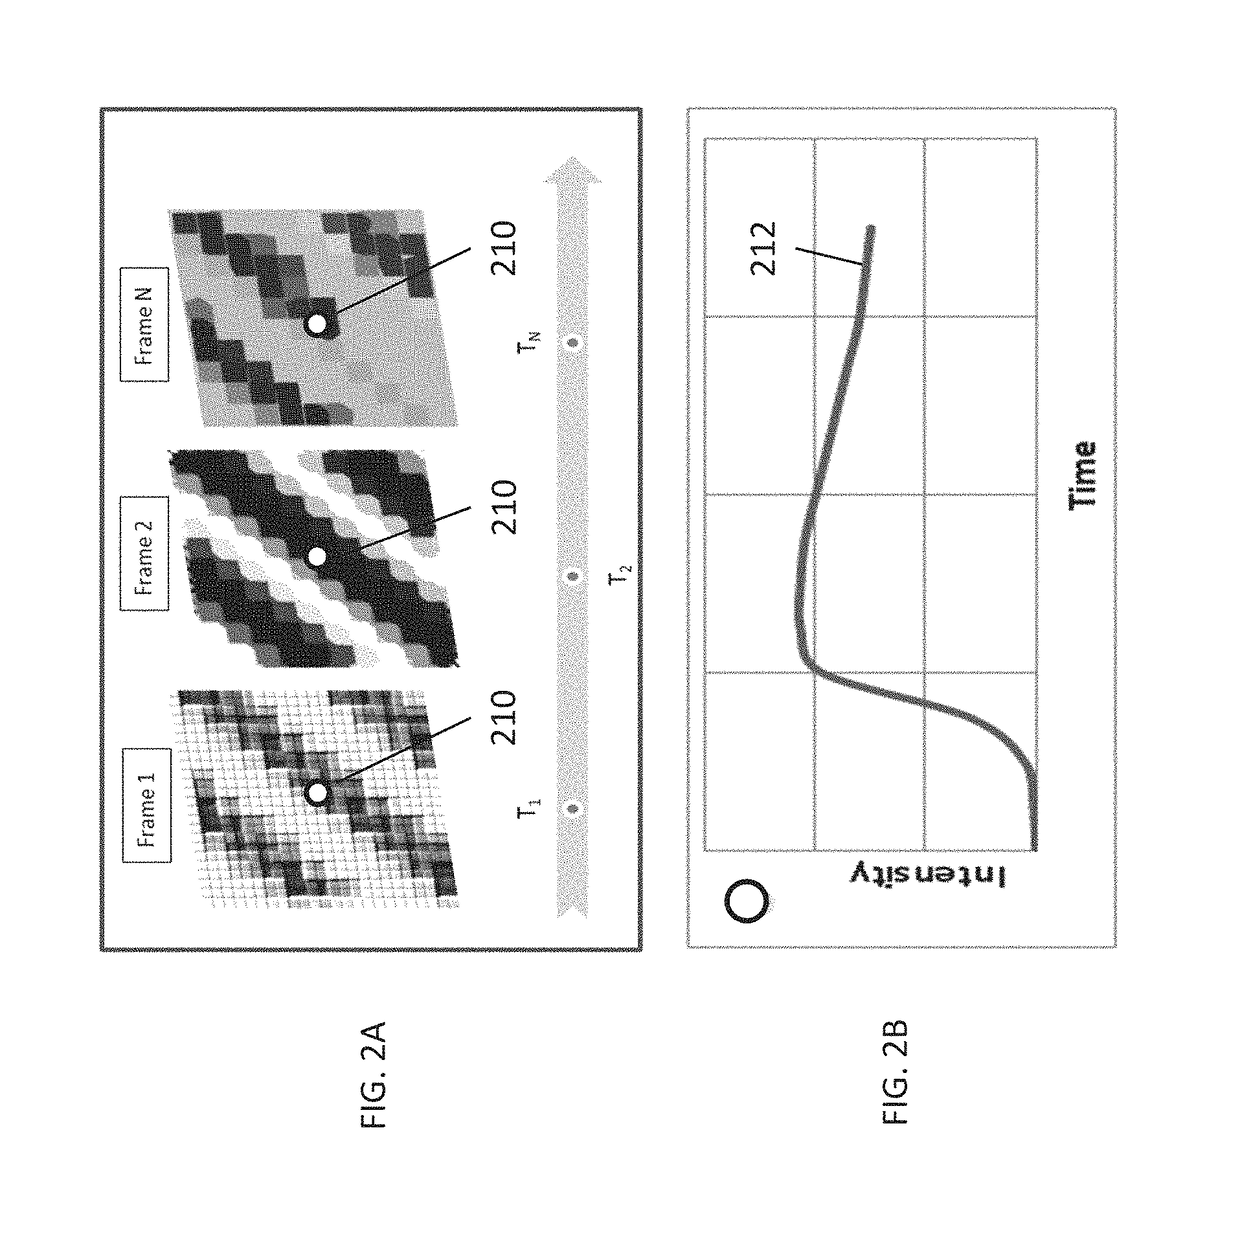
Methods and systems for characterizing tissue of a subject are disclosed. The method includes receiving a time series of fluorescence images of the tissue of the subject wherein the images define a plurality of calculation regions, generating a plurality of time-intensity curves for the plurality of calculation regions, creating a set of parameter values for each calculation region, generating a total rank value for each calculation region by comparing the sets of parameter values, and converting the total rank value into a ranking map image. Also disclosed are methods and systems for characterizing a wound in tissue by generating a wound index value.

Description

CROSS-REFERENCE TO RELATED APPLICATIONS[0001]This application claims priority to U.S. Provisional Application Ser. No. 62 / 110,609 filed on Feb. 2, 2015, entitled “METHODS AND SYSTEMS FOR PROCESSING A TIME SERIES OF ANGIOGRAPHY IMAGES OF TISSUE OF A SUBJECT” and U.S. Provisional Application Ser. No. 62 / 174,225 filed on Jun. 11, 2015, entitled “METHODS AND SYSTEMS FOR QUANTITATIVELY ASSESSING A WOUND IN TISSUE OF A SUBJECT”, each of which is hereby incorporated by reference in its entirety.FIELD[0002]The present invention relates generally to the field of imaging, and more particularly to the processing of medical images for characterizing tissue of a subject.BACKGROUND OF THE INVENTION[0003]Blood flow is a generic term used to define movement of blood through blood vessels, which can be quantified in terms such as volumetric flow rate (i.e., volume / time) or travel speed (i.e., distance / time). Tissue perfusion is distinguished from vascular blood flow in that tissue perfusion defines ...

Claims


Application Information

Patent Timeline
Patent Type & Authority Patents(United States)
IPC IPC(8): G06T7/00A61B5/00A61B6/00
CPCG06T7/0016A61B5/0071A61B5/445A61B6/486A61B6/507A61B6/5217G06T2211/404G06T2207/10064G06T2207/30088G06T2207/30096G06T2207/30104G06T2210/41A61B2576/02G16H30/00G16H50/20A61K49/0034A61K49/0043A61K49/0041A61K49/0045A61K49/0021A61K49/0047A61K49/0032G16H50/50
Inventor GUREVICH, LINAWALLE-JENSEN, JORGEN
Owner STRYKER EUROPEAN OPERATIONS LIMITED
Learn More