Diarrhetic shellfish poisoning okadaic acid OA mouse biological detection model
A kind of technology of haicic acid and detection model, which is applied in the field of marine biology, can solve the problems of organism strain, gender and individual differences, and differences, and achieve the effect of simple and easy operation procedures, stable strains and sufficient quantity
- Summary
- Abstract
- Description
- Claims
- Application Information
AI Technical Summary
Problems solved by technology
Method used
Image
Examples
Embodiment 1
[0027] Example 1: Diarrheal shellfish toxin LD 50 Determination of
[0028] Firstly, the OA standard was diluted with 9 g / L normal saline solution containing 1% Tween 60 to obtain the following 7 toxin concentrations (1 μg / mL, 2 μg / mL, 3 μg / mL, 5 μg / mL, 7 μg / mL, 10 μg / mL, 15 μg / mL). Preliminary tests were carried out to record the poisoning and death of mice, and the minimum total lethal concentration of the toxin was determined to be 7 μg / mL, and the maximum total non-lethal concentration was 2 μg / mL (Table 1).
[0029] Table 1 Toxin lethal concentration results
[0030]
[0031] Set up 8 equal ratio concentration groups within the range of minimum total lethal and maximum total non-lethal toxin concentration, respectively 1.95μg / mL, 2.34μg / mL, 2.81μg / mL, 3.38μg / mL, 4.05μg / mL, 4.86μg / mL, 5.83μg / mL, 7.00μg / mL, conduct a formal test. The symptoms of poisoning and the number of deaths were recorded, and the mortality rate was calculated accordingly (see Table 2). The lo...
Embodiment 2
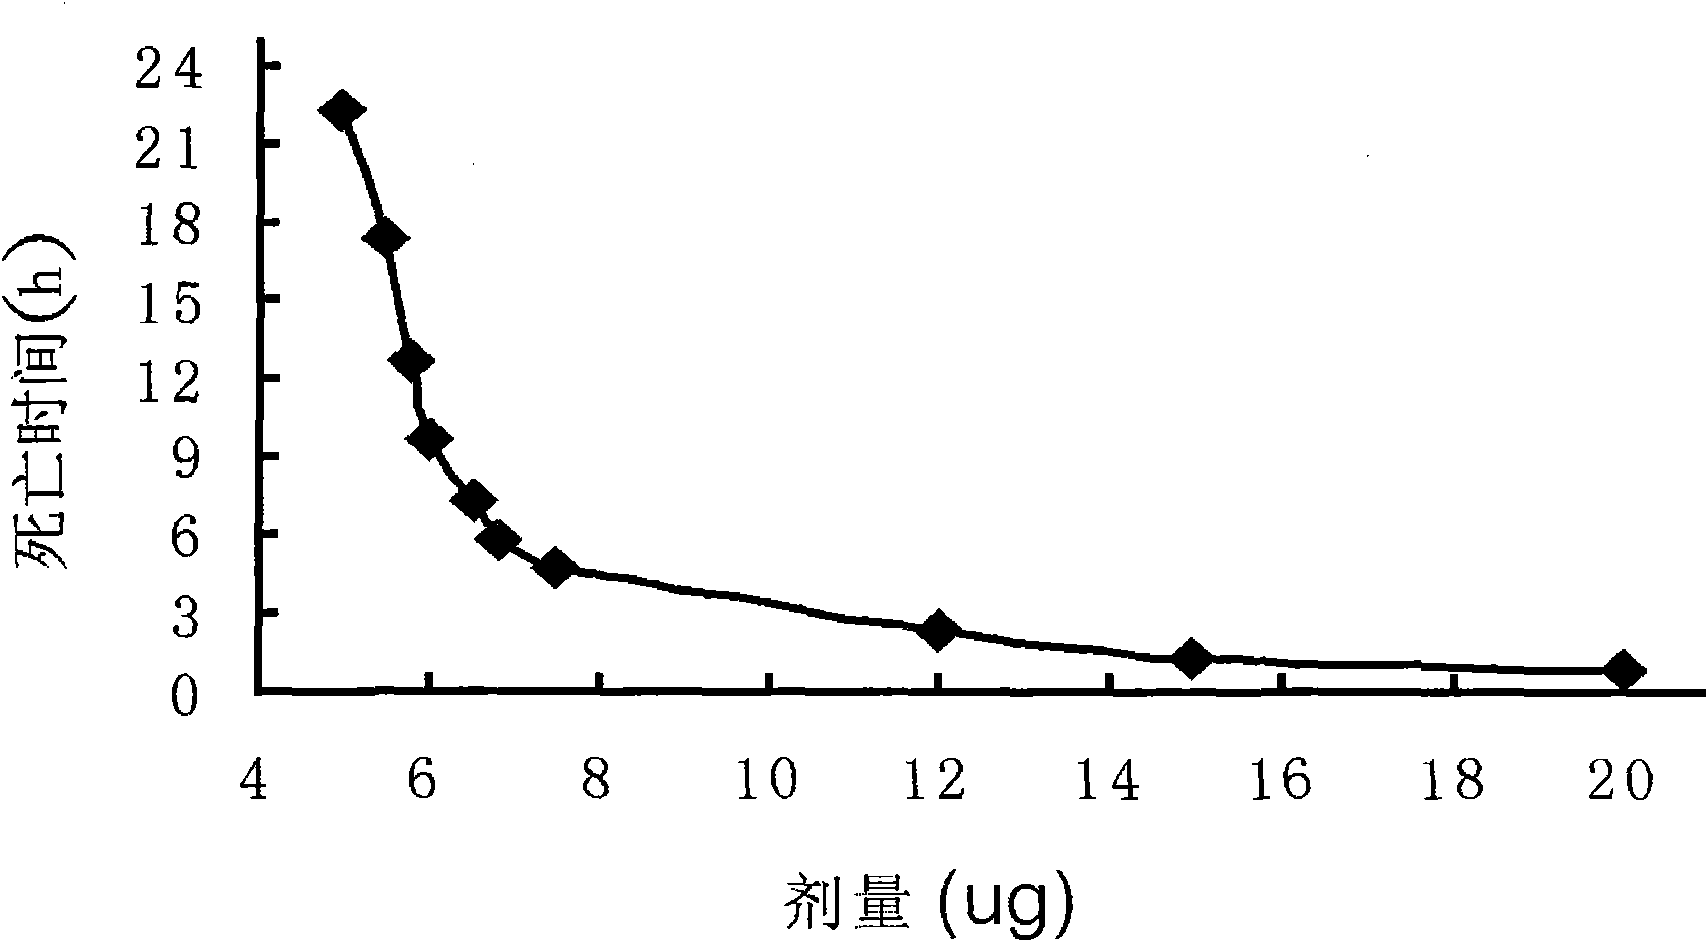
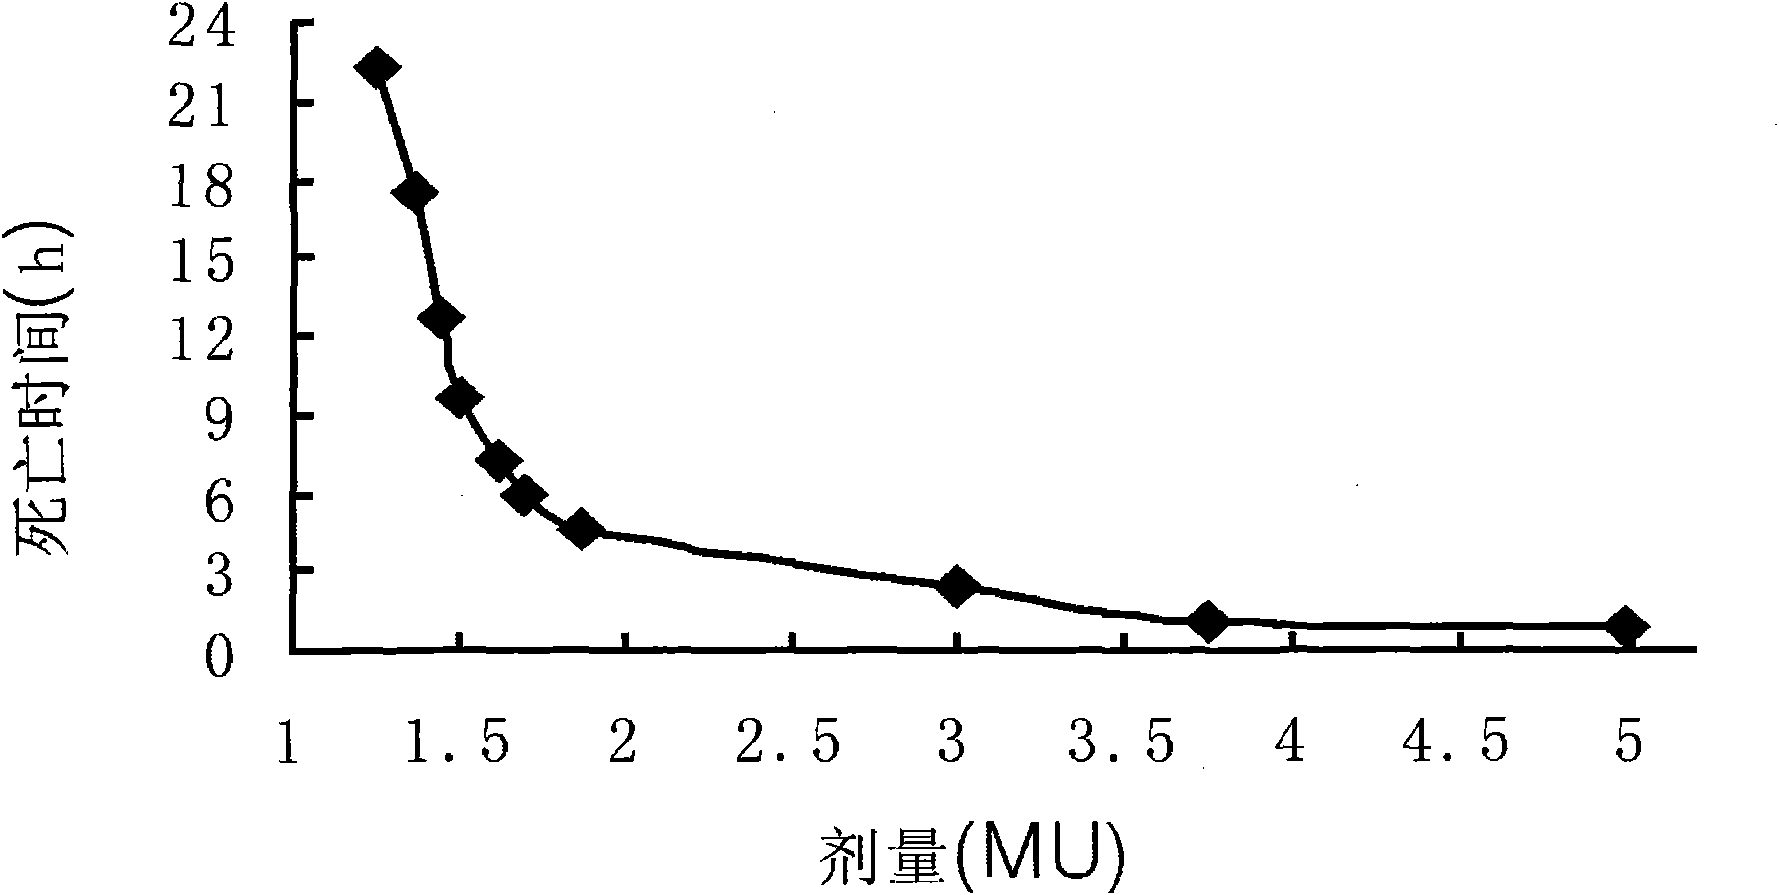
[0034] Example 2: Determination of toxin dose-intermediate death time curve and toxin dose unit-intermediate death time curve
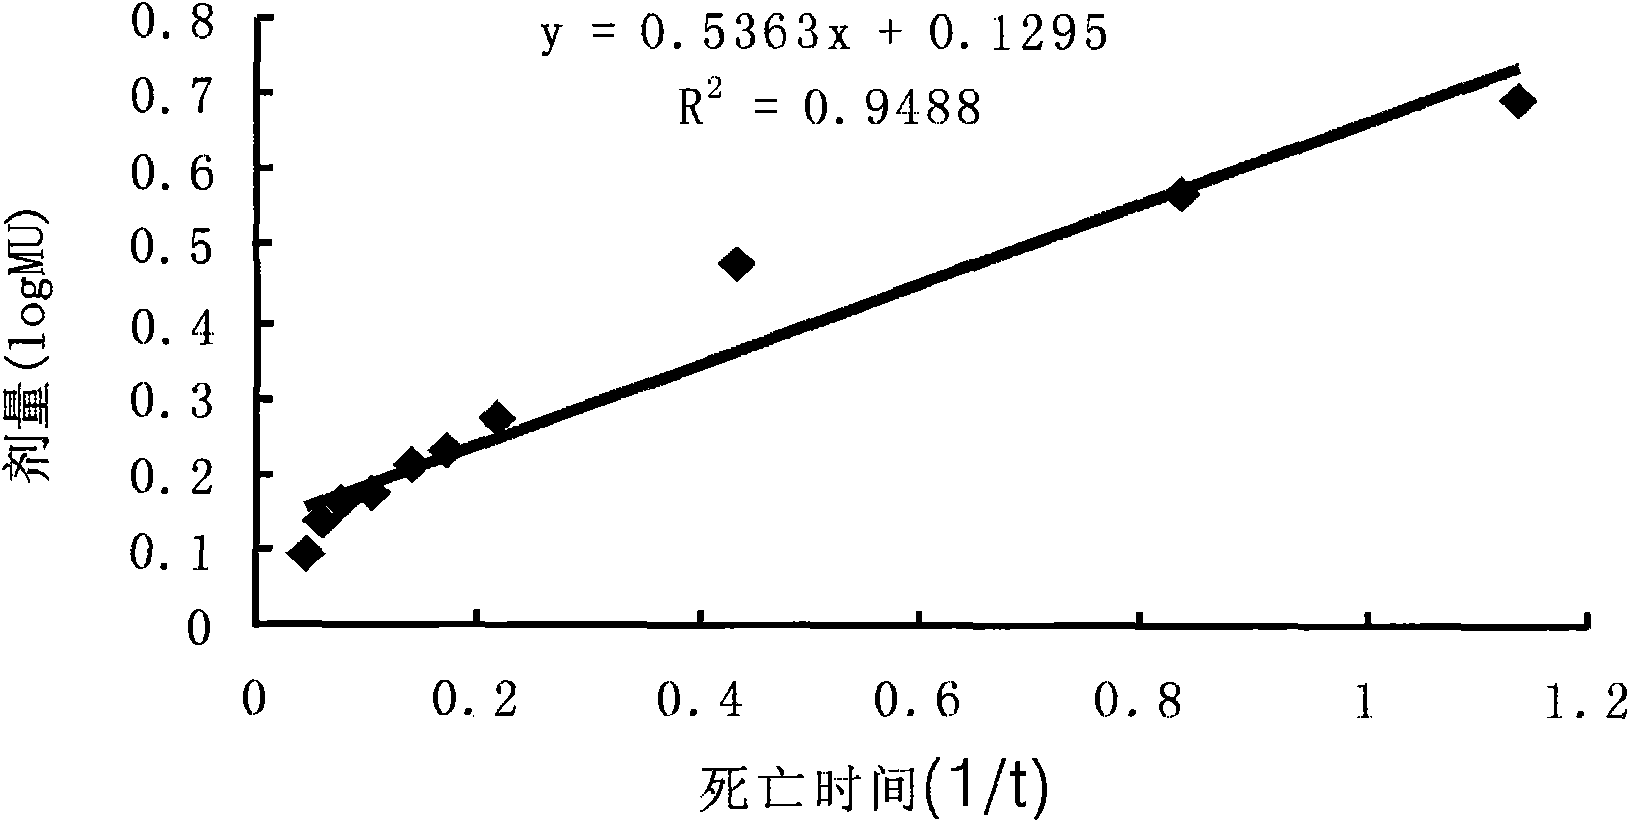
[0035] In determining LD 50 On the basis of the value, 10 toxin concentration groups were further set up for experiments to establish toxin dose-intermediate death time curves and toxin dose unit-intermediate death time curves. See Table 3 for each concentration group and its corresponding toxin dose, dosage unit and median death time of mice.
[0036] Table 3 dose-intermediate death time test results
[0037]
[0038] According to the data in Table 3, obtain the toxin dose-median death time curve y=600.57x respectively -2.257
[0039] ( figure 1 ) and toxin dose unit-intermediate death time curve y=26.06x -2.257 ( figure 2 ). In the dose range of 5.8-6.5ug, there is a linear relationship between the dose and the death time. At this time, the death range of the mice is 7.20-12.67h. Therefore, in the actual detection work, the death time of ...
PUM
 Abstract
Description
Claims
Application Information
 - R&D
- Intellectual Property
- Life Sciences
- Materials
- Tech Scout
- Unparalleled Data Quality
- Higher Quality Content
- 60% Fewer Hallucinations
Browse by: Latest US Patents, China's latest patents, Technical Efficacy Thesaurus, Application Domain, Technology Topic, Popular Technical Reports.
© 2025 PatSnap. All rights reserved.Legal|Privacy policy|Modern Slavery Act Transparency Statement|Sitemap|About US| Contact US: help@patsnap.com


