Method for measuring contents of ferrous ions and iron ions in glass
A technology of ferrous ions and ferric ions, which is applied in the field of content determination of ferrous ions and ferric ions in glass, can solve the problems of low ferrous ions and content errors, and achieve short operation time, small measurement errors and good repeatability Effect
- Summary
- Abstract
- Description
- Claims
- Application Information
AI Technical Summary
Problems solved by technology
Method used
Image
Examples
example 1
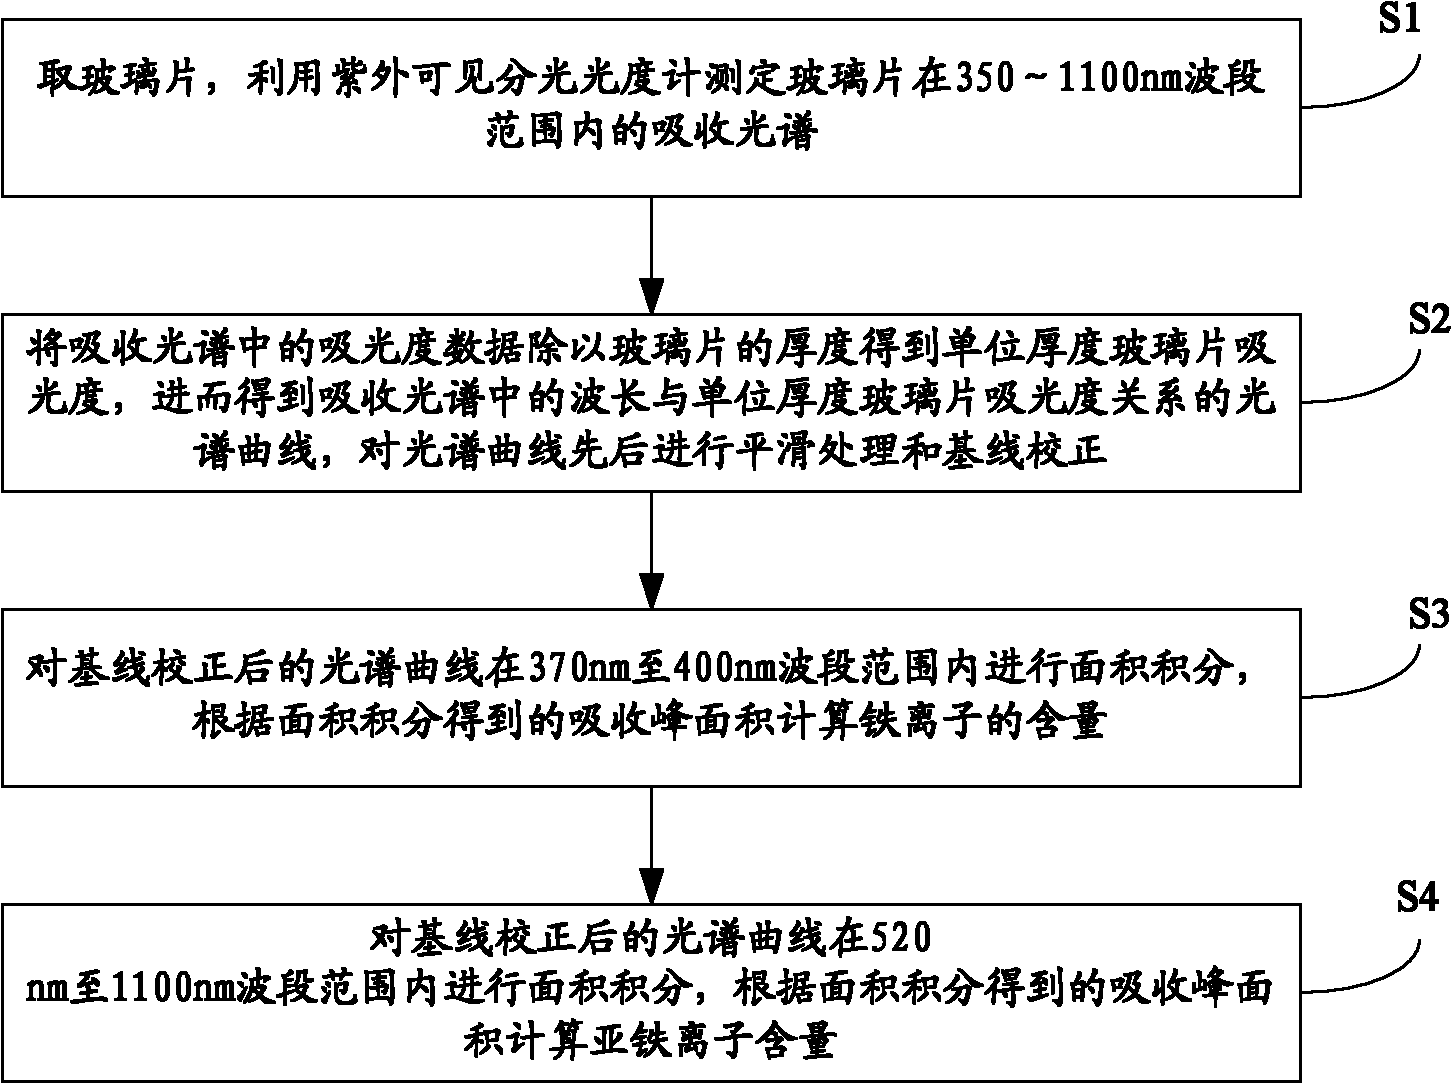
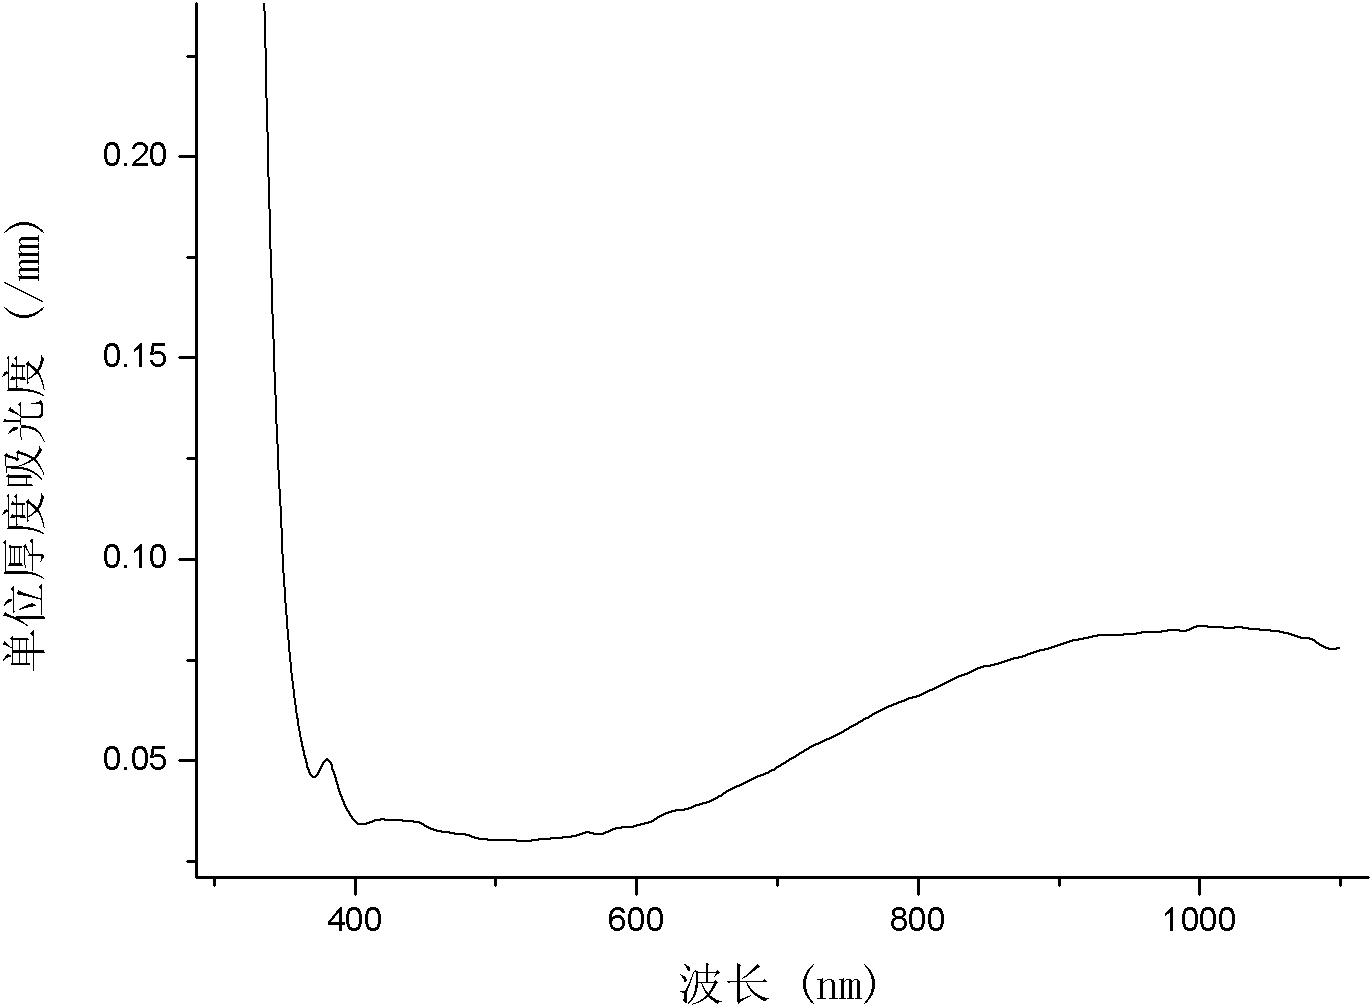
[0042] Step 1: Take a float glass sheet with a thickness of 3.96mm, clean it with an ultrasonic cleaner, and dry the cleaned glass sheet;
[0043] The second step: Utilize the ultraviolet-visible spectrophotometer to measure the absorption spectrum of the glass sheet in the range of 350-1100nm, and save the data of the absorption spectrum as an Excel spreadsheet file (extension: .xls);
[0044] The third step: use data processing software such as MS Excel, Origin, etc. to open the spreadsheet file in the second step (this patent uses Origin as an example), put the wavelength into the X column, and put the absorbance data into the Y column. Select the absorbance column data, use the set column values function to divide the absorbance data by the thickness of the glass sheet to obtain the absorbance per unit thickness of the glass sheet, use the Plot-line command to draw, and obtain the spectral curve of the relationship between the wavelength and the absorbance of the glass sh...
example 2
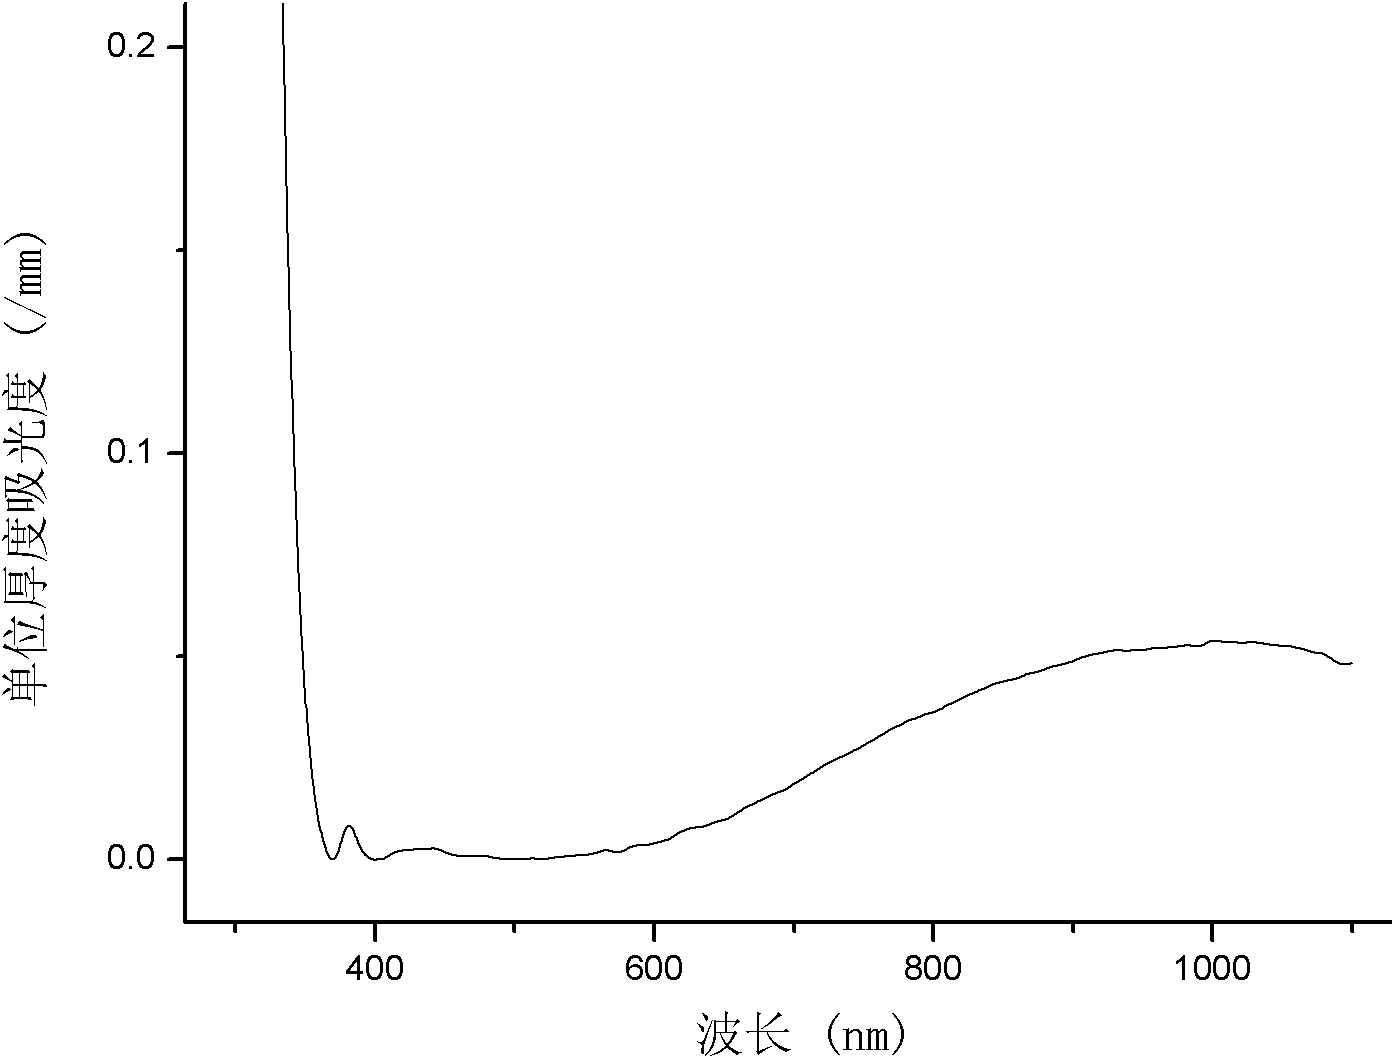
[0048] Step 1: Take a high-speed iron glass sheet with a thickness of 1.58mm, clean it with an ultrasonic cleaner, and dry the cleaned glass sheet;
[0049] The second step: Utilize the ultraviolet-visible spectrophotometer to measure the absorption spectrum of the glass sheet in the range of 350-1100nm, and save the data of the absorption spectrum as an Excel spreadsheet file (extension: .xls);
[0050] The third step: use data processing software such as MS Excel, Origin, etc. to open the spreadsheet file in the second step (this patent uses Origin as an example), put the wavelength into the X column, and put the absorbance data into the Y column. Select the absorbance column data, use the set column values function to divide the absorbance data by the thickness of the glass sheet to obtain the absorbance per unit thickness of the glass sheet, use the Plot-line command to draw, and obtain the spectral curve of the relationship between the wavelength and the absorbance of th...
PUM
| Property | Measurement | Unit |
|---|---|---|
| thickness | aaaaa | aaaaa |
| thickness | aaaaa | aaaaa |
| transmittivity | aaaaa | aaaaa |
Abstract
Description
Claims
Application Information
 - R&D
- Intellectual Property
- Life Sciences
- Materials
- Tech Scout
- Unparalleled Data Quality
- Higher Quality Content
- 60% Fewer Hallucinations
Browse by: Latest US Patents, China's latest patents, Technical Efficacy Thesaurus, Application Domain, Technology Topic, Popular Technical Reports.
© 2025 PatSnap. All rights reserved.Legal|Privacy policy|Modern Slavery Act Transparency Statement|Sitemap|About US| Contact US: help@patsnap.com


