[0069]
[0070] Experimental result one:
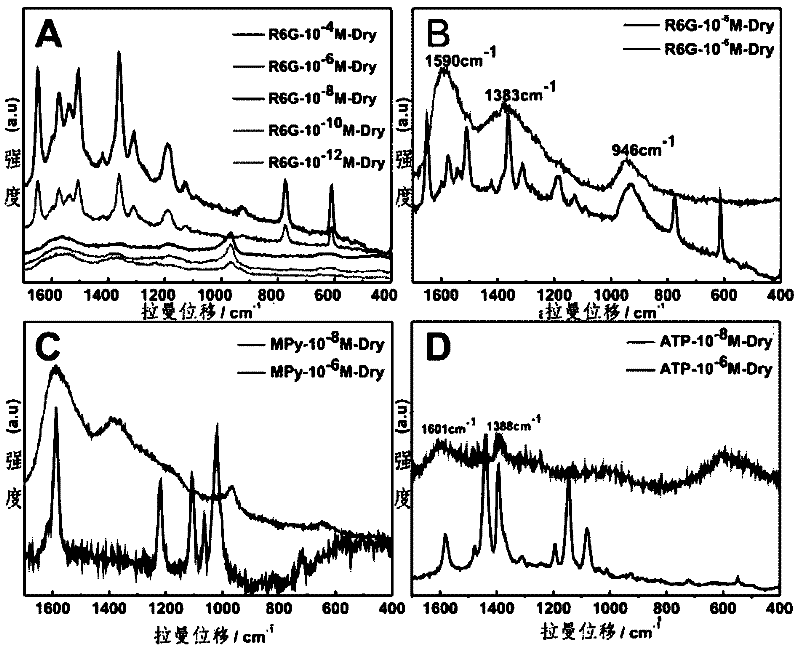
[0071] The present invention adopts the SERS substrate preparation scheme reported in the document "Facile size-controlled synthesis of silver nanoparticles in UV-irradiated tungstosilicate acid solution", based on the traditional SERS test scheme, for rhodamine (R6G), 4-mercaptopyridine (4-mercaptopyridine) -ATP), p-aminothiophenol (4-ATP), the detection limit cannot exceed 10 -6 M, and its test results are shown in image 3.
[0072]
[0073] Experiment 2.
[0074] One of the detection methods of dynamic surface-enhanced Raman spectroscopy is to drop ethanol onto the SERS sink containing the target molecule to be detected, and then detect the target signal under the Raman spectrometer. Using this method to detect R6G, the test results are obviously better than image 3 The traditional SERS test scheme in the Figure 4.
[0075] by comparison Figure 4 and image 3 , it can be clearly found that this method can improve the detection line of R6G molecules by 4 orders of magnitude.
[0076] In order to further verify the above experimental results, 10 -6 The R6G of M was subjected to a blank solvent suspension experiment, and the traditional dry state SERS detection was used. Although the R6G can appear SERS signal, as the laser irradiation time prolongs, the signal gradually decays and finally disappears (because the molecule is finally carbonized by the laser); while When we use the blank solvent ethanol dropwise to the above substrate for suspension test, we can repeatedly activate the strong SERS signal of R6G by adding ethanol dropwise. The results are shown in Figure 5 , that is, the blank solvent acts as a switch here, Figure 5 The experimental results further verify that the method is feasible.
[0077]
[0078] Experimental result three
[0079] The second method of dynamic surface-enhanced Raman spectroscopy is to drop 5 microliters of the target molecule solution to be measured on the blank SERS sink, and then immediately detect the target signal under the Raman spectrometer.
[0080] When R6G is detected, the probability of the target molecule being suspended in the laser focus area is much greater than that of one of the detection methods shown in Experimental Results 2. The corresponding SERS test result is that the signal is stronger than the experimental result of one of the detection methods, and the signal is out. The probability is also greatly improved. Here, R6G is also used as the evaluation standard to conduct tests. The results are shown in Image 6.
[0081] by comparison Figure 4 and Image 6 , we can find that the quality of the SERS spectrum of the method used in the second method is significantly better than that of the blank solvent suspension result used in the first method, and we also found in the experiment that the probability and repeatability of the signal in the second method of SERS are both Significantly better than one of the methods. This has also been further verified in control experiments with other molecules or other SERS substrates. For detailed results, see Figure 7.
[0082] pass Figure 7 We can find that, whether it is Ag-shell, Ag-sphere, or Ag-array as the SERS substrate, using one or two of the described methods can overcome the detection bottleneck of traditional SERS (10 -6 M), Figure 7 , we can also find that the detection lines for 4-MPy and 4-ATP are significantly lower than that of R6G, because the UV absorption peaks of 4-MPy and 4-ATP do not want R6G to be close to the excitation wavelength (514 nm), see Figure 7 -D, there is no resonance SERS effect, but their SERS detection limits are significantly better than the traditional SERS detection results, see details figure 1 and Figure 7.
[0083]
[0084] Experimental result four
[0085] The third method of dynamic surface-enhanced Raman spectroscopy is to directly mix the prepared SERS submerged sol with the target molecule to be measured, and then place the mixed sol under a Raman spectrometer to detect the signal of the target.
[0086] When we use the third method to detect R6G, its detection limit is further improved. The detection results are shown in Figure 8.
[0087] from Figure 8 We can see that with the third method, the detection limit of R6G can be improved by 8-10 orders of magnitude, that is, from the traditional 10 -6 M increased to 10 -14 ~10 -16 M Ultra-trace levels.
[0088] Experiment 5
[0089] The fourth detection method of dynamic surface-enhanced Raman spectroscopy is to directly drop the SERS submerged sol on the surface contaminated by the target molecule, fully wet the contaminated surface after a period of time, and suspend the target molecule to be measured on the contaminated surface. , and then detect the target signal under the Raman spectrometer.
[0090] The fourth method can easily achieve on-site detection. We still take R6G as the research object, and its detection results can be found in Figure 9.
[0091] Here we first drop R6G on a blank glass slide (simulating the on-site situation where the target molecule is scattered on the ground), and then we measure its Raman spectrum, even if 10 -2 M concentration of R6G could not be detected, and then we directly added the synthesized Ag-shell sol (that is, the moving substrate) to the above-mentioned R6G-contaminated glass slide. After about 1min of infiltration, we could easily suspend 10 -8 M R6G signal, see the results Figure 9 , this test result is of great significance to the on-site inspection.
[0092]
[0093] Experiment 6
[0094] The on-site simulation test was carried out for the hallucinogenic drug methamphetamine and the pesticide methyl parathion, and the effect was very obvious. See Figure 10.
[0095] Figure 9 A is that we will use a syringe to extract methamphetamine, dry the syringe, and then measure the surface without methamphetamine signal, and then drop our synthetic Ag-shell sol (moving substrate) on the surface of the syringe, using one of the methods mentioned above. Fourth, it can be easily extracted from the surface of the syringe 10 -4 M meth signal;
[0096] We again combine the saliva of healthy people with 10 -4 M methamphetamine is mixed in a ratio of 1:1 by volume, and then dropped on a clean glass slide (simulating ground), and after it is naturally dried in the air, we measure its signal, and there is no signal, and then also with the help of the fourth method above, we can It is easy to extract drug signals from the residual saliva on drug use sites.
[0097] Figure 9 B is that we apply 10 on the washed orange peel -6 M methyl parathion and then let it dry naturally to simulate pesticide residues on the surface of agricultural products. We directly detect orange peels, and we can only measure the background signals of two orange peels. When we use the fourth method above, 10 -6M methyl parathion signal is presented, see Figure 9 B.
[0098]
[0099] Remarks: R6G is the most common SERS probe molecule, and its chemical name is Rhodamine 6G;
[0100] 4-MPy is a common SERS probe molecule, and its chemical name is 4-mercaptopyridine;
[0101] 4-ATP is a common SERS probe molecule, and its chemical name is 4-aminothiophenol.