Fault line selecting method based on k-means cluster analysis for power distribution network
A distribution network fault and cluster analysis technology, applied in the direction of fault location, etc., can solve the problems of complex fault line selection and low correct rate of line selection
- Summary
- Abstract
- Description
- Claims
- Application Information
AI Technical Summary
Problems solved by technology
Method used
Image
Examples
Embodiment 1
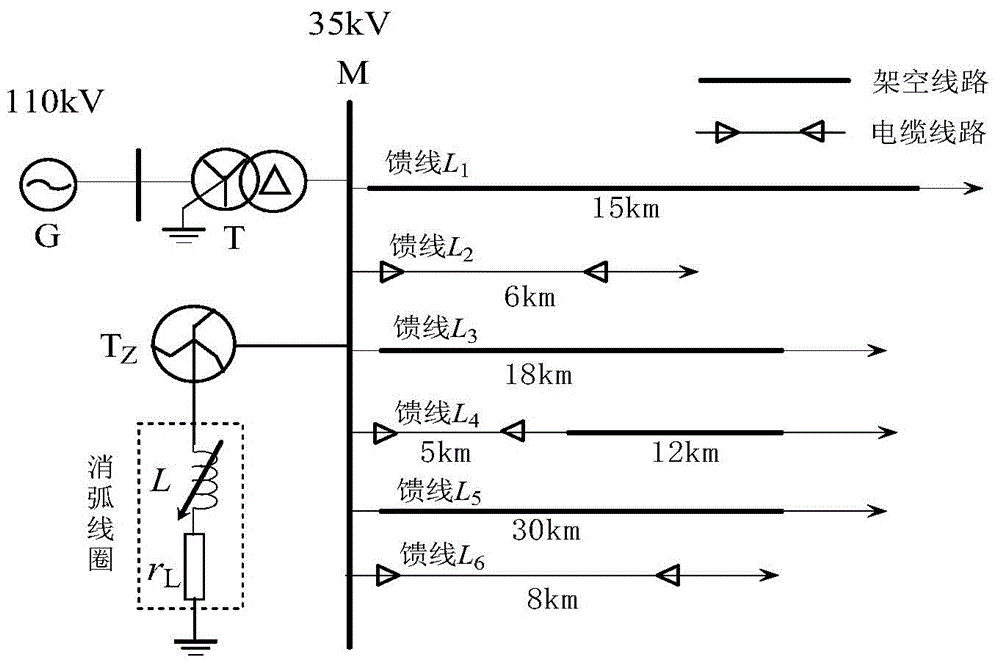
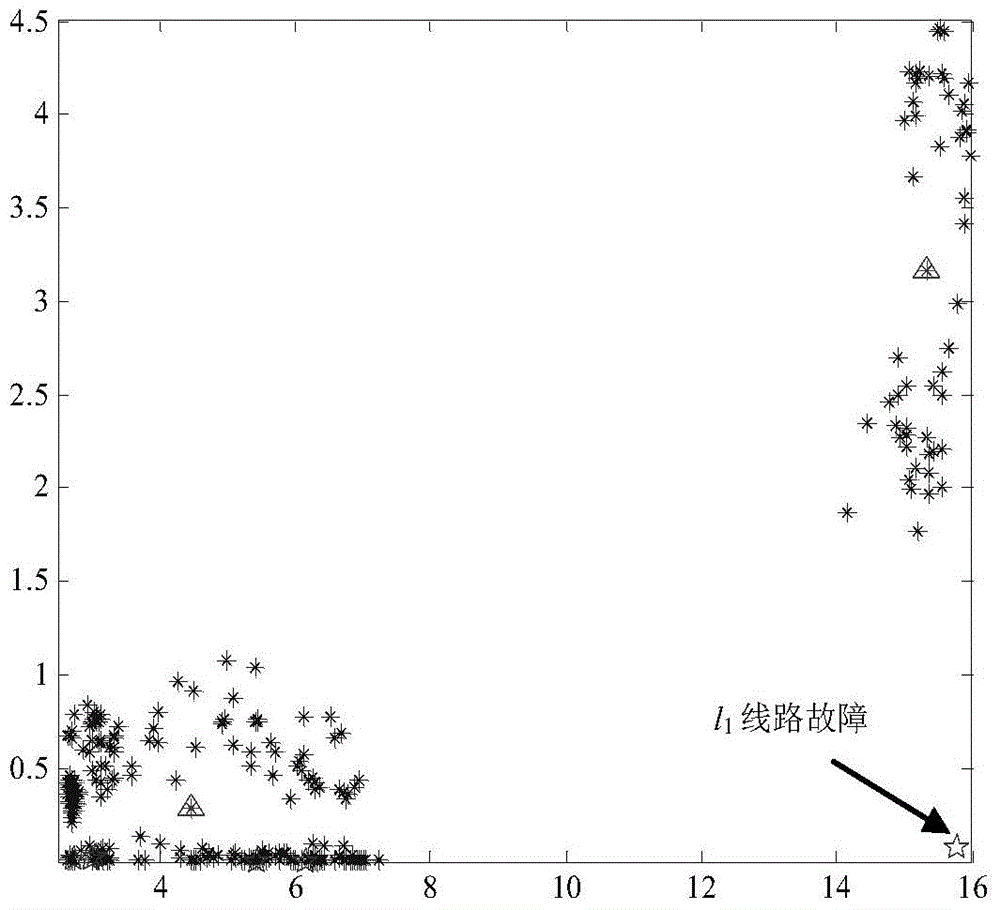
[0039] Example 1: Now select fault points every 2km along the overhead line, every 1km on the cable line, and form 318 fault sample data under the condition that the transition resistance is 20Ω and the fault initial phase angle is 90°. The data length is 5ms. now assume l 1 A phase-to-ground fault occurs 1km away from terminal M, the initial phase angle of the fault is 10°, and the transition resistance is 20Ω.
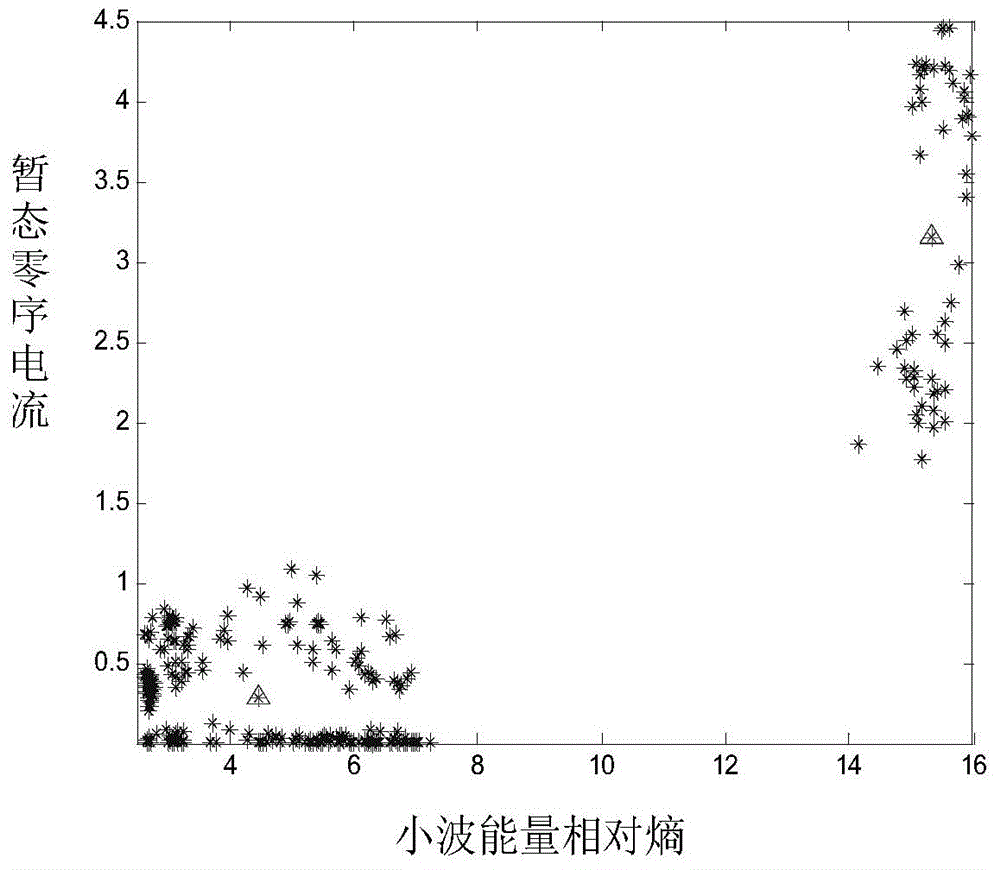
[0040] (1) The two types of cluster centers obtained by the k-means cluster analysis method are the unfaulted centers C 1 , fault center C 2 . where C 1 =(4.476,0.2806),C 2 =(15.347,3.1574). Analysis results such as figure 2 shown.
[0041] (2) After the test data is decomposed by db10 wavelet, its transient zero-sequence current energy and comprehensive wavelet relative energy entropy are calculated, and the fault line is judged according to the Euclidean distance between the test data and the two cluster centers.
[0042] which is
[0043] ...
Embodiment 2
[0046] Example 2: Now select fault points every 2km along the overhead line, every 1km on the cable line, and form 318 fault sample data under the condition that the transition resistance is 20Ω and the fault initial phase angle is 90°. The data length is 5ms. now assume l 1 A phase-to-ground fault occurs 14km away from terminal M, the initial phase angle of the fault is 90°, and the transition resistance is 200Ω.
[0047] (1) The two types of cluster centers obtained by the k-means cluster analysis method are the unfaulted centers C 1 , fault center C 2 . where C 1 =(4.476,0.2806),C 2 =(15.347,3.1574). Analysis results such as figure 2 shown.
[0048] (2) After the test data is decomposed by db10 wavelet, its transient zero-sequence current energy and comprehensive wavelet relative energy entropy are calculated, and the fault line is judged according to the Euclidean distance between the test data and the two cluster centers.
[0049] which is
[0050] ...
Embodiment 3
[0053] Embodiment 3: Now select fault points every 2km along the overhead line, every 1km on the cable line, and form 318 fault sample data under the condition that the transition resistance is 20Ω and the fault initial phase angle is 90°. The data length is 5ms. now assume l 2 A phase-to-ground fault occurs 3km away from terminal M, the initial phase angle of the fault is 30°, and the transition resistance is 20Ω.
[0054] (1) The two types of cluster centers obtained by the k-means cluster analysis method are the unfaulted centers C 1 , fault center C 2 . where C 1 =(4.476,0.2806),C 2 =(15.347,3.1574). Analysis results such as figure 2 shown.
[0055] (2) After the test data is decomposed by db10 wavelet, its transient zero-sequence current energy and comprehensive wavelet relative energy entropy are calculated, and the fault line is judged according to the Euclidean distance between the test data and the two cluster centers.
[0056] which is
[0057] ...
PUM
 Abstract
Description
Claims
Application Information
 - R&D
- Intellectual Property
- Life Sciences
- Materials
- Tech Scout
- Unparalleled Data Quality
- Higher Quality Content
- 60% Fewer Hallucinations
Browse by: Latest US Patents, China's latest patents, Technical Efficacy Thesaurus, Application Domain, Technology Topic, Popular Technical Reports.
© 2025 PatSnap. All rights reserved.Legal|Privacy policy|Modern Slavery Act Transparency Statement|Sitemap|About US| Contact US: help@patsnap.com


