Crystal form of JAK inhibitor and preparation method thereof
A crystal form and solvent technology, applied in organic chemical methods, anti-inflammatory agents, pharmaceutical formulations, etc., can solve problems affecting drug absorption and bioavailability, differences in clinical efficacy, solubility and stability, etc.
- Summary
- Abstract
- Description
- Claims
- Application Information
AI Technical Summary
Problems solved by technology
Method used
Image
Examples
Embodiment 1
[0138] The preparation method of formula (I) compound crystal form I:
[0139] Add 39.5 mg of the compound of formula (I) to 1.5 mL of acetone to obtain a suspension, place the suspension in a constant temperature incubator at 50°C and stir for 100 minutes, then filter while it is hot to obtain a clear solution, at a rate of 0.1°C per minute The temperature was slowly lowered to 5°C, and solids were precipitated. The solids in the lower layer were taken by centrifugation, and dried overnight at a constant temperature of 25°C. After testing, the obtained solids were crystal form I.
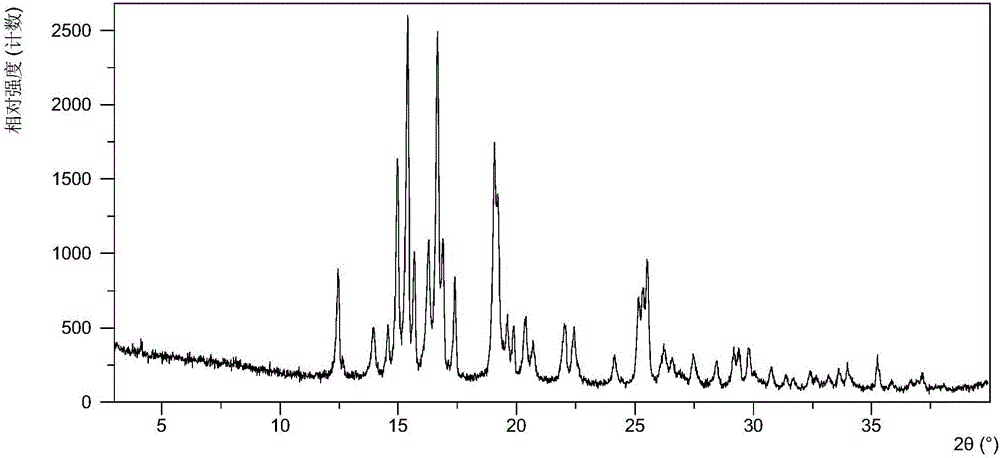
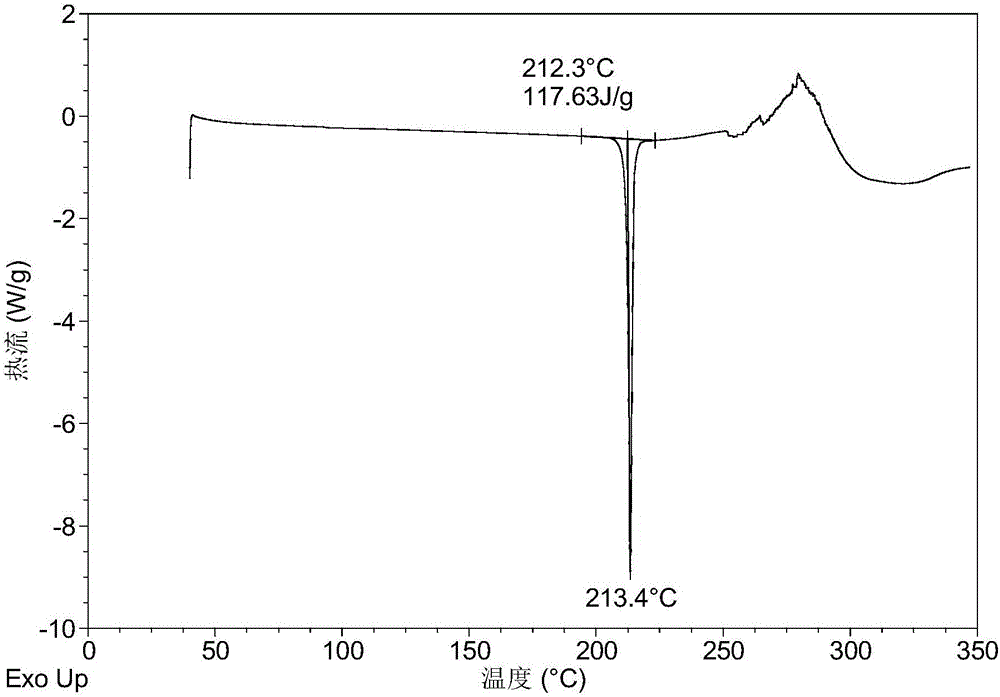
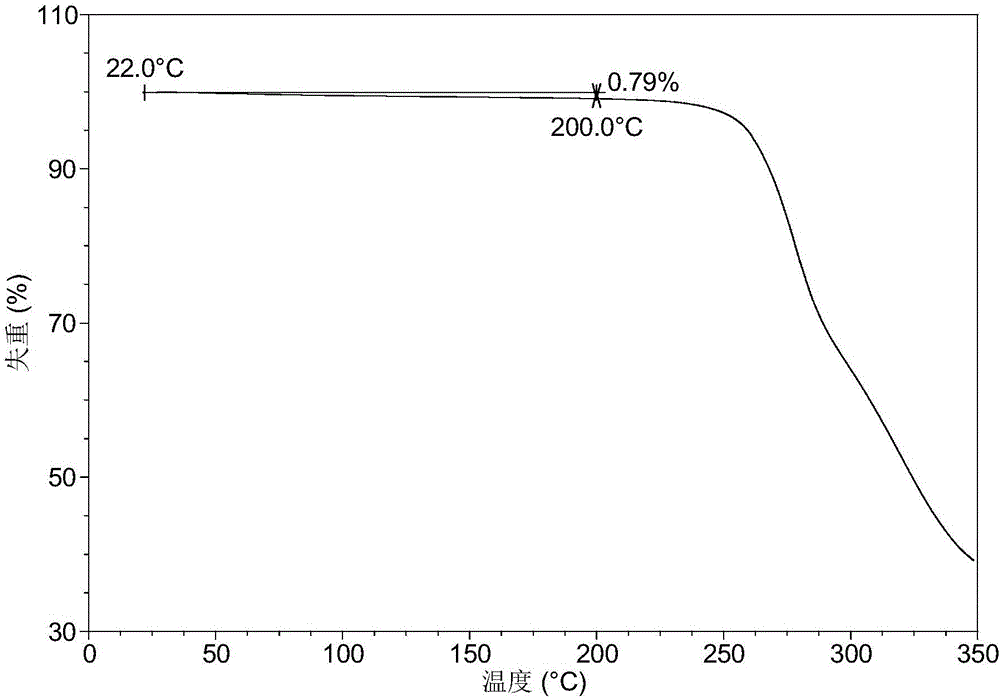
[0140] Table 1 shows the X-ray powder diffraction data of the crystal forms obtained in this example. Its XRPD pattern is as follows figure 1 , and its DSC graph is shown in figure 2 , and its TGA figure is shown in image 3 .
[0141] Table 1
[0142]
[0143]
Embodiment 2
[0145] The preparation method of formula (I) compound crystal form I:
[0146] 5.16 mg of the compound of formula (I) was dissolved in 1.80 mL of dichloromethane, evaporated at room temperature, and the obtained solid was detected as crystal form I.
[0147] The X-ray powder diffraction data of the crystal forms obtained in this example are shown in Table 2.
[0148] Table 2
[0149]
[0150]
Embodiment 3
[0152] The preparation method of formula (I) compound crystal form II:
[0153] 106.3 mg of the compound of formula (I) was dissolved in 1.0 mL of glacial acetic acid, and slowly evaporated at room temperature, and the obtained solid was detected as crystal form II.
[0154] The X-ray powder diffraction data of the crystal forms obtained in this example are shown in Table 3. Its XRPD pattern is as follows Figure 5 , and its DSC graph is shown in Image 6 , and its TGA figure is shown in Figure 7 ,That 1 H-NMR picture as Figure 8 , 1 The H-NMR data are as follows:
[0155] 1 H-NMR(400MHz,DMSO-d6)δ12.13(s,1H),8.92(s,1H),8.71(s,1H),8.47(s,1H),7.62(dd,J 1 =2.4Hz,J 2 =3.2Hz,1H),7.08(dd,J 1 =1.2Hz,J 2 =3.2Hz,1H),4.60(d,J=9.2Hz,2H),4.24(d,J=9.2Hz,2H),3.69(s,2H),3.23(q,J=7.2Hz,2H), 1.90(s, 3H), 1.25(t, J=7.2Hz, 3H).
[0156] table 3
[0157]
[0158]
PUM
 Abstract
Description
Claims
Application Information
 - R&D
- Intellectual Property
- Life Sciences
- Materials
- Tech Scout
- Unparalleled Data Quality
- Higher Quality Content
- 60% Fewer Hallucinations
Browse by: Latest US Patents, China's latest patents, Technical Efficacy Thesaurus, Application Domain, Technology Topic, Popular Technical Reports.
© 2025 PatSnap. All rights reserved.Legal|Privacy policy|Modern Slavery Act Transparency Statement|Sitemap|About US| Contact US: help@patsnap.com


