

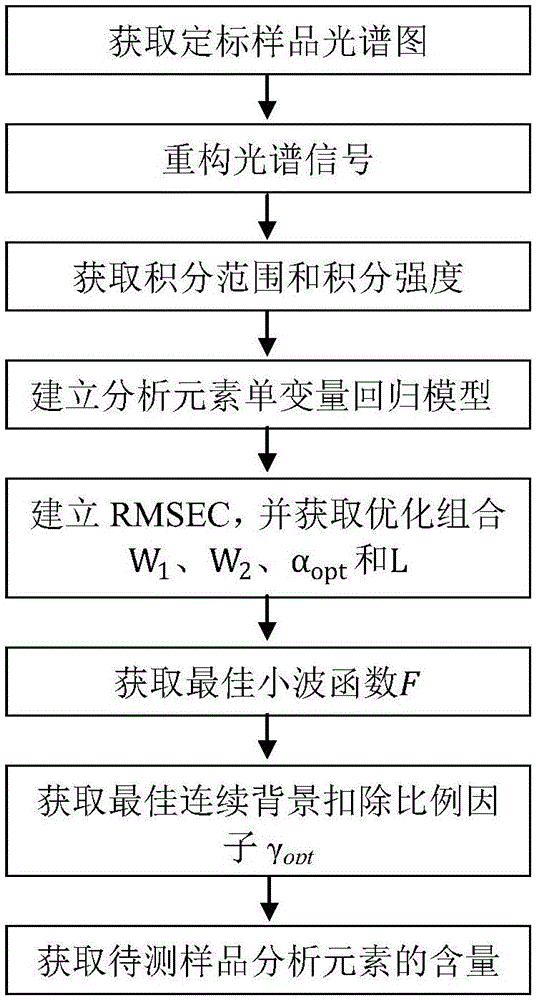
Method of improving precision of quantitative analysis of overlapping peak of laser induced breakdown spectrometry
A technology of laser-induced breakdown and quantitative analysis, which is applied in thermal excitation analysis, material excitation analysis, and material analysis through optical means, etc. It can solve the problem of low accuracy, low accuracy, and inability to accurately remove overlapping peaks in quantitative analysis, etc. problem, to achieve the effect of simplifying the process of interference correction, reducing hardware cost and important application value
- Summary
- Abstract
- Description
- Claims
- Application Information
AI Technical Summary
Problems solved by technology
Method used
Image

Examples
Embodiment 1
[0088] (1) LIBS spectral data acquisition of samples
[0089] The experimental samples were selected from 6 kinds of microalloy steel standard samples (No. GSB03-2453-2008, developed by the Institute of Analysis and Testing of the General Iron and Steel Research Institute and Maanshan Iron and Steel Co., Ltd.). Table 1 shows.
[0090] Table 1
[0091]
[0092]The experimental device is an ordinary laser-induced breakdown spectroscopy device. The experiment is carried out in an air environment. A Q-switched Nd:YAG pulsed laser (Beamtech Nimma 400, wavelength 532nm, repetition frequency 3Hz, pulse width 8ns) is used, and the laser energy is 80mJ / pulse. The laser is focused onto the sample surface through a mirror and a plano-convex lens (focal length 15 cm). To prevent air breakdown, the focal point is 4 mm below the sample surface. The acquisition delay time was set to 2 μs, the gate width was set to 10 μs, the excited plasma radiation was collected by the light collect...
Embodiment 2
[0108] (1) LIBS spectral data acquisition of samples
[0109] The experimental samples were selected from 6 kinds of microalloy steel standard samples (No. GSB03-2453-2008, developed by the Institute of Analysis and Testing of the General Iron and Steel Research Institute and Maanshan Iron and Steel Co., Ltd.). 4. The sample LIBS spectral data was collected under the same experimental conditions, and each sample was collected 6 times, and 30 pulses were accumulated for each spectrum.
[0110] Table 4
[0111]
[0112] (2) Acquisition of overlapping spectral line parameters, decomposition layer number l, spectral line integration range w 1 、w 2 and the optimization of the overlapping interference factor α
[0113] Query the NIST standard atomic spectrum database, combined with the actual spectrum, to determine the central wavelength of the analytical element line V and the interference line Fe are 292.40nm and 292.38nm, respectively. In the wavelet function, take db1, t...
Embodiment 3
[0127] (1) LIBS spectral data acquisition of samples
[0128] The experimental samples were selected from 6 kinds of microalloy steel standard samples (No. GSB03-2453-2008, developed by the Institute of Analysis and Testing of the General Iron and Steel Research Institute and Maanshan Iron and Steel Co., Ltd.). The contents of trace metal elements Mn and Cr in the samples are shown in Table 7. . The sample LIBS spectral data was collected under the same experimental conditions, and each sample was collected 6 times, and 30 pulses were accumulated for each spectrum.
[0129] Table 7
[0130]
[0131](2) Acquisition of overlapping spectral line parameters, decomposition layer number l, spectral line integration range w 1 、w 2 and the optimization of the overlapping interference factor α
[0132] Query the NIST standard atomic spectrum database, combined with the actual spectrum, determine the central wavelength of the analytical element line Mn and the interference line C...
PUM
| Property | Measurement | Unit |
|---|---|---|
| wavelength | aaaaa | aaaaa |
| wavelength | aaaaa | aaaaa |
| wavelength | aaaaa | aaaaa |
Abstract
Description
Claims
Application Information