Method for measuring and evaluating quality of peanut raw material for protein processing
A peanut and quality technology, applied in biological testing, material inspection products, testing food, etc., can solve the problems of reducing product quality, lack of processing suitability evaluation methods, and increasing costs, to improve texture quality, improve product quality, Enhanced chewing effect
- Summary
- Abstract
- Description
- Claims
- Application Information
AI Technical Summary
Problems solved by technology
Method used
Image
Examples
Embodiment 1
[0027] Embodiment 1, the establishment of the peanut quality determination model suitable for protein processing
[0028] (1) Determination of Peanut Quality
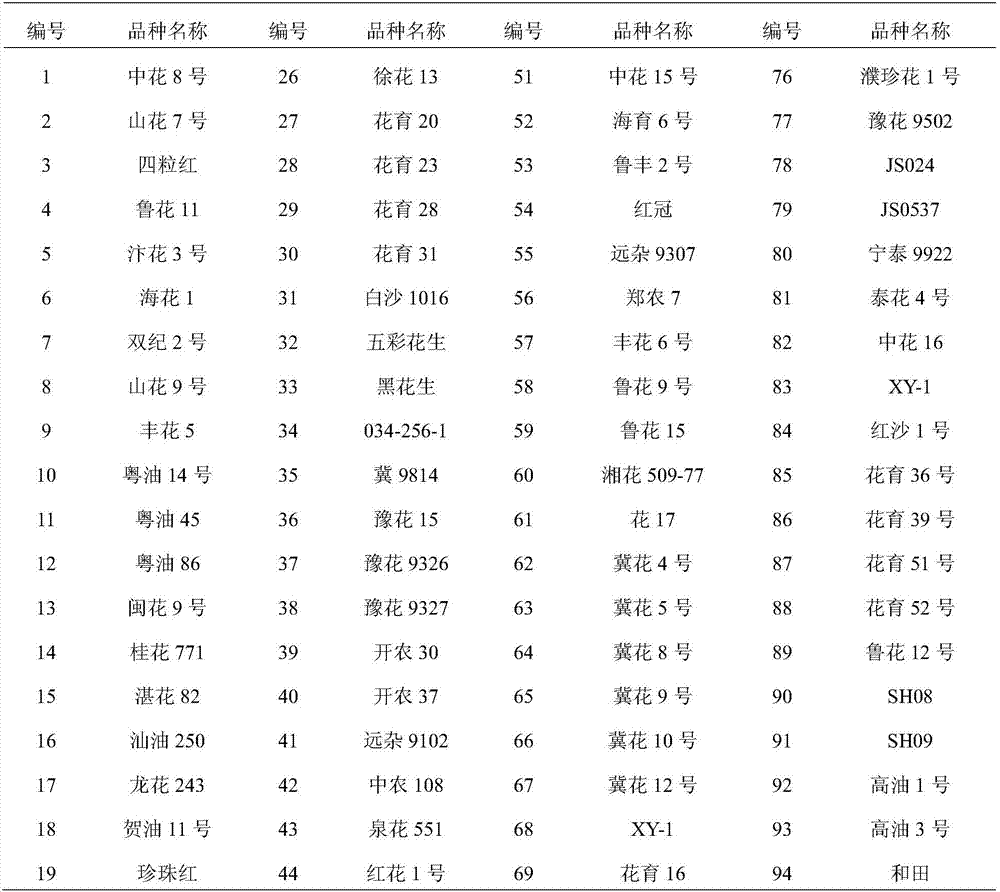
[0029] Get the peanut sample harvested in 2016 as a standard, 100 samples (conforming to the normal distribution law of the peanut population, as shown in Table 1);
[0030] Table 1 100 varieties of peanuts
[0031]
[0032]
[0033] A total of 45 indicators were measured for the sensory quality, physical and chemical and nutritional quality and processing quality indicators of each variety; among them, each indicator and its measurement methods and standards are as follows:
[0034] Peanut physical characteristics: fruit shape: when the fruit shape of the peanut sample is hockey stick shape, the fruit shape score is 1; when the peanut sample fruit shape is hump shape, the fruit shape score is 2; when the peanut sample fruit shape is beaded When the fruit shape of the peanut sample is normal, the fruit shape sco...
Embodiment 2
[0081] Embodiment 2, the mensuration of peanut protein powder quality
[0082] The remaining 20 peanut varieties in Example 1 were subjected to protein powder quality determination.
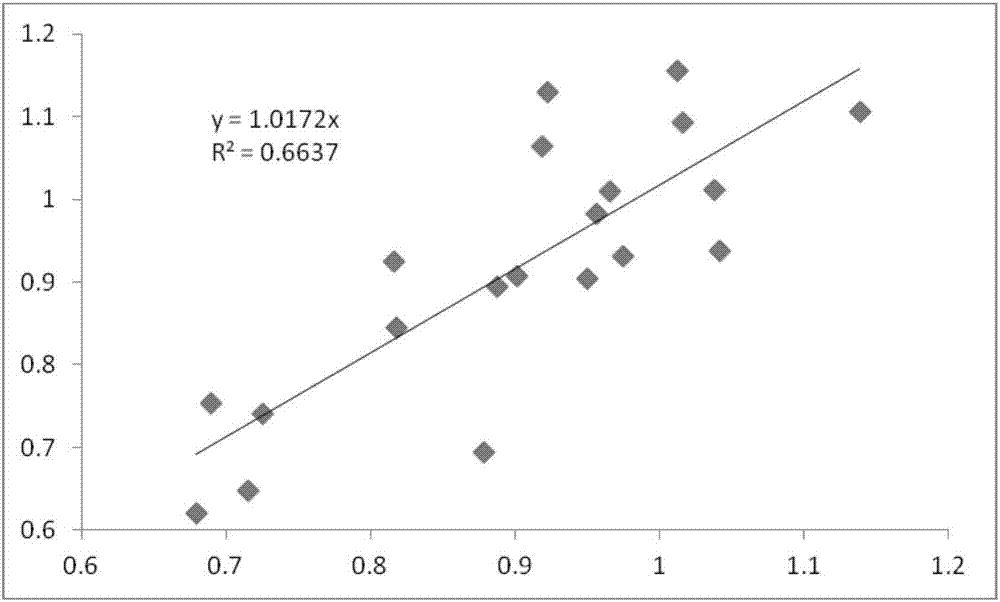
[0083] Six indicators including the fruit shape score, crude protein content, leucine content, arginine content, conanutin Ⅰ and the subunit with a molecular weight of 23.5kDa accounted for the protein mass percentage of the 20 peanut varieties were substituted into Formula (1) calculates the protein powder quality of 20 varieties, and the comparison between the model prediction value and the chemical measured value of the peanut protein powder quality is shown in Table 8; The correlation coefficient between the two is 0.815, such as figure 1 shown.
[0084] Table 8 Comparison of model prediction value and chemical determination of peanut protein powder quality
[0085]
[0086]
Embodiment 3
[0087] Example 3, Establishment of Peanut Quality Evaluation Method Suitable for Protein Processing
[0088] The protein powder quality of 100 peanut varieties was divided into suitable and basically suitable categories by K-means cluster analysis and actual conditions (Table 9).
[0089] Table 9 Analysis of protein powder processing suitability
[0090]
[0091] Unsuitable for the remaining 52 varieties.
[0092] The weight of each index is determined according to the regression coefficient, and the K-means cluster analysis and the actual situation are used to divide each evaluation index into grade I, grade II and grade III, and the weight value of each index is regarded as grade I score, and so on.
[0093] Table 10 The weight of each indicator in formula (1)
[0094]
[0095] K-means cluster analysis was carried out on the six quality indexes of peanuts, and each index was divided into three categories, namely grade I (suitable), grade II (basically suitable) and g...
PUM
 Abstract
Description
Claims
Application Information
 - R&D
- Intellectual Property
- Life Sciences
- Materials
- Tech Scout
- Unparalleled Data Quality
- Higher Quality Content
- 60% Fewer Hallucinations
Browse by: Latest US Patents, China's latest patents, Technical Efficacy Thesaurus, Application Domain, Technology Topic, Popular Technical Reports.
© 2025 PatSnap. All rights reserved.Legal|Privacy policy|Modern Slavery Act Transparency Statement|Sitemap|About US| Contact US: help@patsnap.com


