A method for fluorescence detection of fluoride ion concentration in solution

A fluoride ion and concentration technology, applied in the field of analysis and detection, can solve the problems of slow detection speed, quantitative detection, poor sensitivity, etc., and achieve the effect of simple material, low price and accurate quantitative analysis

Active Publication Date: 2020-10-02
CAPITAL NORMAL UNIVERSITY
View PDF6 Cites 0 Cited by
  • Summary
  • Abstract
  • Description
  • Claims
  • Application Information

AI Technical Summary

Problems solved by technology

However, the current common analysis methods have many defects, such as slow detection speed, poor sensitivity or incapable of accurate and effective quantitative detection

Method used


Image

  • A method for fluorescence detection of fluoride ion concentration in solution
  • A method for fluorescence detection of fluoride ion concentration in solution
  • A method for fluorescence detection of fluoride ion concentration in solution

Examples


Embodiment 1

[0066] Example 1, 4-aminosalicylic acid-iron (III) complex modification of NaLuF 4 : Yb, Er rare earth nanomaterials to detect the concentration of fluoride ion solution:

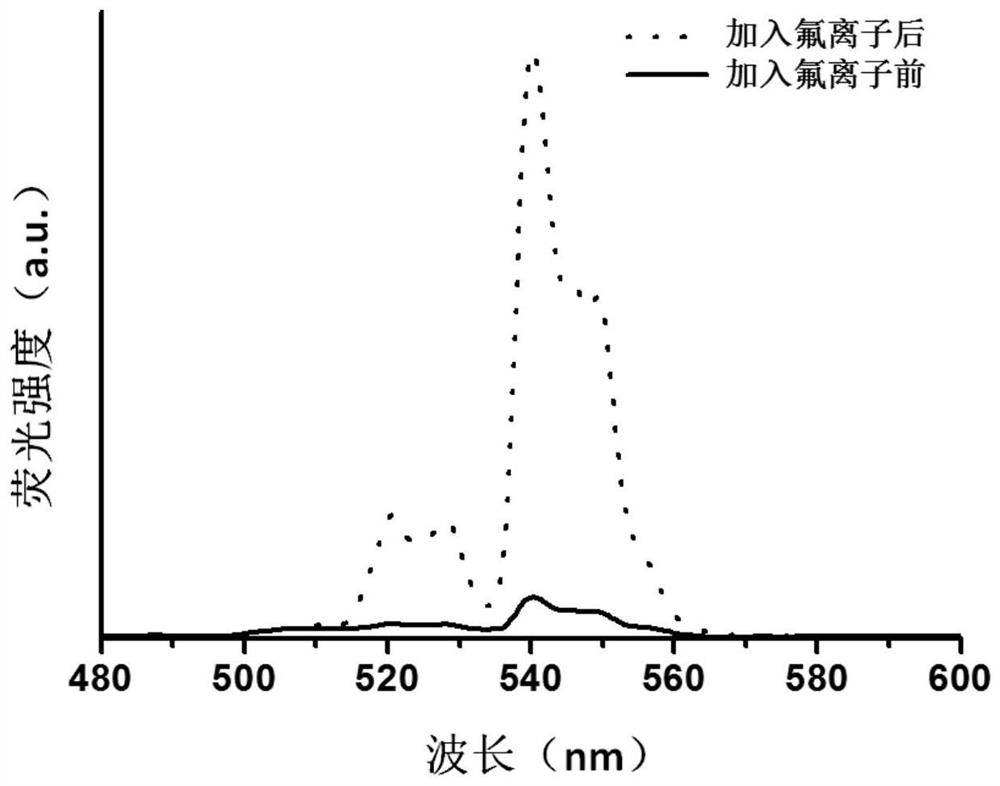
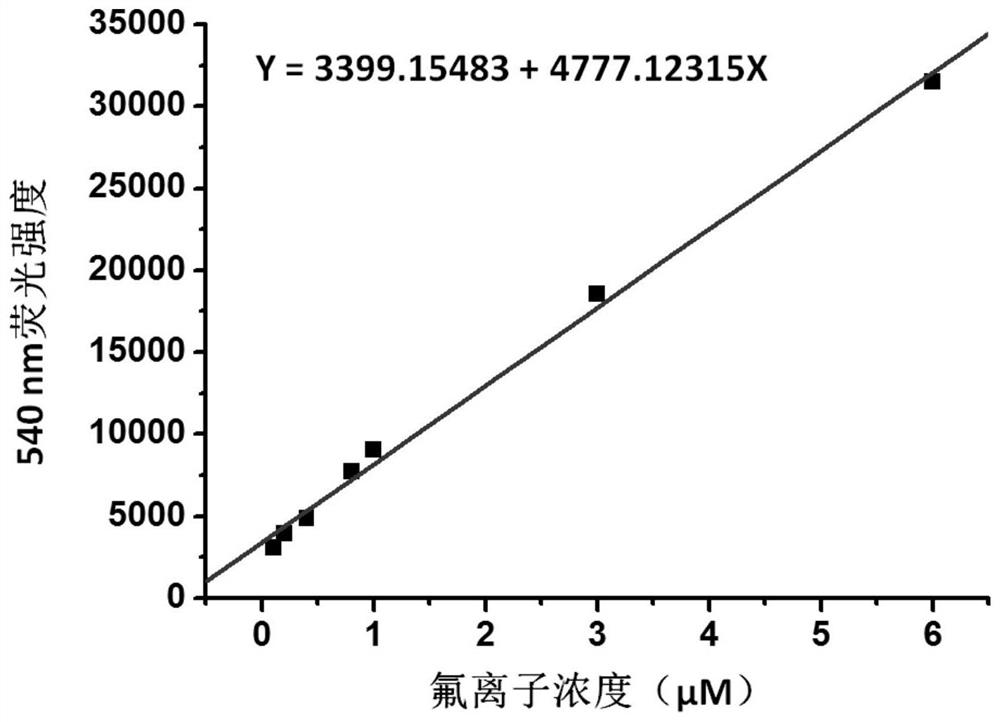
[0067] 1) Drawing of standard curve: 100 μL of 5nM, 10nM, 20nM, 50nM, 100nM, 200nM, 500nM, 1μM, 2μM, 4μM, 8μM, 10μM, 30μM, 60μM, 130μM, 260μM fluoride ion solution and 900μL concentration of 1mM 4-aminosalicylic acid-iron(III) complex modified NaLuF 4 : The Yb and Er aqueous solutions are evenly mixed, and after standing at 25°C for 10 minutes, the reaction is complete. Measure the fluorescence spectrum of the mixture under the irradiation of 980nm near-infrared light, process the data to obtain the fluorescence linear spectrum, and obtain the concentration of the fluoride ion aqueous solution A standard curve with fluorescence intensity at 540 nm, such as image 3 shown. From image 3 It can be known that the standard spectrum has good linearity in the concentration range of 100nM-6μM, the correlation ...

Embodiment 2

[0070] Embodiment 2, NaYbF modified by gallic acid-iron (III) complex 4 : Tm rare earth nanomaterials to detect the concentration of fluoride ion solution:

[0071] 1) Drawing of standard curve: 100 μL of 5nM, 10nM, 20nM, 50nM, 100nM, 200nM, 500nM, 1μM, 2μM, 4μM, 8μM, 10μM, 30μM, 60μM, 130μM, 260μM fluoride ion solution and 900μL concentration of 1 mM gallic acid-iron(III) complex modified NaYbF 4 : The Tm aqueous solution is uniformly mixed, and after standing at 25°C for 10 minutes, the reaction is complete. Measure the fluorescence spectrum of the mixed solution under the irradiation of 980nm near-infrared light, process the data to obtain a linear spectrum of fluorescence, and obtain the concentration of the fluoride ion aqueous solution and 800nm standard curve of fluorescence intensity at Figure 6 shown. From Figure 6 It can be known that the standard spectrum has good linearity in the concentration range of 20nM-3μM, the correlation coefficient R reaches 0.9972, a...

Embodiment 3

[0074] Example 3, NaYF modified by 1,2,3-pyrogallol-titanium (IV) complex 4 : Yb, Tm rare earth nanomaterials to detect the concentration of fluoride ion solution:

[0075] 1) Drawing of standard curve: 100 μL of 5nM, 10nM, 20nM, 50nM, 100nM, 200nM, 500nM, 1μM, 2μM, 4μM, 8μM, 10μM, 30μM, 60μM, 130μM, 260μM fluoride ion solution and 900μL concentration of 1mM NaYF modified by 1,2,3-pyrogallol-titanium(IV) complex 4 : The Yb and Tm aqueous solutions are evenly mixed, and after standing at 25°C for 10 minutes, the reaction is complete. Measure the fluorescence spectrum of the mixture under the irradiation of 980nm near-infrared light, process the data to obtain the fluorescence linear spectrum, and obtain the concentration of the fluoride ion aqueous solution A standard curve with fluorescence intensity at 470 nm, such as Figure 9 shown. From Figure 9 It can be known that the standard spectrum has good linearity in the concentration range of 50nM-26μM, the correlation coeff...


PUM

PropertyMeasurementUnit
wavelengthaaaaaaaaaa
diameteraaaaaaaaaa
lengthaaaaaaaaaa

Abstract

The invention discloses a method for performing fluorescence detection on concentration of fluorinion in a liquid. The method comprises the following steps: 1) drawing a standard curve: performing reaction at least 3 groups of fluorinion standard liquid with different concentration and a phenol-metal complex modified rare earth material separately to obtain different mixed liquid, and measuring the light-emitting intensity separately; and performing linear fitting by taking the light-emitting intensity as a vertical coordinate and the concentration of the fluorinion standard liquid as a horizontal coordinate to obtain a standard curve; and 2) detecting the fluorinion concentration of a to-be-detected fluorinion liquid: performing reaction on the to-be-detected fluorinion liquid and the phenol-metal complex modified rare earth material to obtain mixed liquid, measuring the light-emitting intensity of the mixed liquid, and comparing with the standard curve in the step 1) to obtain the fluorinion concentration of the to-be-detected liquid. Quantitative detection on the fluorinion can be realized rapidly, sensitively and accurately by utilizing the change of a fluorescence signal of the phenol-metal complex modified rare earth material.

Description

technical field [0001] The invention relates to a method for detecting the concentration of fluoride ions in a solution by fluorescence, and belongs to the technical field of analysis and detection. Background technique [0002] Fluorine is an important constant element in the human body, mainly in the form of fluoride ions. However, excess fluoride ions can lead to physiological phenomena such as reproductive toxicity, bone embrittlement, abnormal calcium accumulation, and dental fluorosis, which are commonly referred to as manifestations of fluorosis. Because fluoride ions can be ingested by the human body through various methods such as inhalation, ingestion, and skin contact, the disease fluorosis has a relatively high incidence in many countries including my country. Traditional fluoride ion detection methods are mainly realized by colorimetry and electrochemical methods. However, the current common analysis methods have many defects, such as slow detection speed, poo...

Claims


Application Information

Patent Timeline
Patent Type & Authority Patents(China)
IPC IPC(8): G01N21/64C09K11/85C09K11/02
CPCC09K11/025C09K11/7773G01N21/6428G01N21/643
Inventor 周晶刘瑜鑫蒋安琪
Owner CAPITAL NORMAL UNIVERSITY
Why Eureka
Try Eureka