Detection method for glucose
A detection method and technology for glucose, applied in the field of medical detection, can solve the problems of low specificity, narrow detection range, low sensitivity, etc.
- Summary
- Abstract
- Description
- Claims
- Application Information
AI Technical Summary
Problems solved by technology
Method used
Image
Examples
Embodiment 1
[0014] Embodiment 1 Synthesis of manganese dioxide nanoparticles
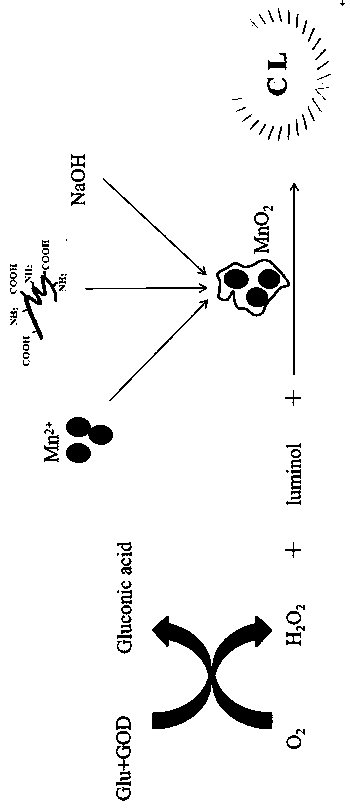
[0015] Add 0.1g BSA to 40mL 0.01mol L −1 Stir well in PBS buffer, then add 400µl 0.1MMnSO 4 solution, stirred at room temperature for 2 min; 400 µl 1M NaOH aqueous solution was added to the above mixture, and vigorously stirred for 7 h; after stirring, dialyzed in double distilled water for 48 h; Manganese nanoparticles MnO 2 NPs are prepared; the prepared MnO 2 NPs were stored in a 4°C refrigerator for later use.
Embodiment 2
[0016] Example 2 Construction of Glucose Detection System
[0017] 1. Build the system
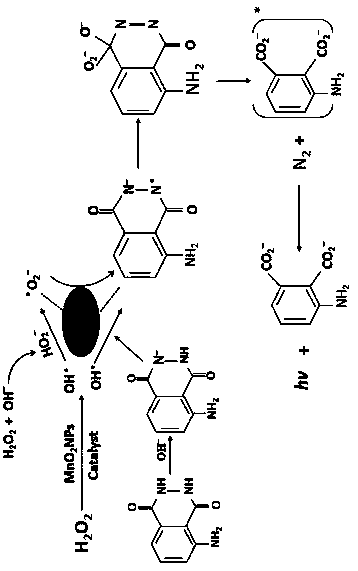
[0018] First, 100 µl of glucose solutions of different concentrations (0.05, 0.158, 0.5, 1.58, 5, 15.8 mM) were mixed with 20 µl of glucose oxidase (GOD, 1 mg·ml -1 ) solutions were mixed, and the mixed solution was reacted on a water-bath shaker at 35°C for 8 min; then, 100 μl of the above-mentioned reacted solution was mixed with 100 μl NaOH (pH 12) 2 NPs (0.1mg·ml -1 ) and 50µl luminol (5×10- 5 M) working solution mixing; CL signal was measured with a full-band multifunctional microplate reader; all reactions were carried out in a light-tight white Greiner 96-well plate. With the logarithm of the glucose concentration as the abscissa and the CL signal as the ordinate, draw a standard curve.
[0019] 2. MnO 2 Verification experiment of signal amplification effect of NPs
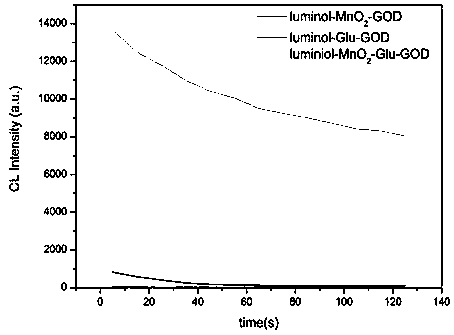
[0020] In order to prove that MnO 2 The significant enhancement effect of NPs on the luminescent signal, refer...
Embodiment 3
[0023] Example 3 Sensitivity experiment of detection system
[0024] Under optimal working conditions, calculate the linear relationship between different concentrations of glucose and chemiluminescent intensity. The linear regression equation is y=5127.3x-8293.3 (where x is the logarithm of the glucose concentration based on 10, and y is the chemiluminescent intensity), and the correlation coefficient is 0.997; the linear range is 50μM~15.8mM ( Figure 8 ), and the detection limit was 44.7 μM (signal-to-noise ratio S / N=3).
PUM
 Abstract
Description
Claims
Application Information
 - R&D
- Intellectual Property
- Life Sciences
- Materials
- Tech Scout
- Unparalleled Data Quality
- Higher Quality Content
- 60% Fewer Hallucinations
Browse by: Latest US Patents, China's latest patents, Technical Efficacy Thesaurus, Application Domain, Technology Topic, Popular Technical Reports.
© 2025 PatSnap. All rights reserved.Legal|Privacy policy|Modern Slavery Act Transparency Statement|Sitemap|About US| Contact US: help@patsnap.com


