Unlock instant, AI-driven research and patent intelligence for your innovation.
Infrared weak and small target detection method and detection system
What is Al technical title?
Al technical title is built by PatSnap Al team. It summarizes the technical point description of the patent document.
A technology of weak and small targets and detection methods, applied in the field of image processing, can solve problems such as poor real-time performance and limitations
Pending Publication Date: 2020-10-30
CHANGCHUN INST OF OPTICS FINE MECHANICS & PHYSICS CHINESE ACAD OF SCI
View PDF6 Cites 4 Cited by
Summary
Abstract
Description
Claims
Application Information
AI Technical Summary
This helps you quickly interpret patents by identifying the three key elements:
Problems solved by technology
Method used
Benefits of technology
Problems solved by technology
The detection theory based on image sequence is to estimate the target through the correlation in the sequence image. An important premise of this type of algorithm is to ensure the consistency between the target and the background between consecutive frames, as well as some prior target information. These premise and Prior information limits the application of this type of algorithm. In addition, the detection method based on sequence images realizes target detection through multi-frame target trajectory confirmation, which has a better effect on low signal-to-clutter ratio imaging scenes, but compared As far as the algorithm is concerned, its real-time performance is poor, and it is rarely used in practical engineering applications.
Method used
Image
Click on the blue label to locate the original text in one second.
Reading with bidirectional positioning of images and text.
Examples
Embodiment 1
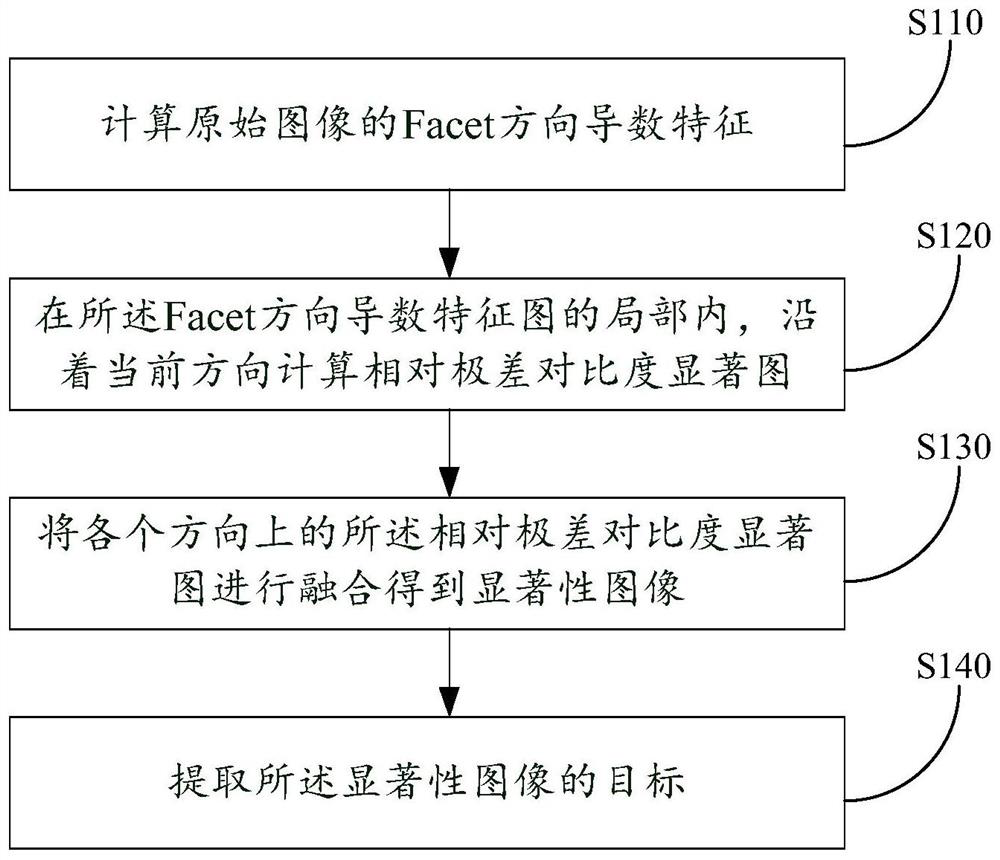
[0056] see figure 1 , the infrared weak and small target detection method provided in Embodiment 1 of the present invention, comprises the following steps:
[0057] Step S110: Calculate the Facet direction derivative feature of the original image.
[0058]In some preferred embodiments, in the step of calculating the Facet direction derivative feature of the original image, the following steps are included:
[0059] Based on the Facet model, the expression of a binary cubic polynomial f(r,c) is fitted to the gray intensity surface in the 5x5 neighborhood of the original image, the expression is as follows, where r, c are the row and column coordinates in the 5x5 neighborhood , K i is the fit coefficient:
[0060]
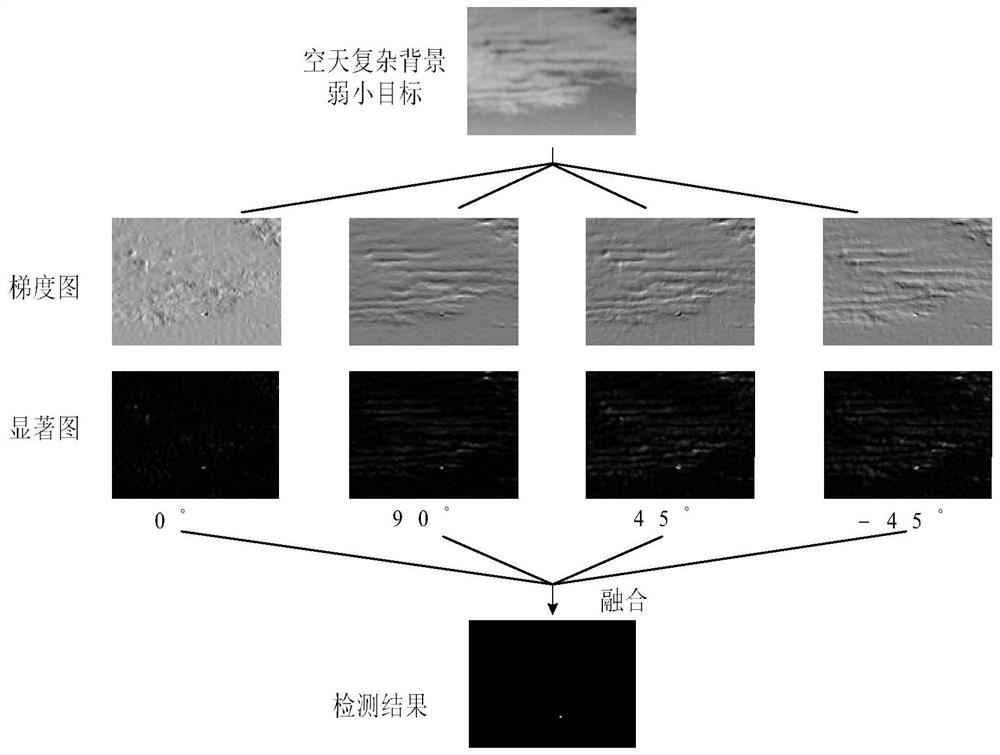
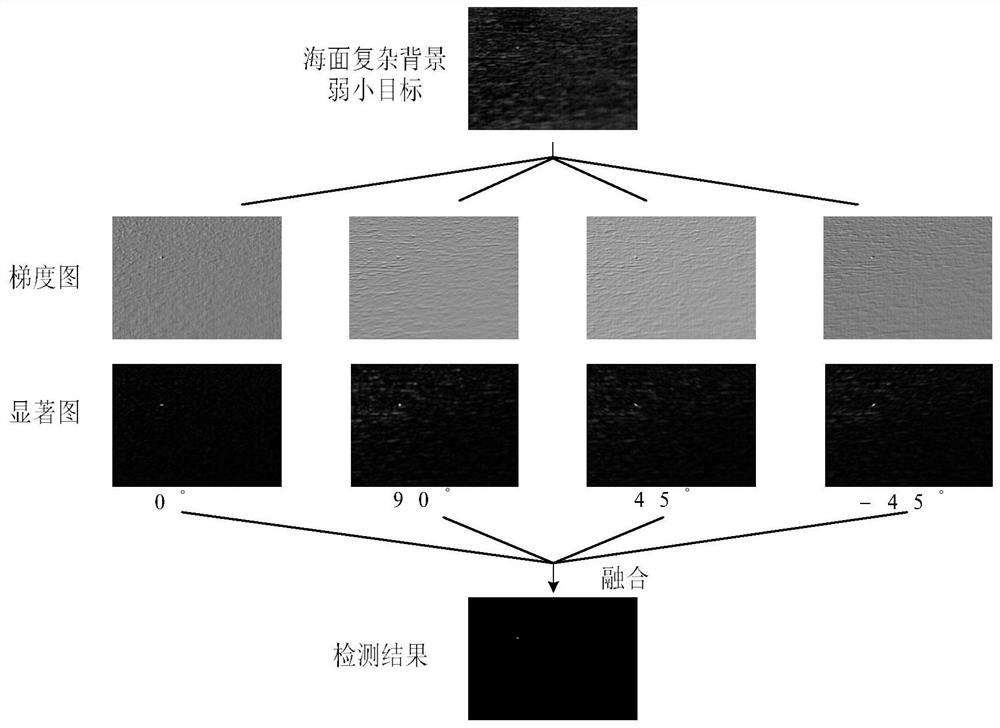
[0061] The formula for calculating the derivative characteristic of 0 degree direction, 90 degree direction and any α degree direction is:
[0062]
[0063] where K i It can be composed of the original image I and the convolution kernel w i Fast calculati...
Embodiment 2
[0100] see Figure 4 , a kind of infrared dim target detection system provided by the present invention, comprises: feature extraction module 110, calculates the Facet direction derivative feature of original image; Saliency value acquisition module 120, in the part of described Facet direction derivative feature map, along Calculating the relative range contrast saliency map according to the current direction; the image fusion module 130 fuses the relative range contrast saliency maps in each direction to obtain a saliency image; and the target extraction module 140 extracts the target of the saliency image .
[0101] The working mode of each module is described in detail below.
[0102] In some preferred embodiments, the feature extraction module 110 includes: based on the Facet model, an expression of a binary cubic polynomial f(r,c) is fitted to the gray intensity surface in the 5x5 neighborhood of the original image, the expression The formula is as follows, where r and...
PUM
Abstract
The invention provides an infrared weak and small target detection method and detection system. The infrared weak and small target detection method comprises the following steps: calculating Facet directional derivative characteristics of an original image; in the local of a Facet direction derivative characteristic pattern, calculating a relative range contrast saliency map along the current direction; fusing the relative range contrast saliency maps in each direction to obtain a saliency image; and extracting a target of the saliency image. According to the infrared weak and small target detection method and detection system, the model structure is simple; the calculation complexity is low; approximate calculation can be carried out based on a convolution kernel; the operation is very convenient; the signal-to-clutter ratio gain and the background suppression capability are very high; the correct detection probability of the weak target reaches 98% or above; and the real-time algorithm is good.
Description
technical field [0001] The invention relates to the technical field of image processing, in particular to a method and system for detecting small and weak infrared targets. Background technique [0002] With the development of infrared detection technology, infrared weak target detection technology in complex background is becoming more and more important in military and civilian fields. How to quickly and accurately find targets has become the key to early warning and tracking systems. However, due to the influence of factors such as no shape or edge information, low signal-to-noise ratio imaging, and complex backgrounds, the infrared weak and small targets greatly increase the difficulty of detection. [0003] At present, there are two main types of detection technologies for small infrared targets: image sequence-based detection and single-frame image-based detection. The detection theory based on image sequence is to estimate the target through the correlation in the se...
Claims
Application Information
Patent Timeline
Application Date:The date an application was filed.
Publication Date:The date a patent or application was officially published.
First Publication Date:The earliest publication date of a patent with the same application number.
Issue Date:Publication date of the patent grant document.
PCT Entry Date:The Entry date of PCT National Phase.
Estimated Expiry Date:The statutory expiry date of a patent right according to the Patent Law, and it is the longest term of protection that the patent right can achieve without the termination of the patent right due to other reasons(Term extension factor has been taken into account ).
Invalid Date:Actual expiry date is based on effective date or publication date of legal transaction data of invalid patent.
