Method for measuring solid particle residence time distribution in fluidized bed based on image recognition principle and test bed thereof

A technology of image recognition and residence time, applied in particle suspension analysis, acquisition/recognition of microscopic objects, measurement devices, etc. high efficiency effect

Active Publication Date: 2020-12-18
SOUTHEAST UNIV
View PDF5 Cites 4 Cited by
  • Summary
  • Abstract
  • Description
  • Claims
  • Application Information

AI Technical Summary

Problems solved by technology

[0019] In order to solve the problems of cumbersome and complicated operation, long time consumption and large error in the measurement of tracer particle concentration in the sampling method, the present invention proposes a method for measuring the residence time di

Method used


Image

  • Method for measuring solid particle residence time distribution in fluidized bed based on image recognition principle and test bed thereof
  • Method for measuring solid particle residence time distribution in fluidized bed based on image recognition principle and test bed thereof
  • Method for measuring solid particle residence time distribution in fluidized bed based on image recognition principle and test bed thereof

Examples


Embodiment 1

[0080]The method of the present invention for measuring the residence time distribution of solid particles in a fluidized bed based on the principle of image recognition includes the following steps:

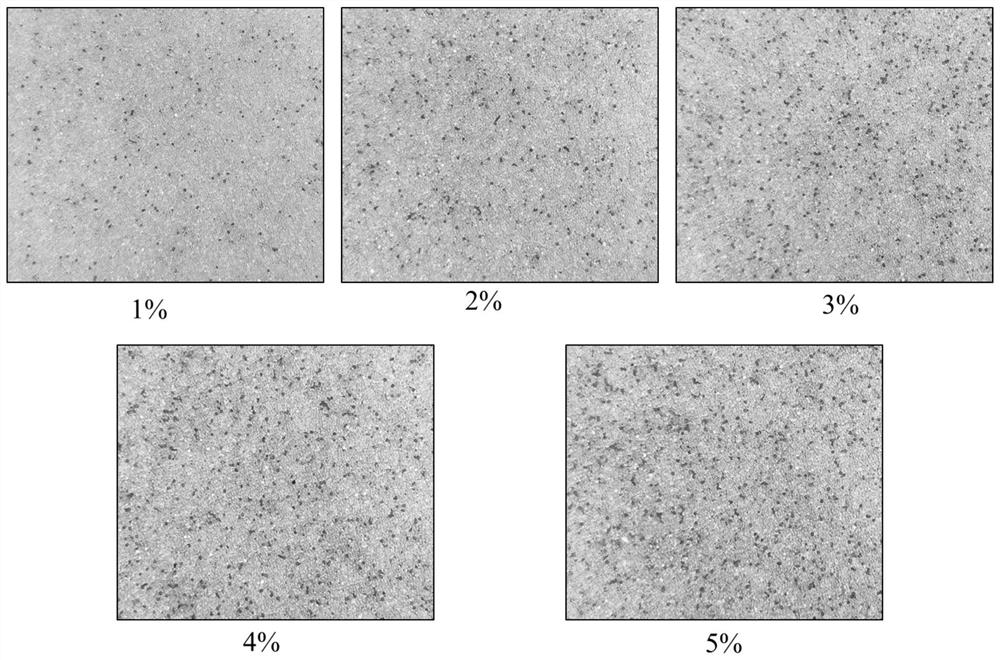
[0081]Step 1: Use translucent glass beads with a diameter of 0.3-0.35 mm as the solid bed material, and dye the glass beads red with carmine reagent as the tracer particles. Since the added amount of tracer particles is generally within 5% of the output volume, only samples with tracer particle concentrations of 1%, 2%, 3% to 5% need to be prepared. Prepare three sets of samples, fully stir all the samples and take pictures under the same light source conditions, and import the pictures into the computer. The original picture of the first set of tracer particle samples with different concentrations is as followsfigure 1 Shown.

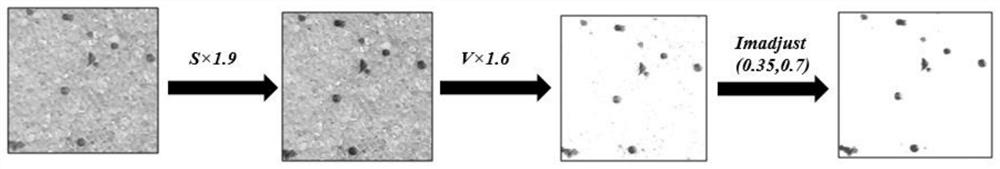
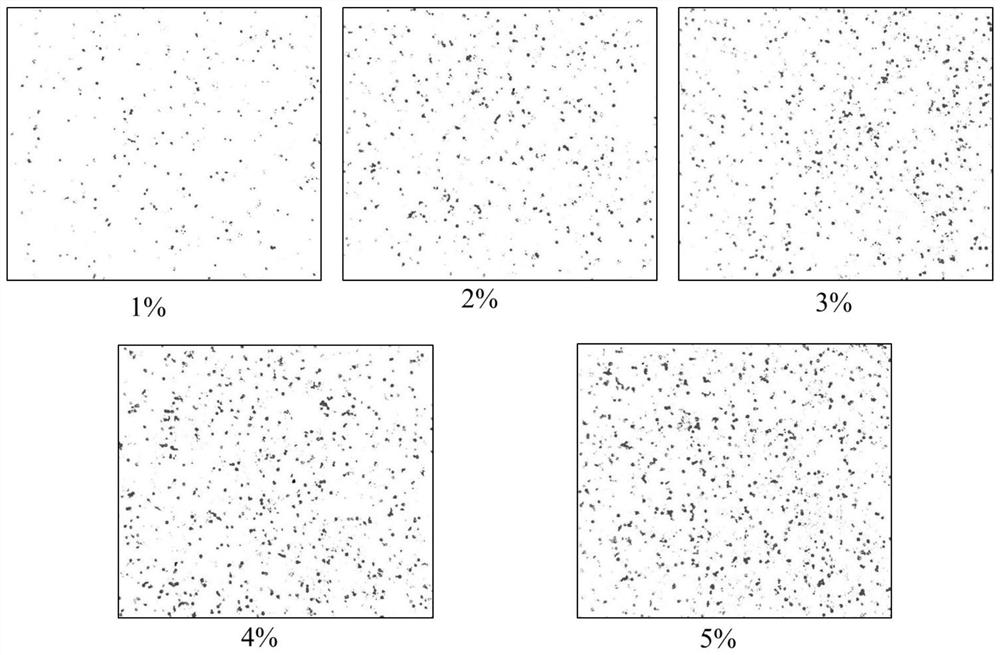
[0082]Step 2: Write a program in MATLAB to process the image taken in step 1. In the HSV color space, the S value of the image is magnified by 1.9 and the V value i...

Embodiment 2

[0091]Step 1: Design and build a test bench, the design drawing of the test bench is as shown inFigure 5 , The dimensions of the test bench are shown in Table 2.

[0092] Bed height Bed length Bed width Number of baffles 0.9m0.22m0.11m2 Baffle length Number of hood openings Number of wind hood Hole diameter of hood 0.9m6120.002m

[0093]Table 2

[0094]Such asFigure 5 As shown, the test bench includes a fluidized bed, a tracer particle silo, a material silo, a screw feeder, a bag filter, a sampler, a gas supply system, and an oil-water separator; the fluidized bed is respectively provided with inlet Feed port and sampling port; the sample output pipeline of the tracer particle silo is combined with the sample output pipeline of the material silo to communicate with the feed port of the fluidized bed, and the sample output pipeline of the tracer particle silo is installed The particle control valve, the sampling pipeline of the material silo is connected with the power output end of the...


PUM

PropertyMeasurementUnit
Diameteraaaaaaaaaa
The average particle sizeaaaaaaaaaa
True densityaaaaaaaaaa

Abstract

The invention provides a method for measuring solid particle residence time distribution in a fluidized bed based on an image recognition principle and a test bed thereof. Particles different from bedmaterial particles in color are adopted for tracing, the tracing particles are injected into a bed and then sampled at the discharging end regularly, and all samples are photographed under the same light source condition. By performing background elimination, color enhancement and gray scale adjustment processing on a sample image and identifying pixels representing tracer particles by means of RGB threshold segmentation, the concentration of the tracer particles in the image is calculated, and the particle retention time distribution in a fluidized bed can be calculated by combining the change rule of the concentration of the tracer particles with time. The particle residence time distribution measurement method is simple to operate, high in experiment efficiency, few in error generationlinks and high in accuracy.

Description

Technical field[0001]The invention belongs to the field of gas-solid fluidization, and particularly relates to a method for measuring the residence time distribution of solid particles in a fluidized bed based on the principle of image recognition.Background technique[0002]Due to the strong back mixing of solid particles in the gas-solid fluidized bed, the residence time of the solid materials in the fluidized bed is uneven. Some fluidized bed processes have very strict requirements on the average residence time and residence time distribution of solid materials in the fluidized bed. If the residence time is too short, the reaction conversion rate of the solid materials will be too low, and the residence time may be too long. Lead to deterioration of the physical and chemical properties of solid materials. Therefore, in the development of fluidized bed reactors, it is often necessary to measure the average residence time and residence time distribution of solid materials in the flui...

Claims


Application Information

Patent Timeline
IPC IPC(8): G01N15/06G06K9/00
CPCG01N15/06G01N2015/0693G06V20/693G06V20/695
Inventor 陈晓平李家敏马吉亮梁财刘道银
Owner SOUTHEAST UNIV
Why Eureka
Try Eureka