Information processing method and system for improving demand response effectiveness of power consumer
An information processing method and demand response technology, which is applied in the field of information processing to improve the effectiveness of power user demand response, can solve the problems of production management personnel being unable to judge, responding failure, hindering power users, etc., so as to avoid blind regulation and reduce negative impact , the effect of raising the will
- Summary
- Abstract
- Description
- Claims
- Application Information
AI Technical Summary
Problems solved by technology
Method used
Image

Examples
specific Embodiment
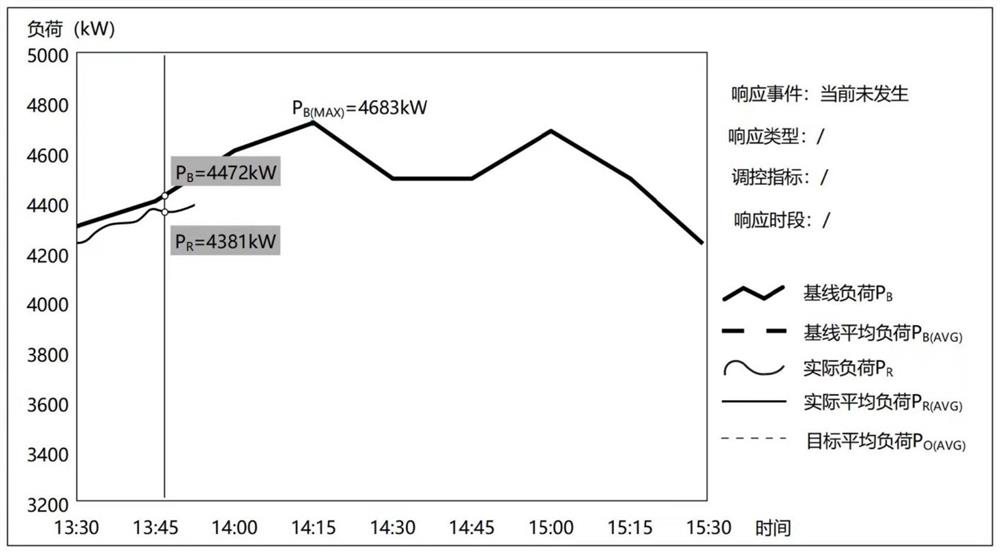
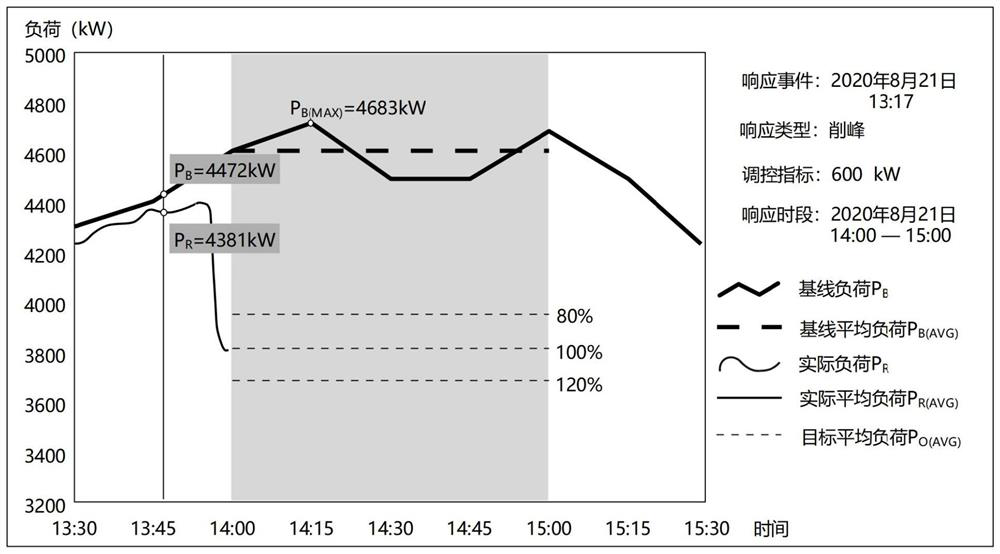
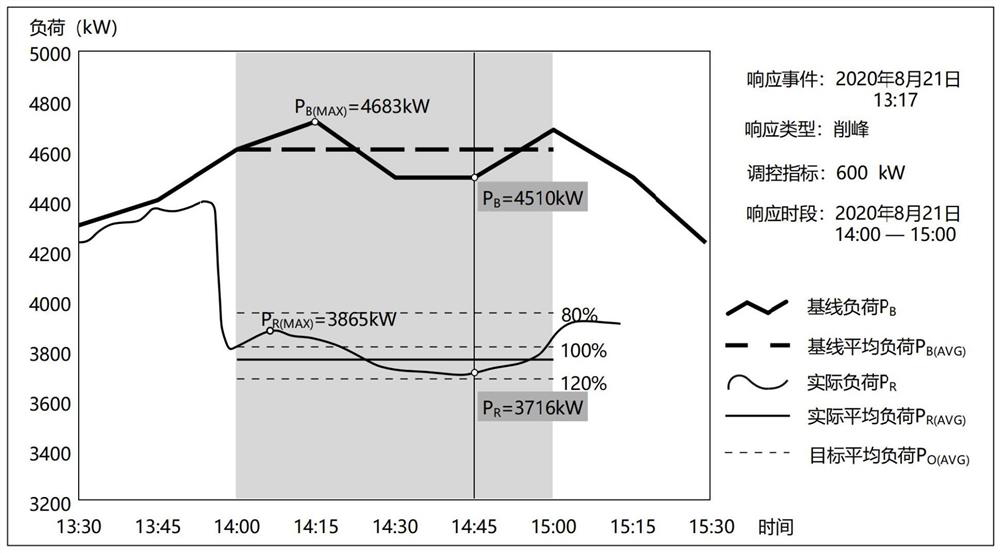
[0101] Install user interaction equipment in the office of the user's production manager, with a display screen, as an information window for users to understand the requirements of demand response indicators, load baseline data, and dynamic changes in the actual load of the enterprise.
[0102] The demand response terminal is connected to the meter reading equipment, and collects the load data of the gateway meter at high frequency through the infrared communication port of the meter or collects the load data of all branch circuits under the gateway meter through the field bus interface. The collected total operating load data of the enterprise is forwarded to the user interaction device to meet the needs of production managers to monitor the real-time load of the factory.
[0103] The demand response terminal downloads the user's load baseline data through the demand-side real-time management system platform when the system is idle (that is, during the non-demand response per...
PUM
 Abstract
Description
Claims
Application Information