Non-invasive optical measurement of blood constituent

An optical measurement, blood technology, applied in blood characterization devices, diagnostic recording/measurement, medical science, etc., can solve problems such as indistinguishability, and achieve the effect of high signal-to-noise ratio

Inactive Publication Date: 2001-10-03
ORSENSE LTD
View PDF3 Cites 10 Cited by
  • Summary
  • Abstract
  • Description
  • Claims
  • Application Information

AI Technical Summary

Problems solved by technology

However, if such artificially induced pulses cause uncontrollable changes in the optical properties of the tissue, thes

Method used


Image

  • Non-invasive optical measurement of blood constituent
  • Non-invasive optical measurement of blood constituent
  • Non-invasive optical measurement of blood constituent

Examples


example 1

[0085] measured during real transmission at two wavelengths for L 1 =760nm and L 2 =940nm for about 85 seconds. For this purpose, commonly used LEDs with radiation picks at 940 nm and 760 nm are used.

[0086] The entire measurement process consists of a single four-second standard pulse measurement interval and seven consecutive OR time periods. The logarithm of transmission can be obtained as a function of time. The transmission logarithm is shown in the Figure 4A , the figure shows the corresponding wavelength L respectively 1 and L 2 The two curves P 1 and P 2 .

[0087] Such as Figure 4B As shown, in the next stage, the wavelength L 2 The transmission logarithm [that is, Log(L 2 )] with a wavelength of L 1 The transmission logarithm [that is, Log(L 1 )] parameter slope PS. In other words, the curve PS is Log(L 2 ) to Log(L 1 ) linear function. In order to determine this linear function, the known linear regression operation can be used, for example.

...

example 2

[0099]All human blood is pumped into clear glass tubes with rigid glass walls using a peristaltic pump. Immediately after the blood flow phase, the effect of light transmission at different wavelengths starts to vary. Figure 5A are shown respectively corresponding to the wavelength L 1 =660nm, L 2 =950nm and L 3 =Three curves H at 1300nm 1 ,H 2 and H 3 . After blood flow resumes, the transmission value returns to its initial level.

[0100] It should be noted that if the walls of the glass tube are flexible, which in fact presents a volume-changing mode, the transmission level will gradually decrease at all wavelengths mentioned above. However, avoiding volume changes can lead to very exotic transmission properties, where the light transmission curve changes variously over time at different wavelengths.

example 3

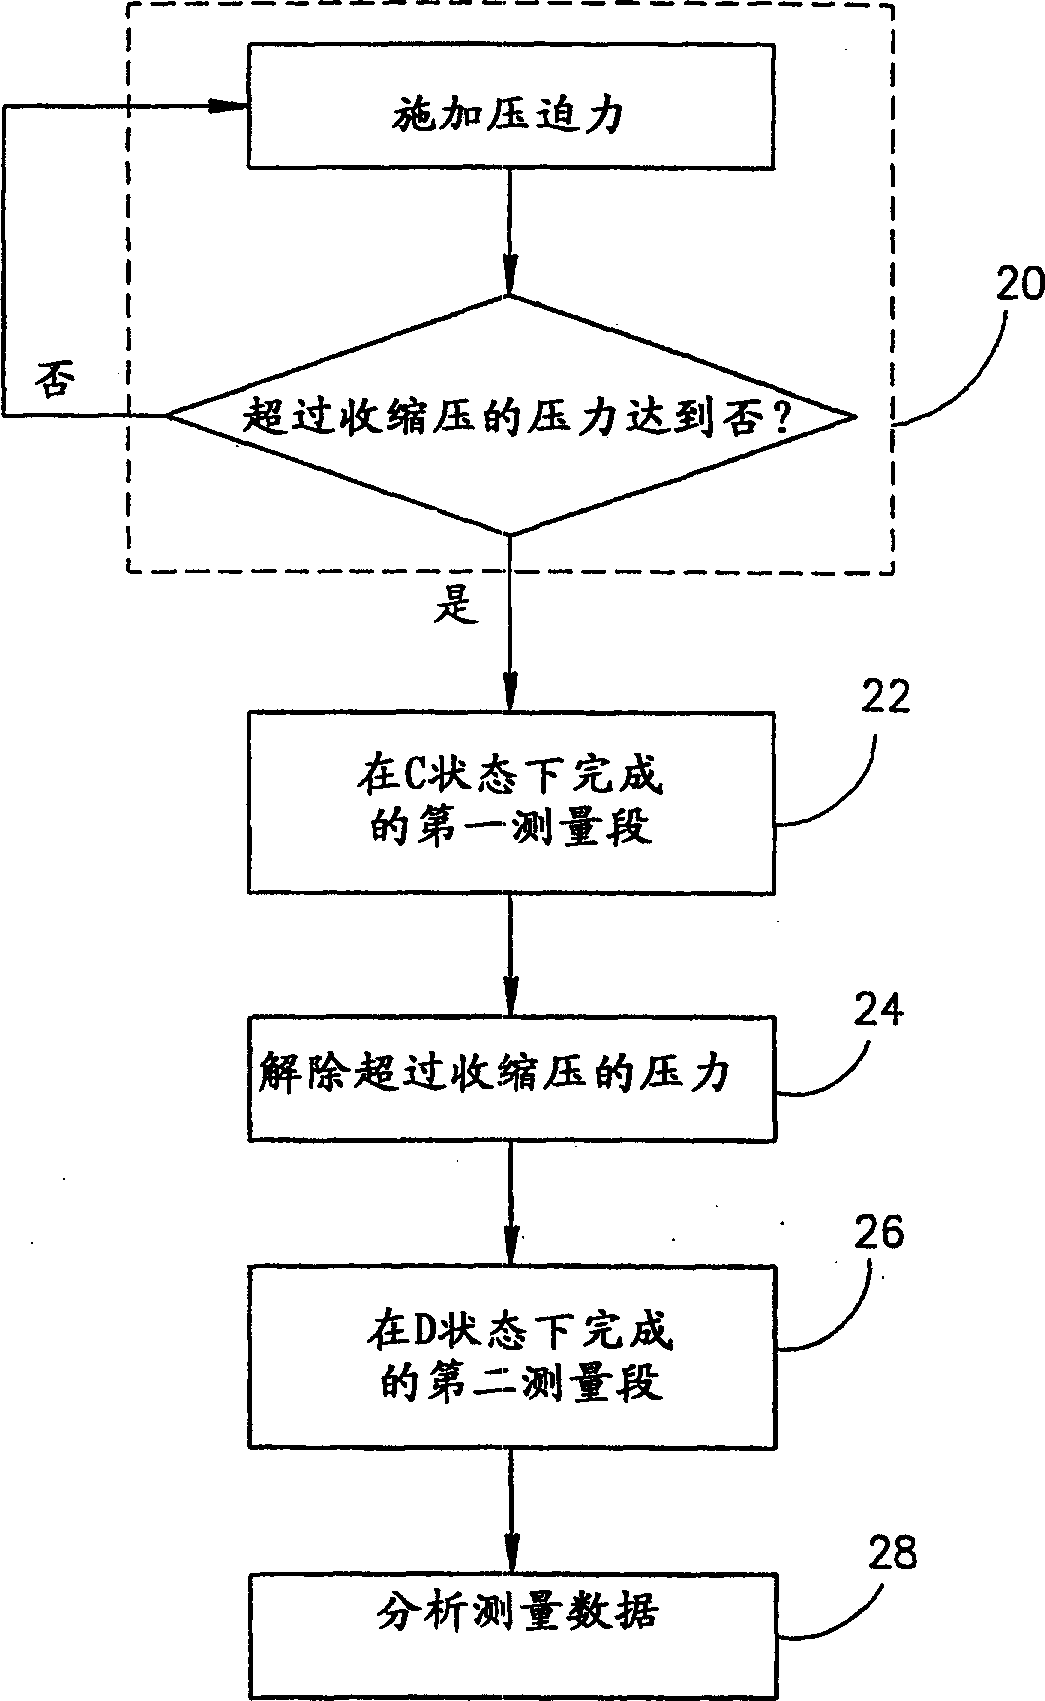
[0102] To stop blood flow, pressure in excess of systolic blood pressure is applied to the patient's upper extremity. Observe the transport performance model similar to the previously described in vitro experiments. Figure 5B are shown respectively corresponding to the wavelength L 1 =660nm, L 2 =950nm and L 3 =1300nm three curves H' 1 ,H' 2 and H' 3 .

[0103] The time constants of transmission variation at different wavelengths have been found to closely resemble these trends. It was also found that the results were independent of the location of the compression, and whether the location of the compression was on the upper part of the fingers, the wrist or the upper extremity.

[0104] Like this, the advantage of the present invention is self-evident. Indeed, all of the above experiments have shown that the application of pressures in excess of the systolic pressure triggers non-volumetric mechanisms within the blood. This mechanism results in continuous and gradua...


PUM


Abstract

An over-systolic pressure is applied to a patient's blood perfused fleshy medium. The pressure causes a state of temporary blood flow cessation within a time period insufficient for irreversible changes in the fleshy medium. Release of the over systolic pressure causes a state of transitional blood flow terminating with the normal blood flow. At least two sessions of measurement, separated in time, are executed and at least one of these sessions is selected within the time period including the state of temporary blood flow cessation and the state of transitional blood flow. Optical non-invasive measurement of the concentration of at least one blood constituent are successively performed at these at least two sessions, and respective values of the concentration are obtained.

Description

field of invention [0001] The invention belongs to the technical field of non-invasive optical measurement and relates to a method for determining the concentration of a substance, such as glucose, hemoglobin, drug or cholesterol, in a patient's blood. Background of the invention [0002] Optical methods of determining the chemical composition of blood, including spectrophotometric measurements capable of indicating the presence of various blood components, are based on the known spectral properties of these components. These spectrophotometric measurements can be performed in vitro or in vivo. In vitro measurements are invasive, requiring blood samples to be drawn from the body and investigated. These measurements are now becoming less popular due to the increased noxiousness of injections. [0003] In vivo non-invasive optical measurements can be roughly divided into two large groups according to different methodological concepts. The first group is called "DC measureme...

Claims


Application Information

Patent Timeline
IPC IPC(8): A61B5/00A61B5/145A61B5/1455
CPCA61B5/6824A61B5/14551A61B5/6826A61B5/6838
Inventor 伊利亚·非尼
Owner ORSENSE LTD
Why Eureka
Try Eureka