Optical analyzer and method for measuring spectral amplitude and phase of input optical signals using heterodyne architecture

an analyzer and optical signal technology, applied in the field of optical analyzers, can solve the problems of increasing the cost of optical analyzers, inherently limited resolution of optical gratings, and generally expensive optical gratings

Inactive Publication Date: 2005-01-20
AGILENT TECH INC
View PDF5 Cites 21 Cited by
  • Summary
  • Abstract
  • Description
  • Claims
  • Application Information

AI Technical Summary

Benefits of technology

The optical analyzer and method in accordance with the invention measures spectral amplitude and spectral phase. The spectral phase is determined from the spectral phase differences between adjacent spectral peaks of the input optical signal by using the inner spectral peaks. These measurements allow reconstruction of optical signals in the time domain by

Problems solved by technology

A concern with these optical analyzers is that the resolution of an optical grating is inherently limited and is directly dependent

Method used


Image

  • Optical analyzer and method for measuring spectral amplitude and phase of input optical signals using heterodyne architecture
  • Optical analyzer and method for measuring spectral amplitude and phase of input optical signals using heterodyne architecture
  • Optical analyzer and method for measuring spectral amplitude and phase of input optical signals using heterodyne architecture

Examples


first embodiment

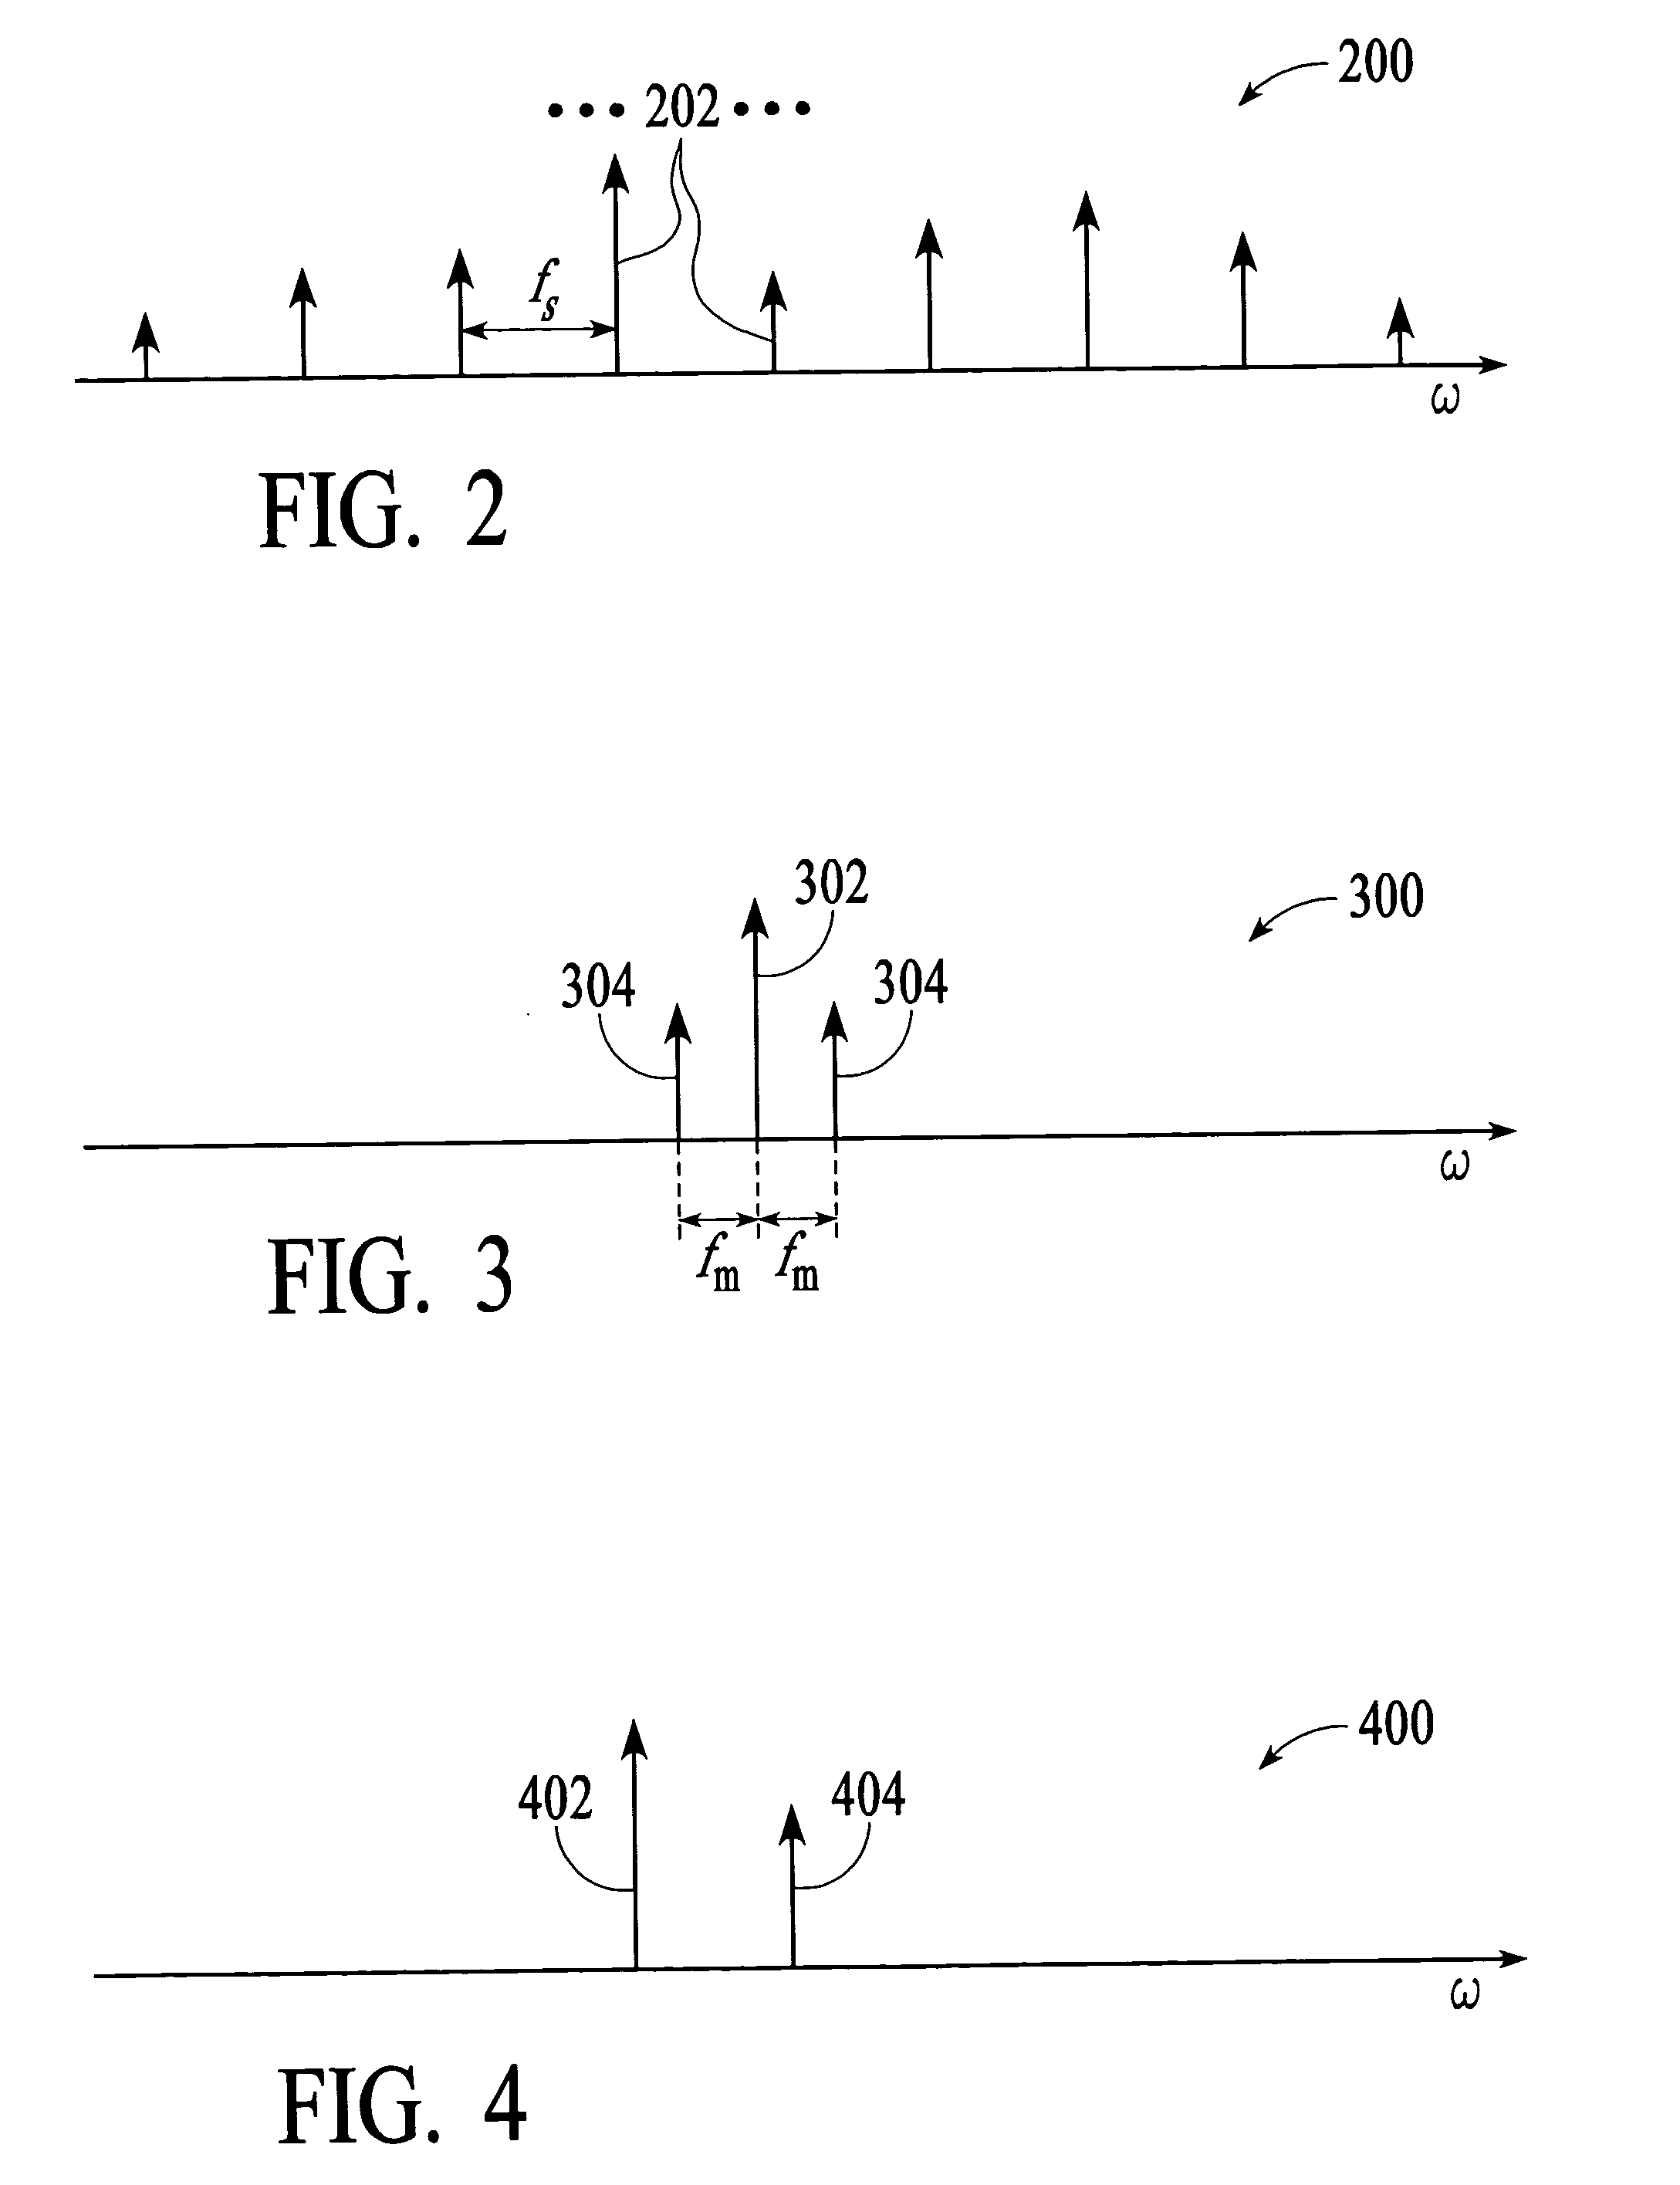
In the invention, the equation (10) is solved using discrete phase shifts ±Δψ of the LO modulation signal. In this embodiment, the LO signal is phase modulated such that fm=fs / 2. First, the size of the inner peak is measured for an arbitrary reference phase ψ=ψr, and, then, for two other phases φ+,−=ψr±Δψ. Thus, three measurements are made to compute the phase difference Δφ. The phase shifts ±Δψ are introduced by the modulation controller 120, as described further below. Since the actual value of ψr does not matter (a delay property of the Fourier transform), it is assumed that ψr=0. From the equation (10), the following equations are obtained.

b−2=a12+a22+2a1a2 cos(Δφ+2Δψ)   (11a)

br2=a12+a22+2a1a2 cos(Δφ)   (11b)

b+2=a12+a22+2a1a2 cos(Δφ−2Δψ)   (11c)

By subtracting the equation (11b) from the equations (11a) and (11c), and performing some trigonometric simplifications, the solution for tan Δφ is: tan⁢ ⁢Δ⁢ ⁢φ=b+2-b-22⁢br2-b+2-b-2·tan⁢ ⁢Δψ(12)

The term tan Δψ from the equation (12)...

second embodiment

In the invention, the phase difference Δφ is measured by comparing the phase of the oscillatory behavior of the inner peaks to the phase of the reference signal at the electrical frequency fr=δf. A graphical explanation of this phase difference measurement is now described. Assume that the peaks 506 in FIG. 5C are not at the same frequency but that there is a frequency difference between the peaks equal to δf. This means that the phase modulation frequency is not equal to fs / 2 but to fs / 2+δf / 2 or to fs / 2δf / 2. Then, using the concept of FIG. 6, the phasor {overscore (a)}2 will rotate around the phasor {overscore (a)}1, as shown in FIG. 9A. Therefore, the amplitude of the resulting inner peak, which is proportional to b, will oscillate at the frequency δf, as shown in FIG. 9B. The oscillatory behavior of b(t) can then be defined by the following equation:

b(t)2=A+B cos(2πδft+Δψ),   (13)

where A and B are some constants. The phase of the oscillating b(t)2 from the equation (13), as com...

third embodiment

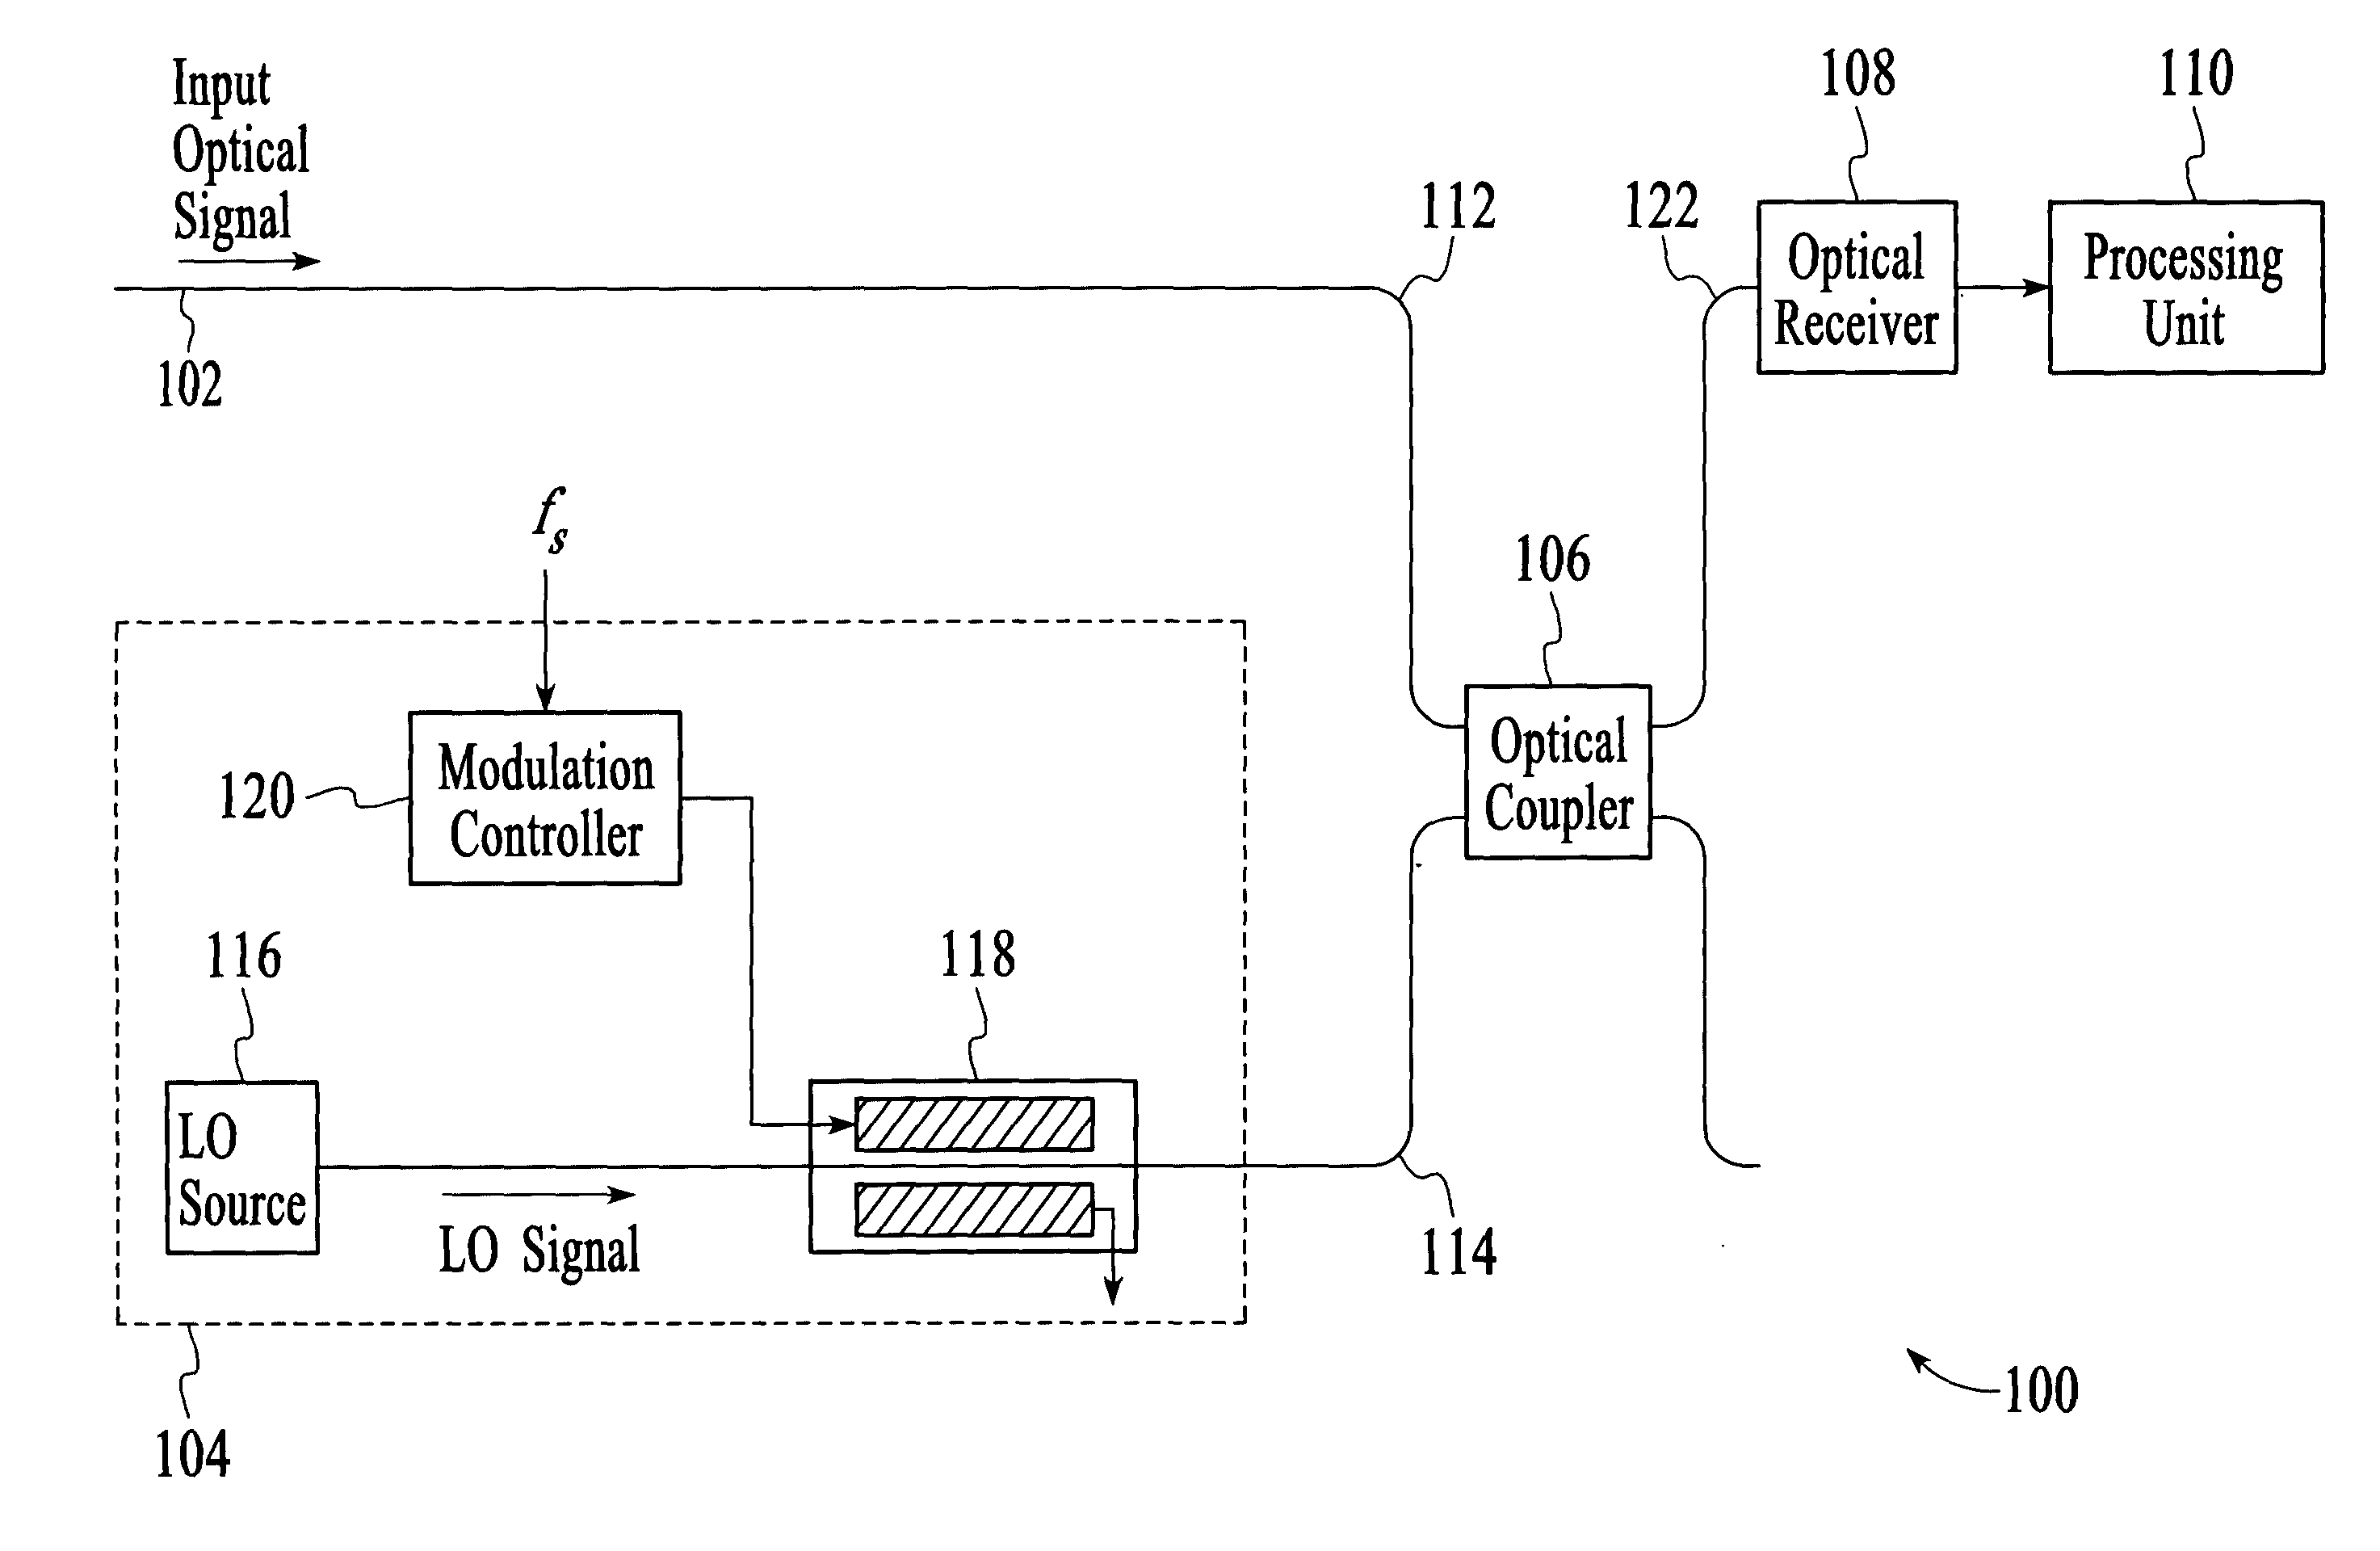
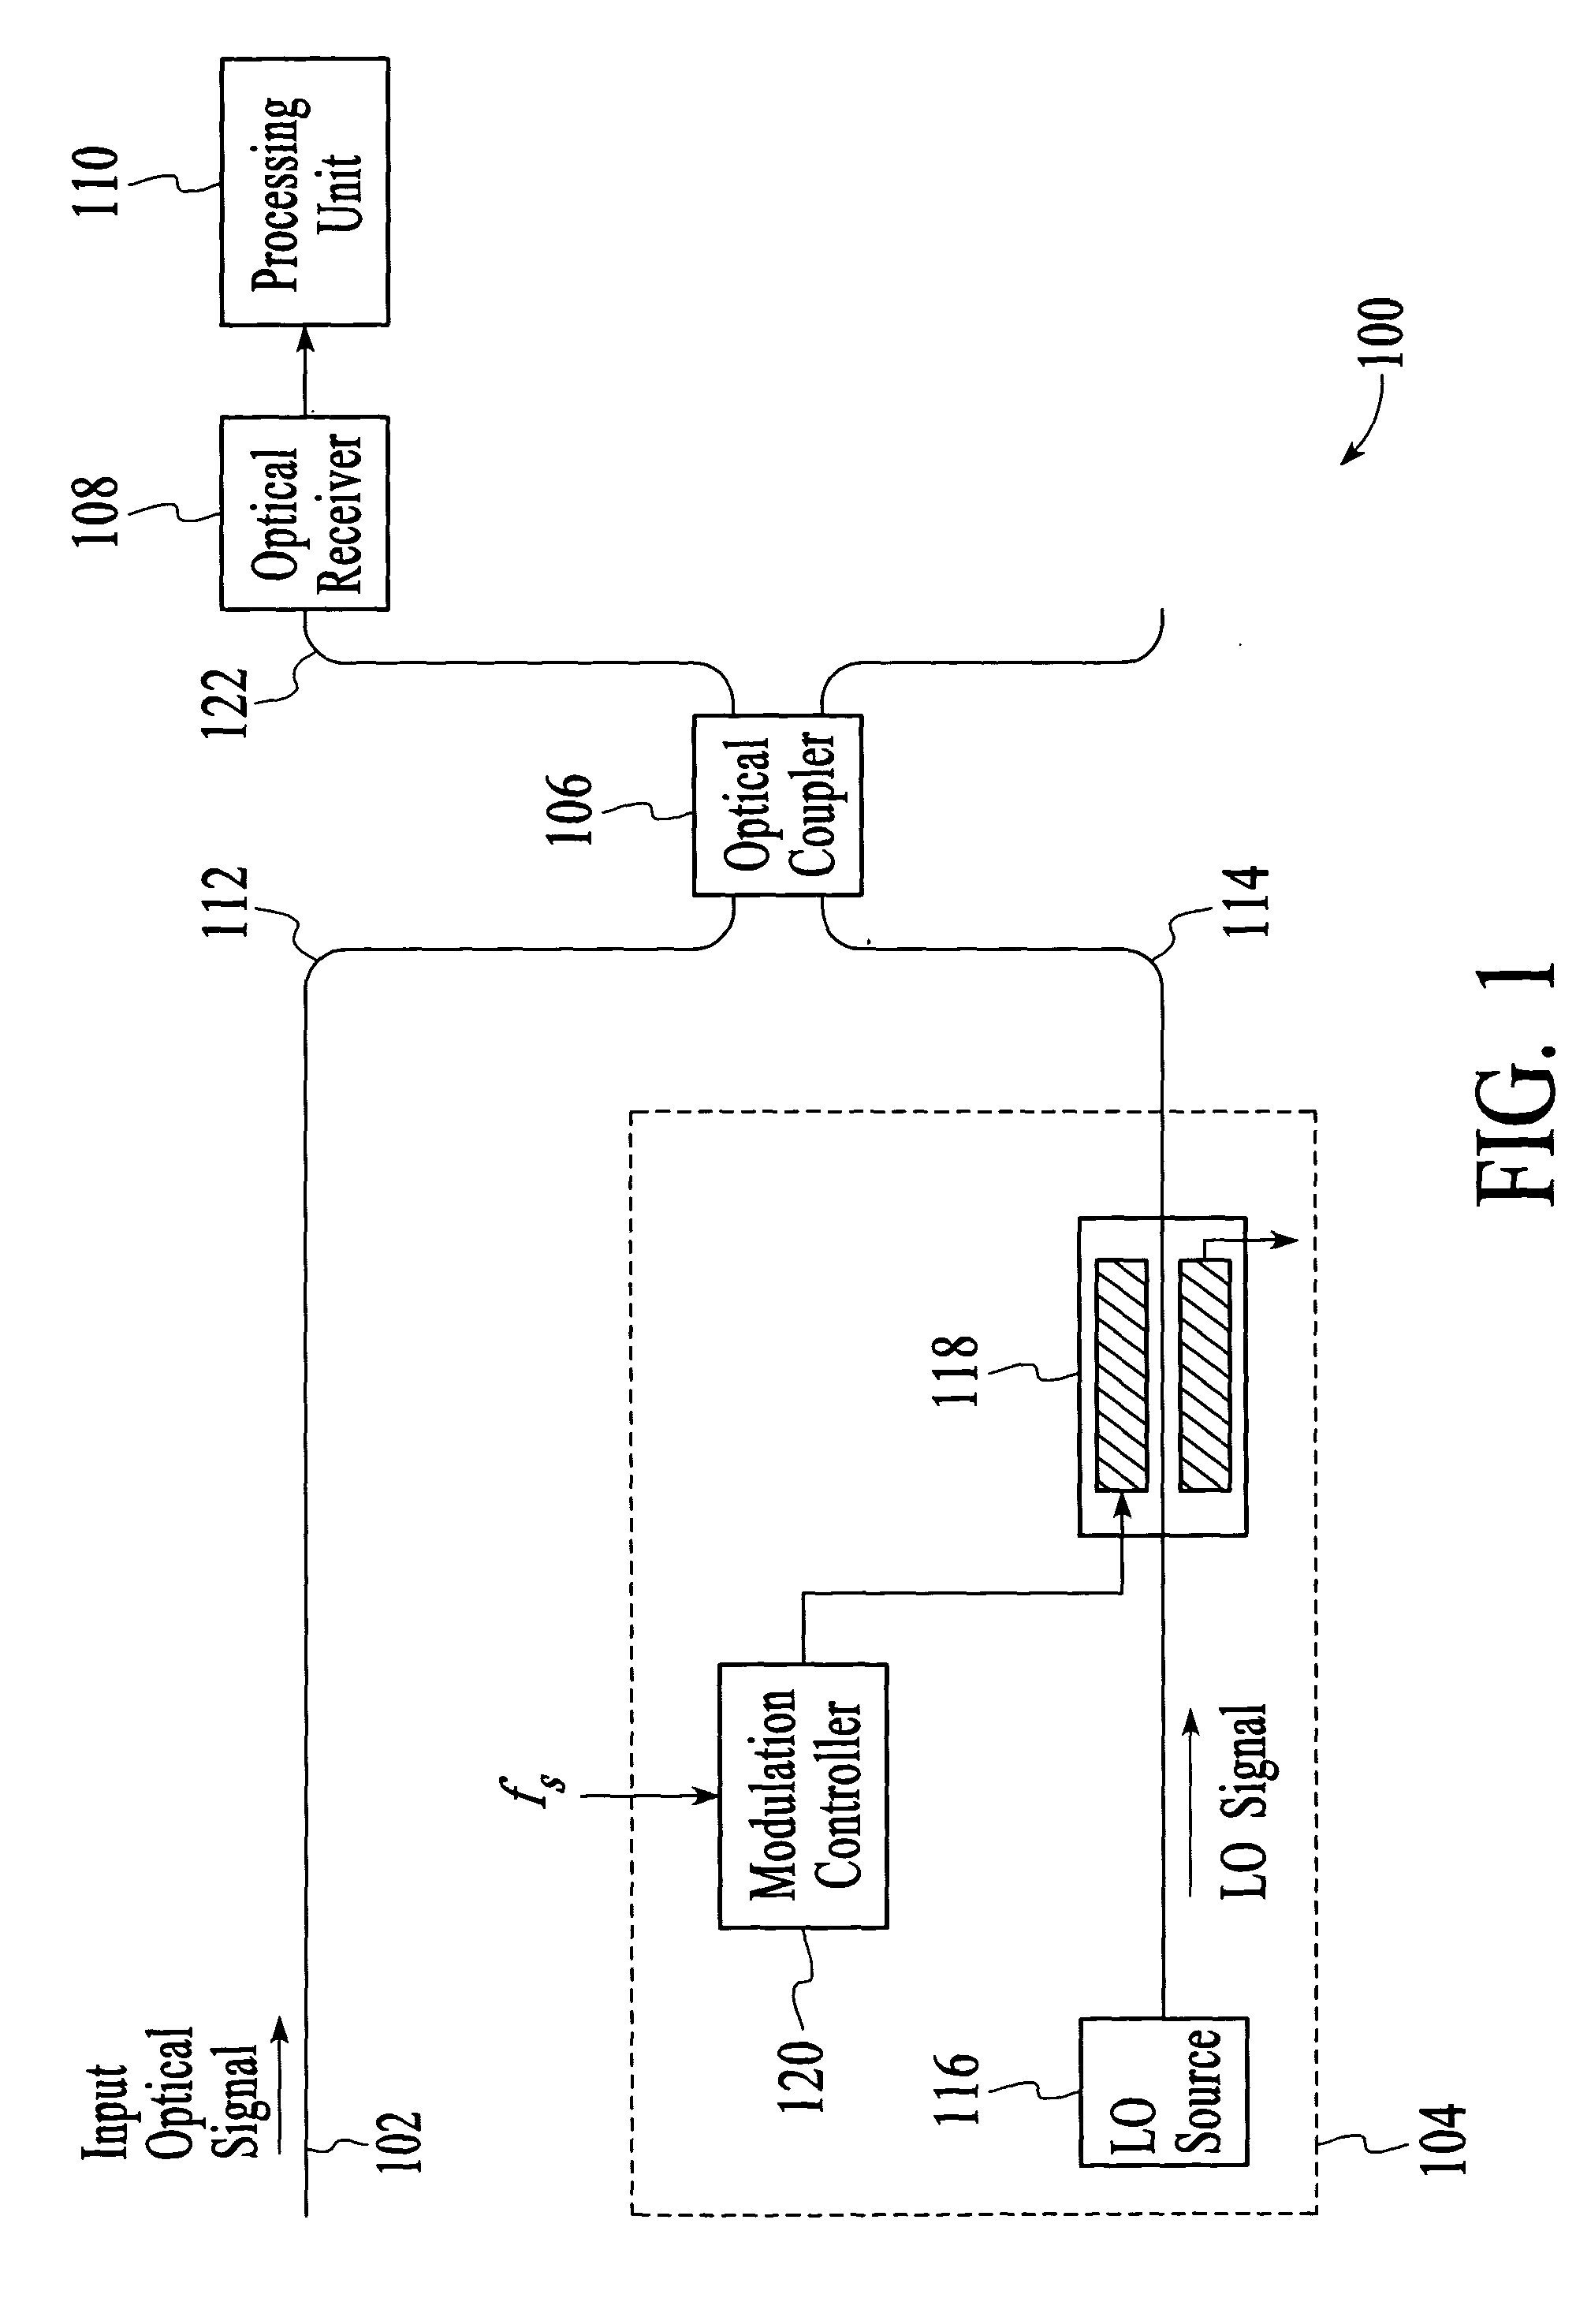
Turning now to FIGS. 14A and 14B, the components of the modulation controller 120 and the processing unit 110 of the HOSA system 100 in accordance with the invention is shown. In this embodiment, the modulation controller 120 includes a modulation signal generator 1402 and an electrical frequency modulator 1404, as shown in FIG. 14A. The modulation signal generator 1402 provides a modulation signal at the electrical frequency fs. The electrical frequency fs may be supplied from an external source. The modulation signal at the electrical frequency fs is then phase modulated by the electrical frequency modulator 1404 at the electrical frequency fψ and supplied to the optical modulator 118.

As shown in FIG. 14B, the processing unit 110 includes a preamplifier 1406, an AM demodulator 1408, a power converter 1410, phase sensitive detectors 1412 and 1414 and a processor 1416. The preamplifier 1406 amplifies the electrical signal generated by the optical receiver 108, i.e., the heterodyne ...


PUM


Abstract

An optical analyzer and method for measuring optical properties of optical signals utilizes a heterodyne architecture to measure spectral amplitude and phase of a periodically modulated input optical signal, such as an optical signal from a periodically modulated distributed feedback (DFB) laser. The spectral amplitude and phase measurements are derived from a heterodyne signal, which is produced by combining and mixing the input optical signal and a local oscillator (LO) signal. The optical spectrum that is reconstructed from the heterodyne signal includes “inner” spectral peaks that contain phase information of the input optical signal. The inner spectral peaks may be produced by an optical or electrical mixing technique. The spectral phase of the input optical signal is recovered from the inner spectral peaks of the reconstructed optical spectrum.

Description

FIELD OF THE INVENTION The invention relates generally to optical analyzers, and more particularly to an optical analyzer and method for measuring spectral amplitude and phase of input optical signals. BACKGROUND OF THE INVENTION Spectral amplitude and phase measurements of optical signals are often desired to characterize the signals in the time domain. These spectral measurements allow time varying optical characteristics of the optical signals to be studied by means of the Fourier transform. An example of a time varying optical characteristic is a chirp of a modulated laser, i.e., variations of the laser optical frequency with intentionally induced intensity modulation. In addition, the spectral phase measurements can be used to learn about dispersive properties of an optical fiber or other optical materials or components. Various optical analyzers have been developed to measure the amplitude and phase of optical signals. Some optical analyzers for measuring the phase of optic...

Claims


Application Information

Patent Timeline
IPC IPC(8): G01J9/00G01J9/04H04B10/02H04B10/08
CPCH04B10/0795G01J9/04
Inventor SZAFRANIEC, BOGDAN
Owner AGILENT TECH INC
Why Eureka
Try Eureka