
Spectroscopy instrument using broadband modulation and statistical estimation techniques to account for component artifacts

Inactive Publication Date: 2005-04-21
UNIVERSITY OF MAINE +2
View PDF21 Cites 13 Cited by
  • Summary
  • Abstract
  • Description
  • Claims
  • Application Information

AI Technical Summary

Benefits of technology

[0013] Compared to the standard cross correlation method, i) the resolution is improved relative to the nominal time base resolution of the PRBS or other modulating sequence; ii) the Poisson (pulse counting) noise is accounted for; and iii) artifacts associated with imperfections of the chopper or other component performance are reduced.

Problems solved by technology

Despite dramatic advances in the energy resolution and throughput of electron monochromators for high resolution electron energy loss spectroscopy (HREELS), a major limitation of conventional, dispersive sector, electron energy analyzers is that they are inherently serial devices, leading to long data acquisition times. The advantage of higher resolution leads to trade-offs in performance (throughput) because channel step size must be reduced, and therefore increasing the number of channels required to measure a given spectral region.
However, parallel detection can be accomplished in this way only over a limited spectral range without degrading resolution.
Second, most modulators do not act in exactly the same manner on different particles in the beam; for example, the finite thickness of spinning disks leads to a velocity dependent modulation function in molecular beam scattering applications.
In practice, the presence of noise in measured data complicates deconvolution of spectral data in the simplest cases when the instrument function can be described by a single feature.

Method used


Image

  • Spectroscopy instrument using broadband modulation and statistical estimation techniques to account for component artifacts
  • Spectroscopy instrument using broadband modulation and statistical estimation techniques to account for component artifacts
  • Spectroscopy instrument using broadband modulation and statistical estimation techniques to account for component artifacts

Examples


Embodiment Construction

1. Using Statistical Estimation Techniques to Account for Component Artifacts in a Spectroscopy Instrument

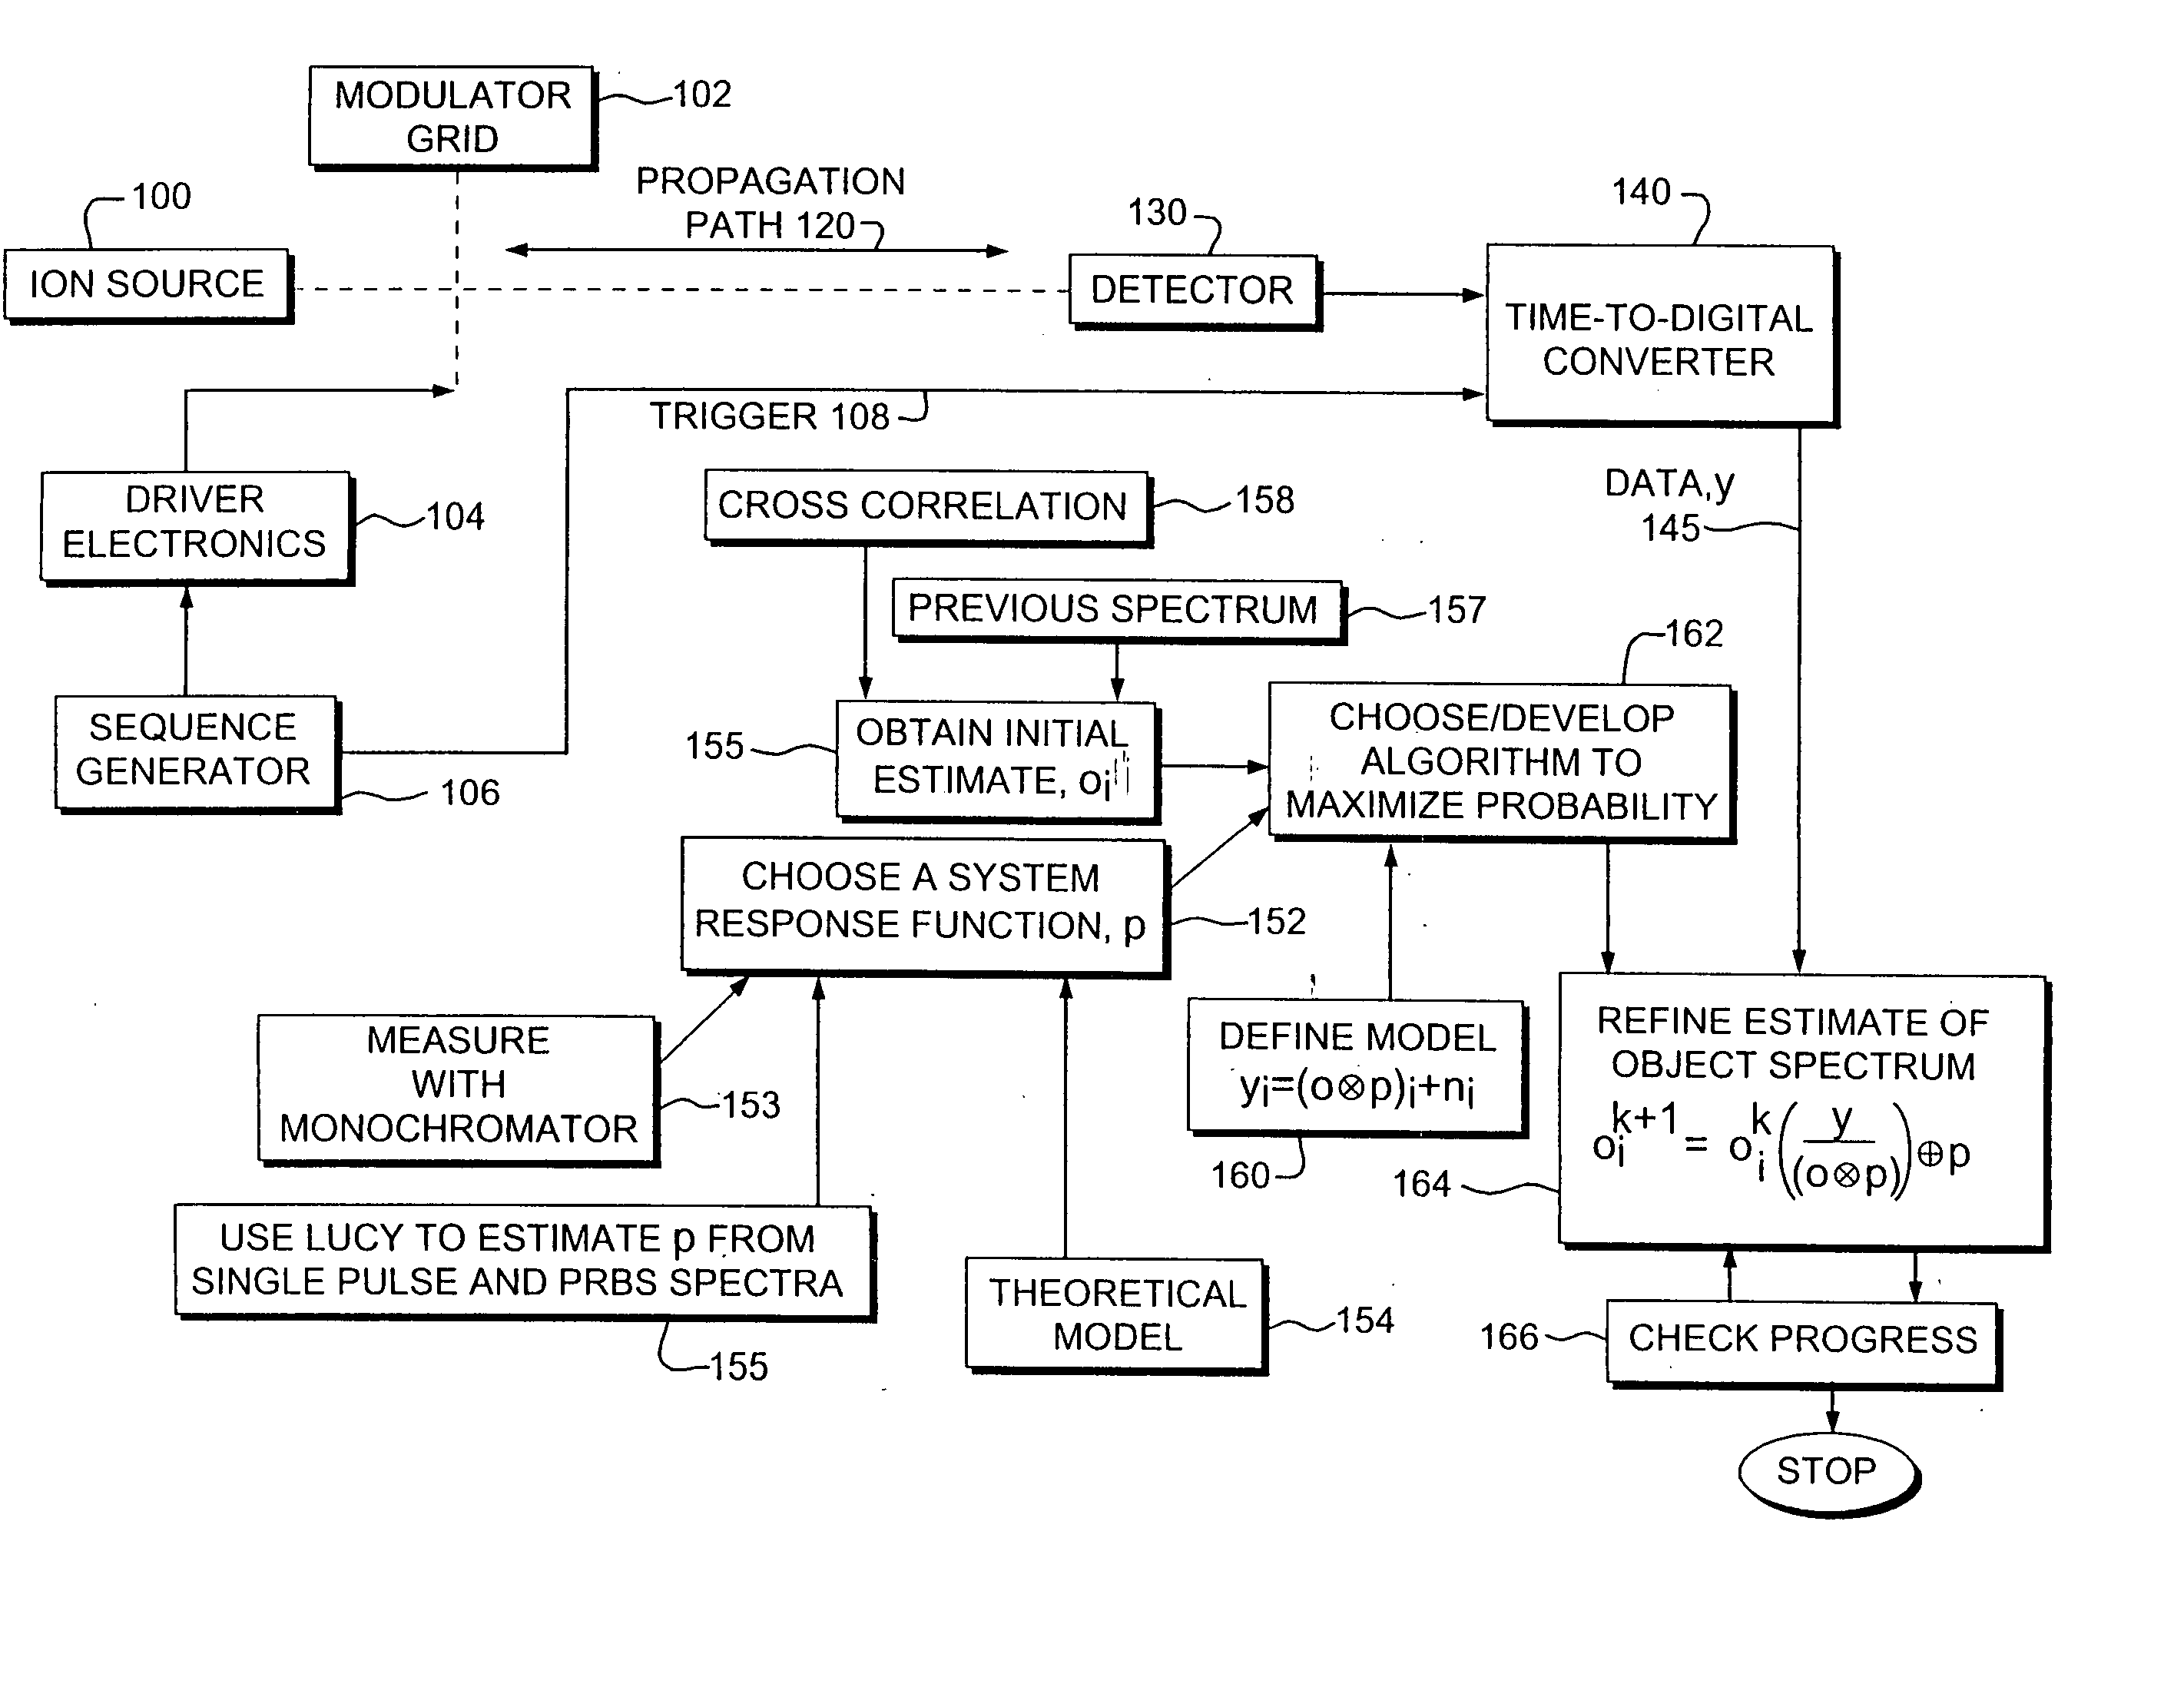
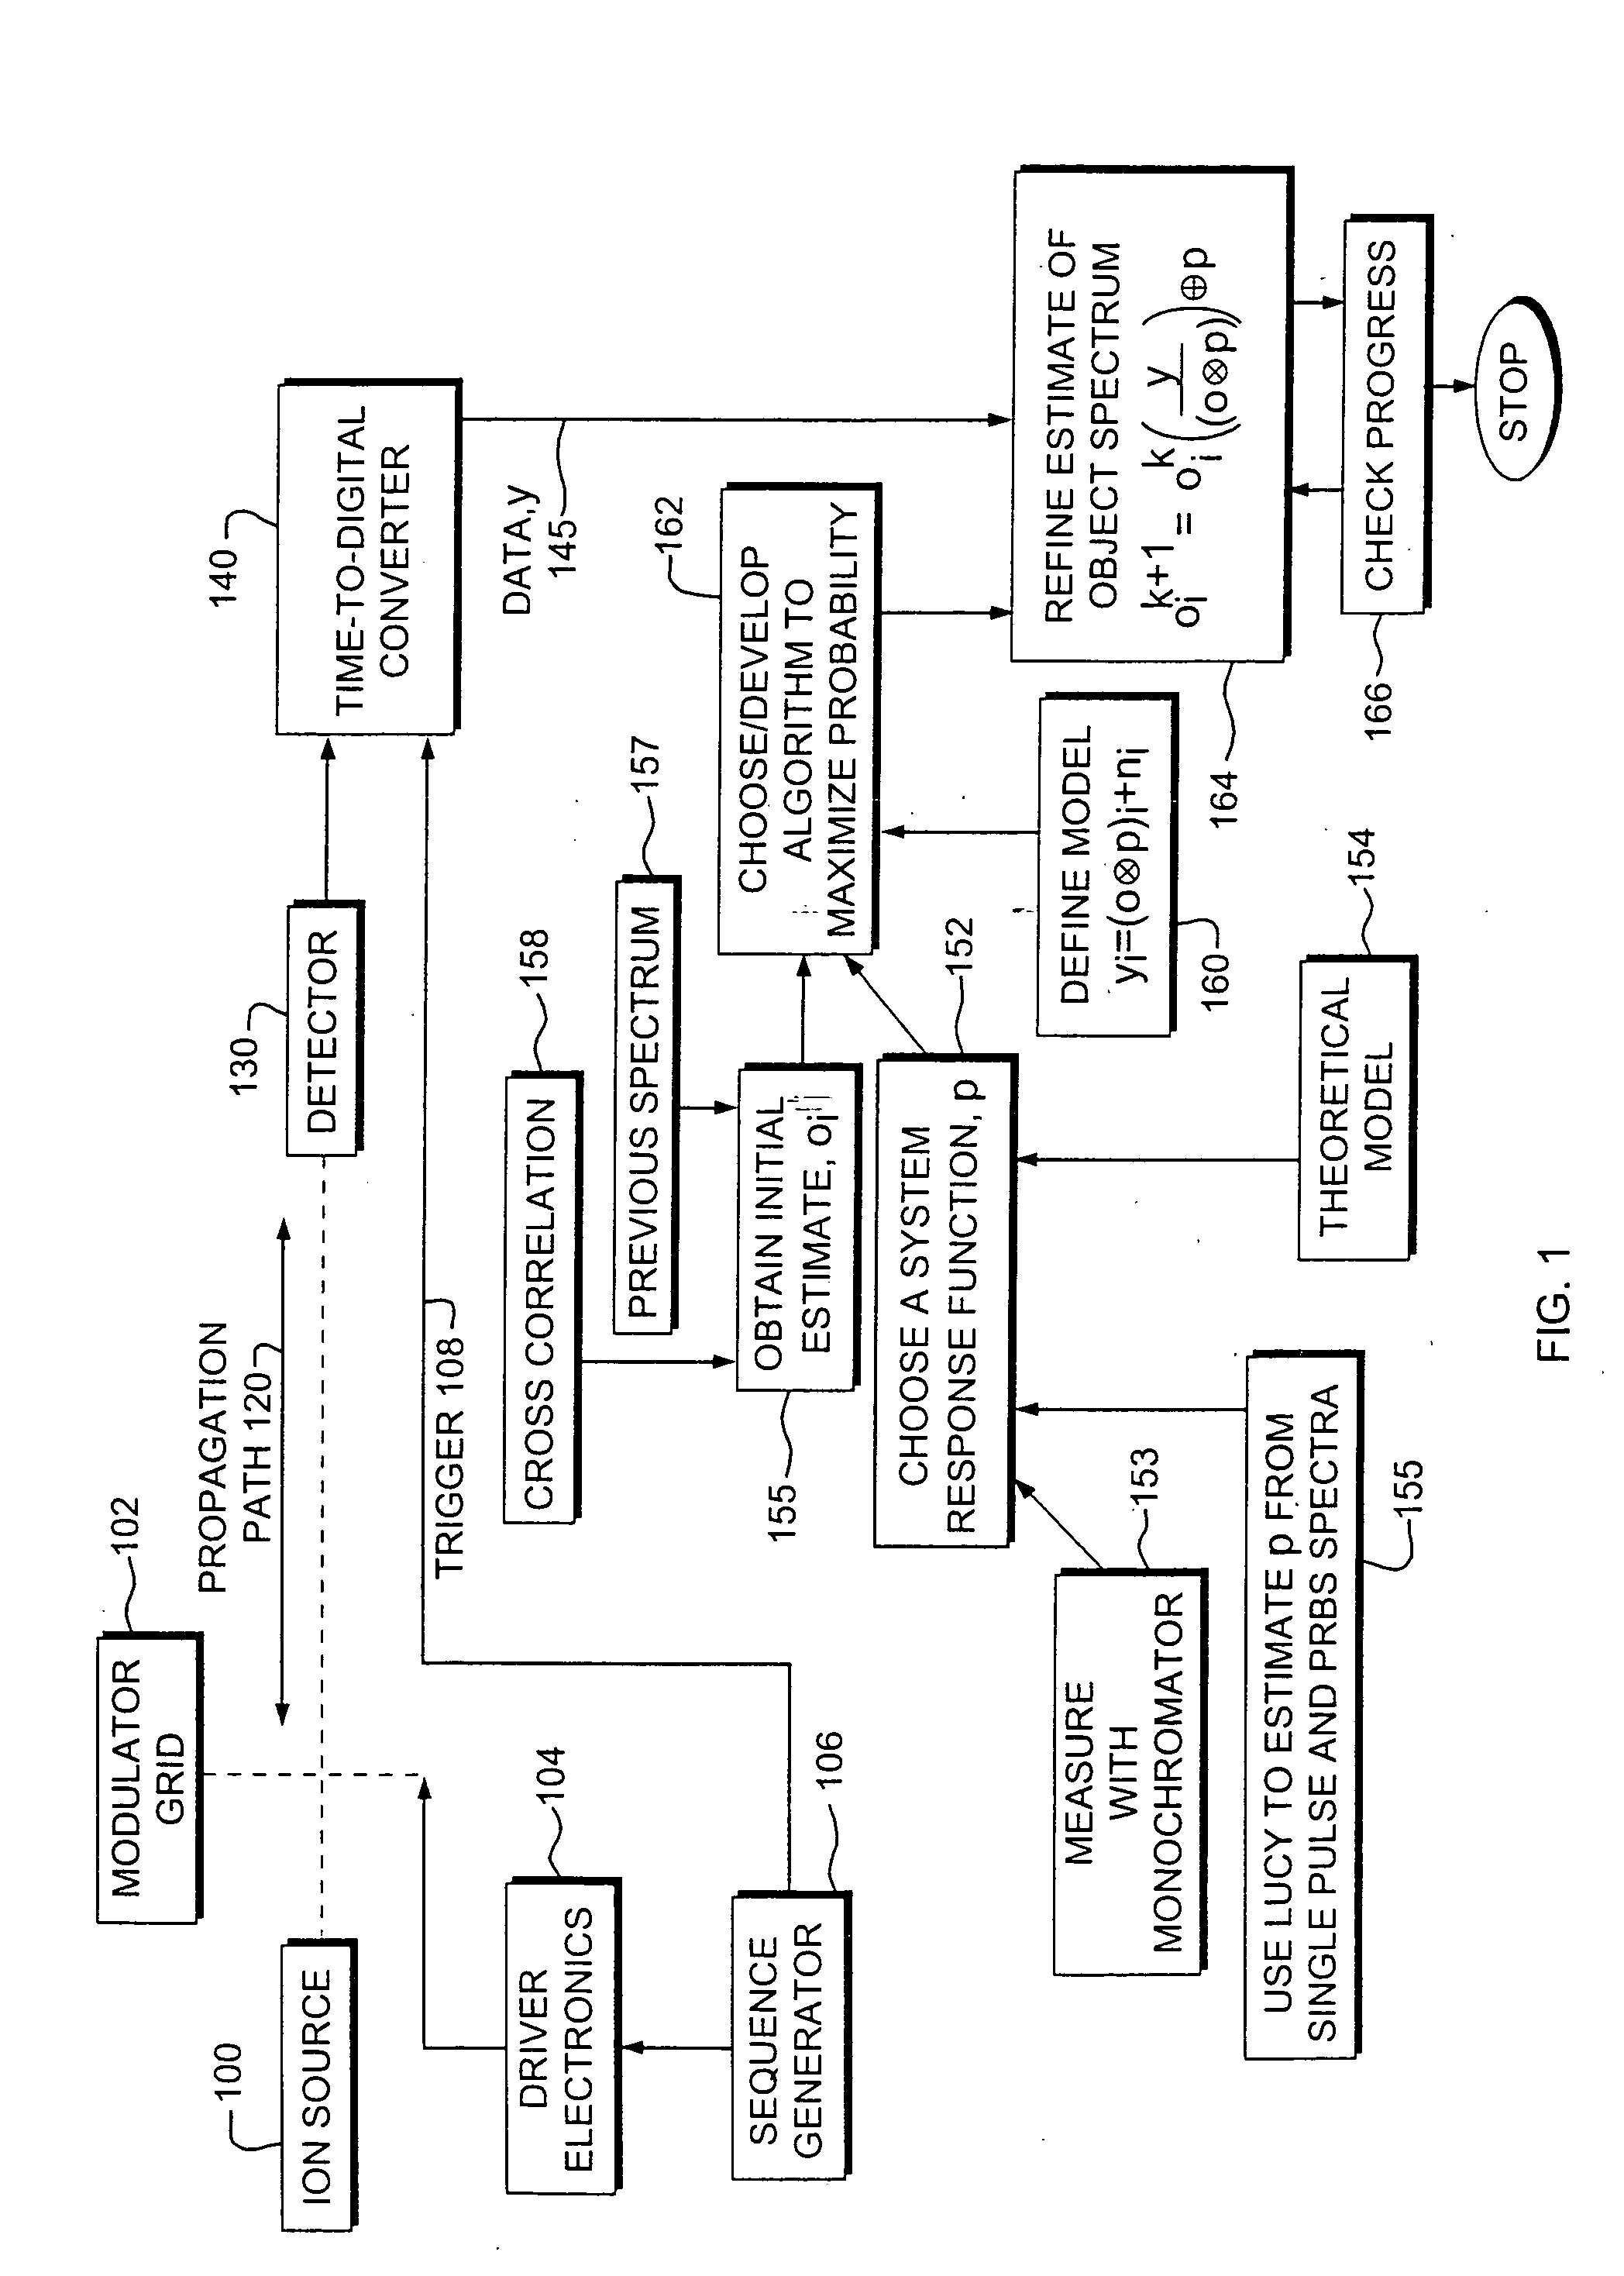
[0051]FIG. 1 is a block diagram of a spectroscopy instrument that makes use of statistical estimation techniques to account for component artifacts in accordance with the present invention. The instrument may use several different types of physical phenomena to determine the attributes of a sample. In general, a particle source such as ion source 100 provides a stream of particles to a propagation path 120. The spectrometer is a type of spectrometer that makes use of a modulator grid or “chopper”102, driver electronics 104, and sequence generator 106 to modulate the ion source 100. Alternatively, the ion source may be modulated directly either prior to or subsequent to its application to a sample in order to provide a particle beam that is modulated in time.

[0052] The modulator 102 may itself take different forms; one particularly useful implementation as a grid of wires is di...


PUM

PropertyMeasurementUnit
Response functionaaaaaaaaaa
Distributionaaaaaaaaaa
Dynamicaaaaaaaaaa

Abstract

A spectroscopy instrument that uses spectra produced from random binary sequence modulated data. Statistical estimation techniques are used to achieve resolution enhancement, while properly accounting for the Poisson noise distribution and other artifacts introduced by a modulator or “chopper” or other system components. Indeed, a resolution similar to that of modern spectrometers can be achieved with a dramatic performance advantage over conventional, serial detection analyzers. Both static and dynamic behaviors are theoretically or measured experimentally accounted for in the model as determined. In one embodiment, the finite penetration of the field beyond the plane of the chopper leads to non-ideal chopper response, which is characterized in terms of an “energy corruption” effect and a lead or lag in the time at which the beam responds to the chopper potential.

Description

CROSS REFERENCE TO RELATED APPLICATIONS [0001] This application is a continuation of U.S. application Ser. No. 10 / 165,852, filed on Jun. 7, 2002, which claims the benefit of an earlier filed U.S. Provisional Patent Application No. 60 / 296,850 filed Jun. 8, 2001, entitled “Method for Enhancement of Electron Spectrometer Operation Using Maximum Likelihood Spectral Estimation Techniques”, the entire contents of which are hereby incorporated by reference.BACKGROUND OF THE INVENTION [0002] Despite dramatic advances in the energy resolution and throughput of electron monochromators for high resolution electron energy loss spectroscopy (HREELS), a major limitation of conventional, dispersive sector, electron energy analyzers is that they are inherently serial devices, leading to long data acquisition times. The advantage of higher resolution leads to trade-offs in performance (throughput) because channel step size must be reduced, and therefore increasing the number of channels required to ...

Claims


Application Information

Patent Timeline
IPC IPC(8): H01J49/44G01N23/05G21K1/087H01J49/02H01J49/04H01J49/06H01J49/40
CPCG01N23/05G21K1/087H01J49/0018H01J49/0031H01J49/061H01J49/446Y10T29/4902H01L2924/0002Y10T29/49082Y10T29/49156Y10T29/49117Y10T29/49155H01L2924/00
Inventor LEGORE, LAWRENCE J.JACKSON, ROBERT H. IIIYANG, ZHONG YUDENOYER, LINDA K.KLEBAN, PETER H.FREDERICK, BRIAN G.
Owner UNIVERSITY OF MAINE
Learn More