Method for gene mapping from genotype and phenotype data

a technology of genotype and phenotype, applied in the field of gene mapping from genotype and phenotype data, can solve the problems of affecting the accuracy of the data, the impact of real data violations, and the inability to consider the association of one region at a time, so as to avoid the technical difficulties, costly and sometimes impossible steps, and the effect of model-free and computationally effectiv

Inactive Publication Date: 2005-11-10
LICENTIA OY
View PDF0 Cites 7 Cited by
  • Summary
  • Abstract
  • Description
  • Claims
  • Application Information

AI Technical Summary

Benefits of technology

[0013] The object of the present invention is to provide a model-free and computationally effective method allowing direct association analysis on genotype rather than haplo-type data, which overcomes the above-mentioned drawbacks. The invention o

Problems solved by technology

However, the methods contain assumptions about the inheritance model of the disease and the structure of the survey population, and the effects of violations of these assumptions in the real data are not known.
In addition, they can only consider association of one region at a time.
The methods also tend to be computationally heavy.
As will be explained below, this requirement causes various problems in gene mapping methods, and thus also in the HPM method.
This means that the parents first have to be recruited, which is not always straightforward, as they might no longer be alive, or cannot be reached, or refuse from giving blood samples.
Genotyping more individuals is laborious and elevates the study expenses: per every case or control, 3 individuals will be genotyped instead of just one, so genotyping is done on 3 times as many persons as there are cases and controls.
As an alternative to these haplotyping approaches, s

Method used


Image

  • Method for gene mapping from genotype and phenotype data
  • Method for gene mapping from genotype and phenotype data
  • Method for gene mapping from genotype and phenotype data

Examples


example 1

Simulated Data Sets

[0120] We evaluated the performance of the proposed HPM-G method with simulated data sets that correspond to a recently founded, relatively isolated founder subpopulation. Simulation of a population isolate was chosen, since it is recommended as the study population for LD studies. However, the method can be applied to any population that is suitable for LD analysis, since no assumptions are made about the population structure.

[0121] An isolated founder population, which grows from the initial size of 200 to 100,000 individuals in 20 generations, was simulated.

[0122] The population pedigree was first generated assuming distinct generations and ex-ponential growth of the population size. In each generation, the parents of the newborn individuals were randomly selected from members of the previous generation, with the exception that whenever a parent with at least one child was chosen, his / her spouse was always forced to become the other parent of the child. This...

example 2

Comparison to HPM

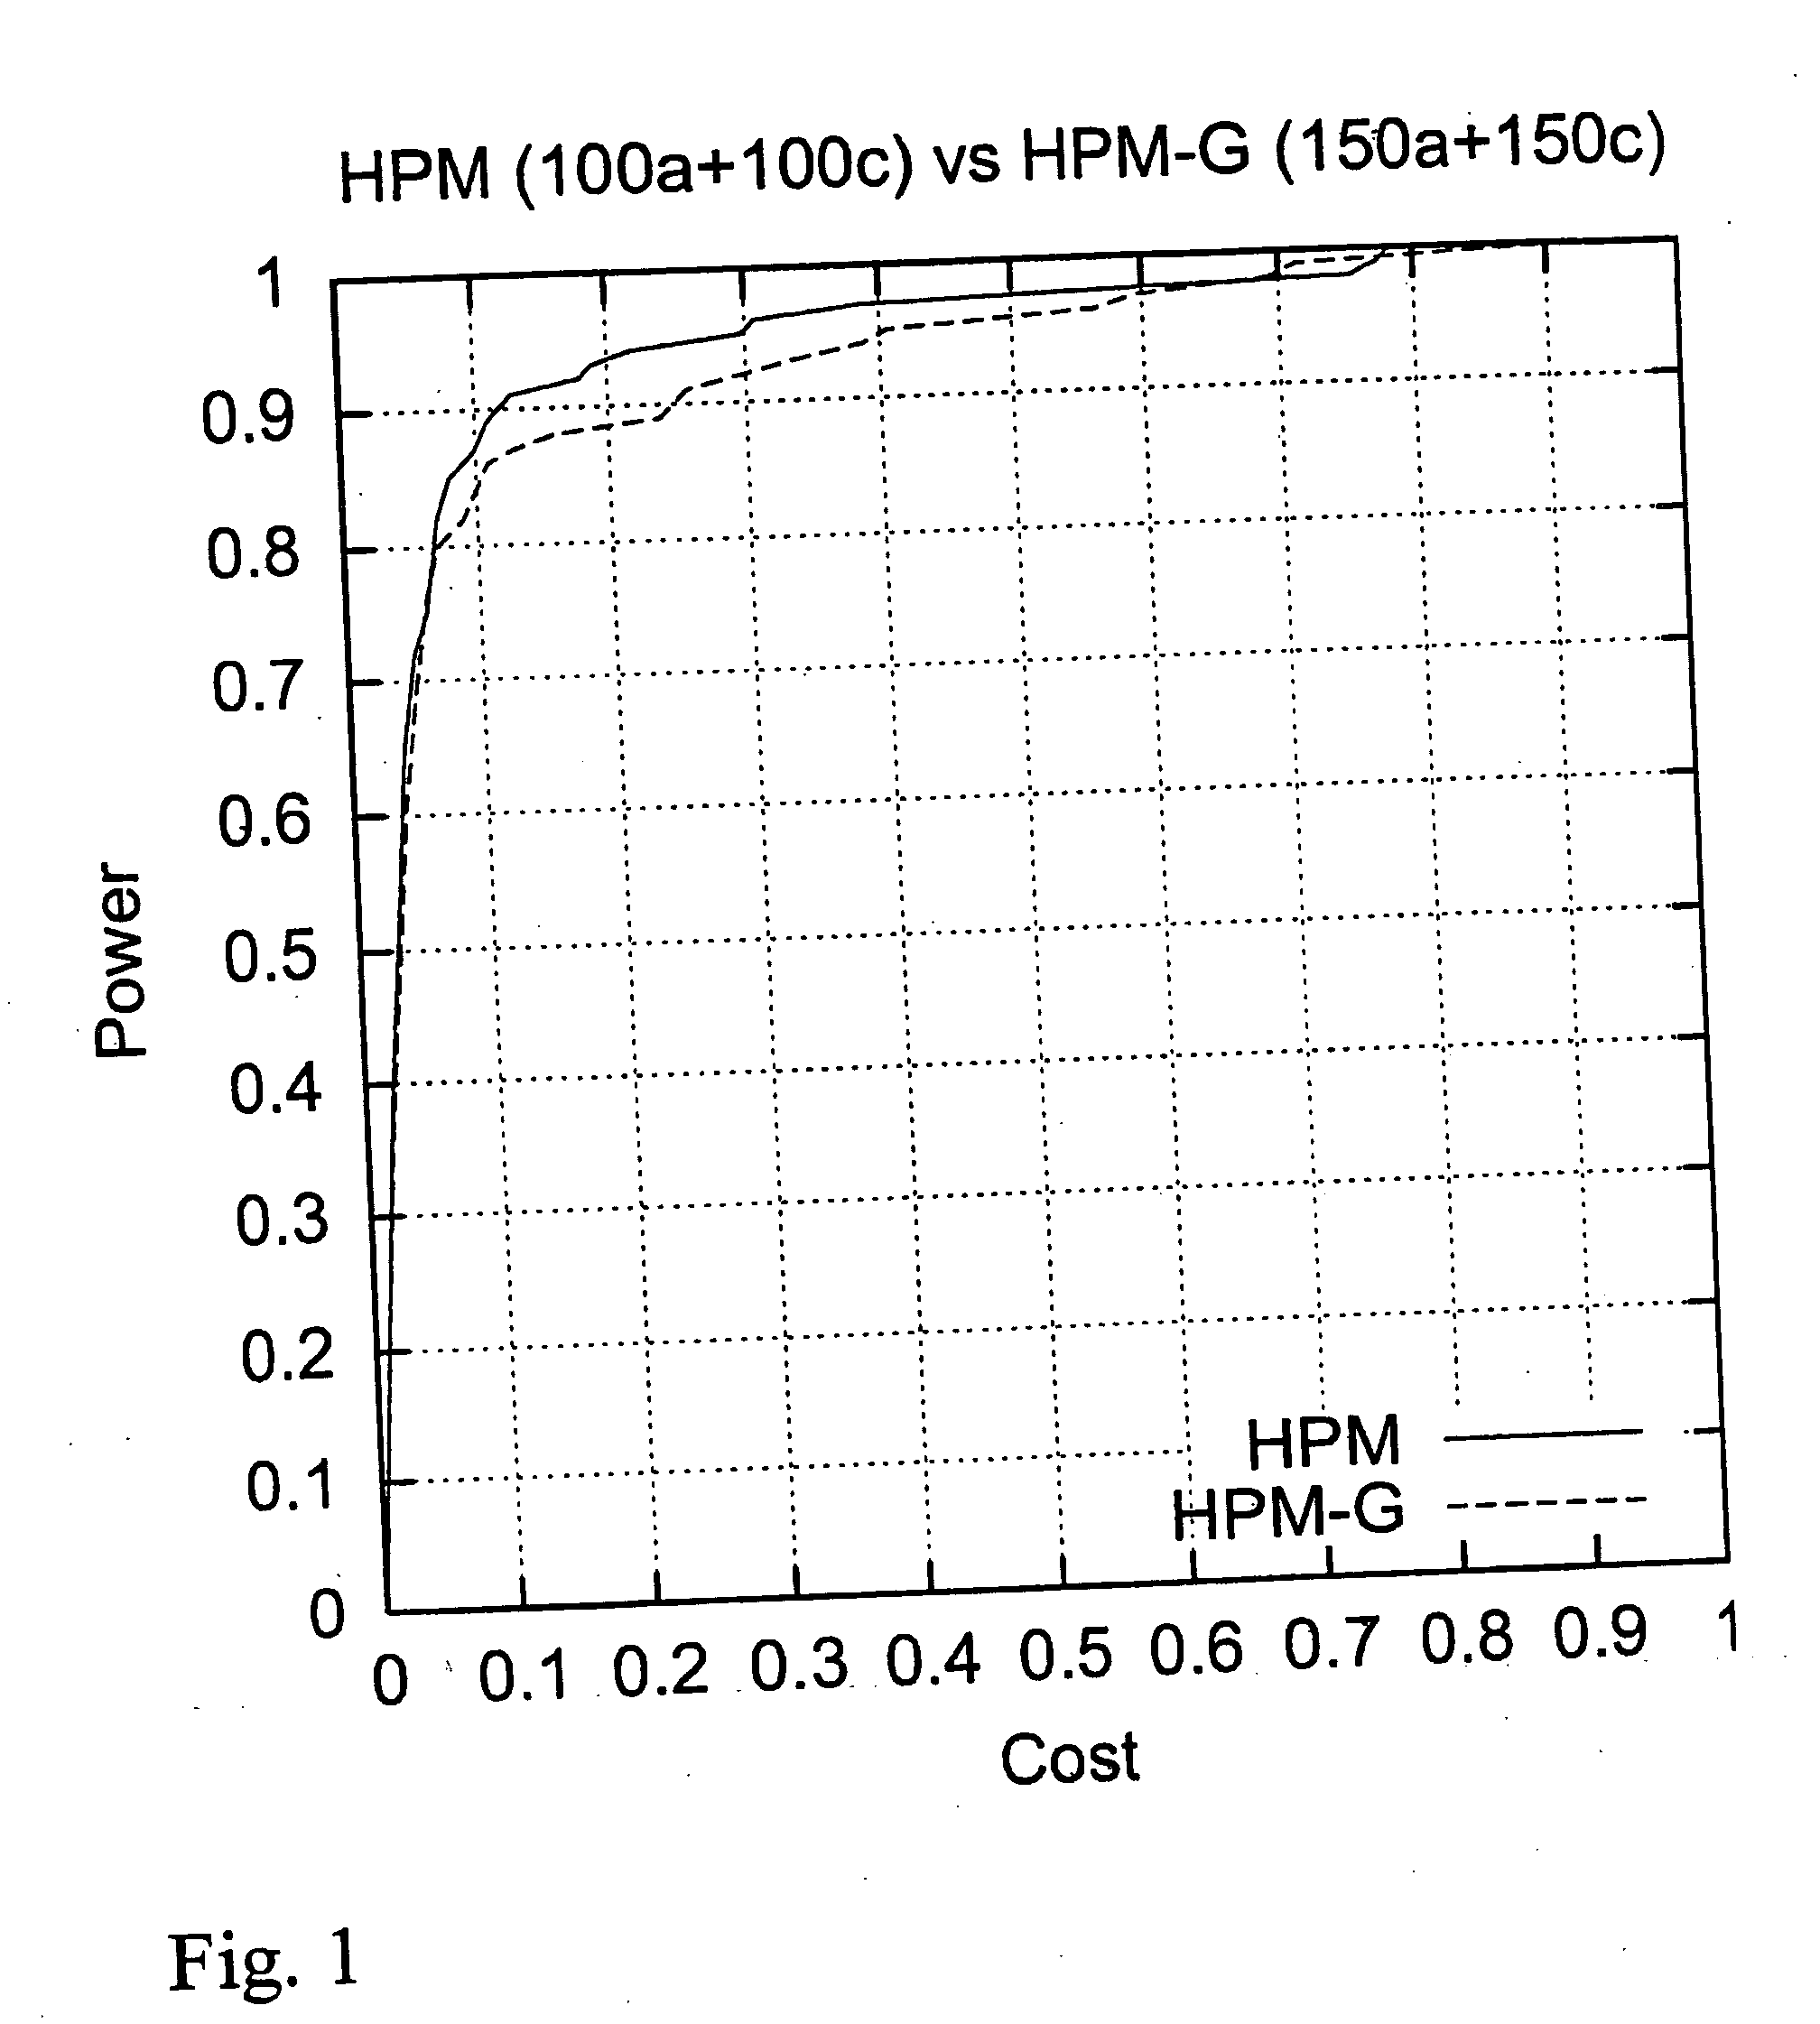
[0132] The localization accuracy was explored by plotting curves similar to power graphs:

[0133] the height of the curve shows the fraction of data sets for which the localization was successful, as a function of the length of the predicted region. The sample consisted of 150 affected and 150 control genotypes. The maximum length of a pattern was 7, and one gap of one marker was allowed. The association threshold was set to 10.

[0134] These numbers were based on experimentation. For comparison, we also show the corresponding curve for HPM with ⅓ smaller sample size, and thus equal genotyping cost (FIG. 1). With HPM we used association threshold 9, the parameters for the patterns were the same than those used with HPM-G.

[0135] The results show that HPM-G has a high accuracy, and that it is extremely competitive even in comparison to state-of-the-art methods that use explicitly haplotyped data.

example 3

Effect of Sample Size

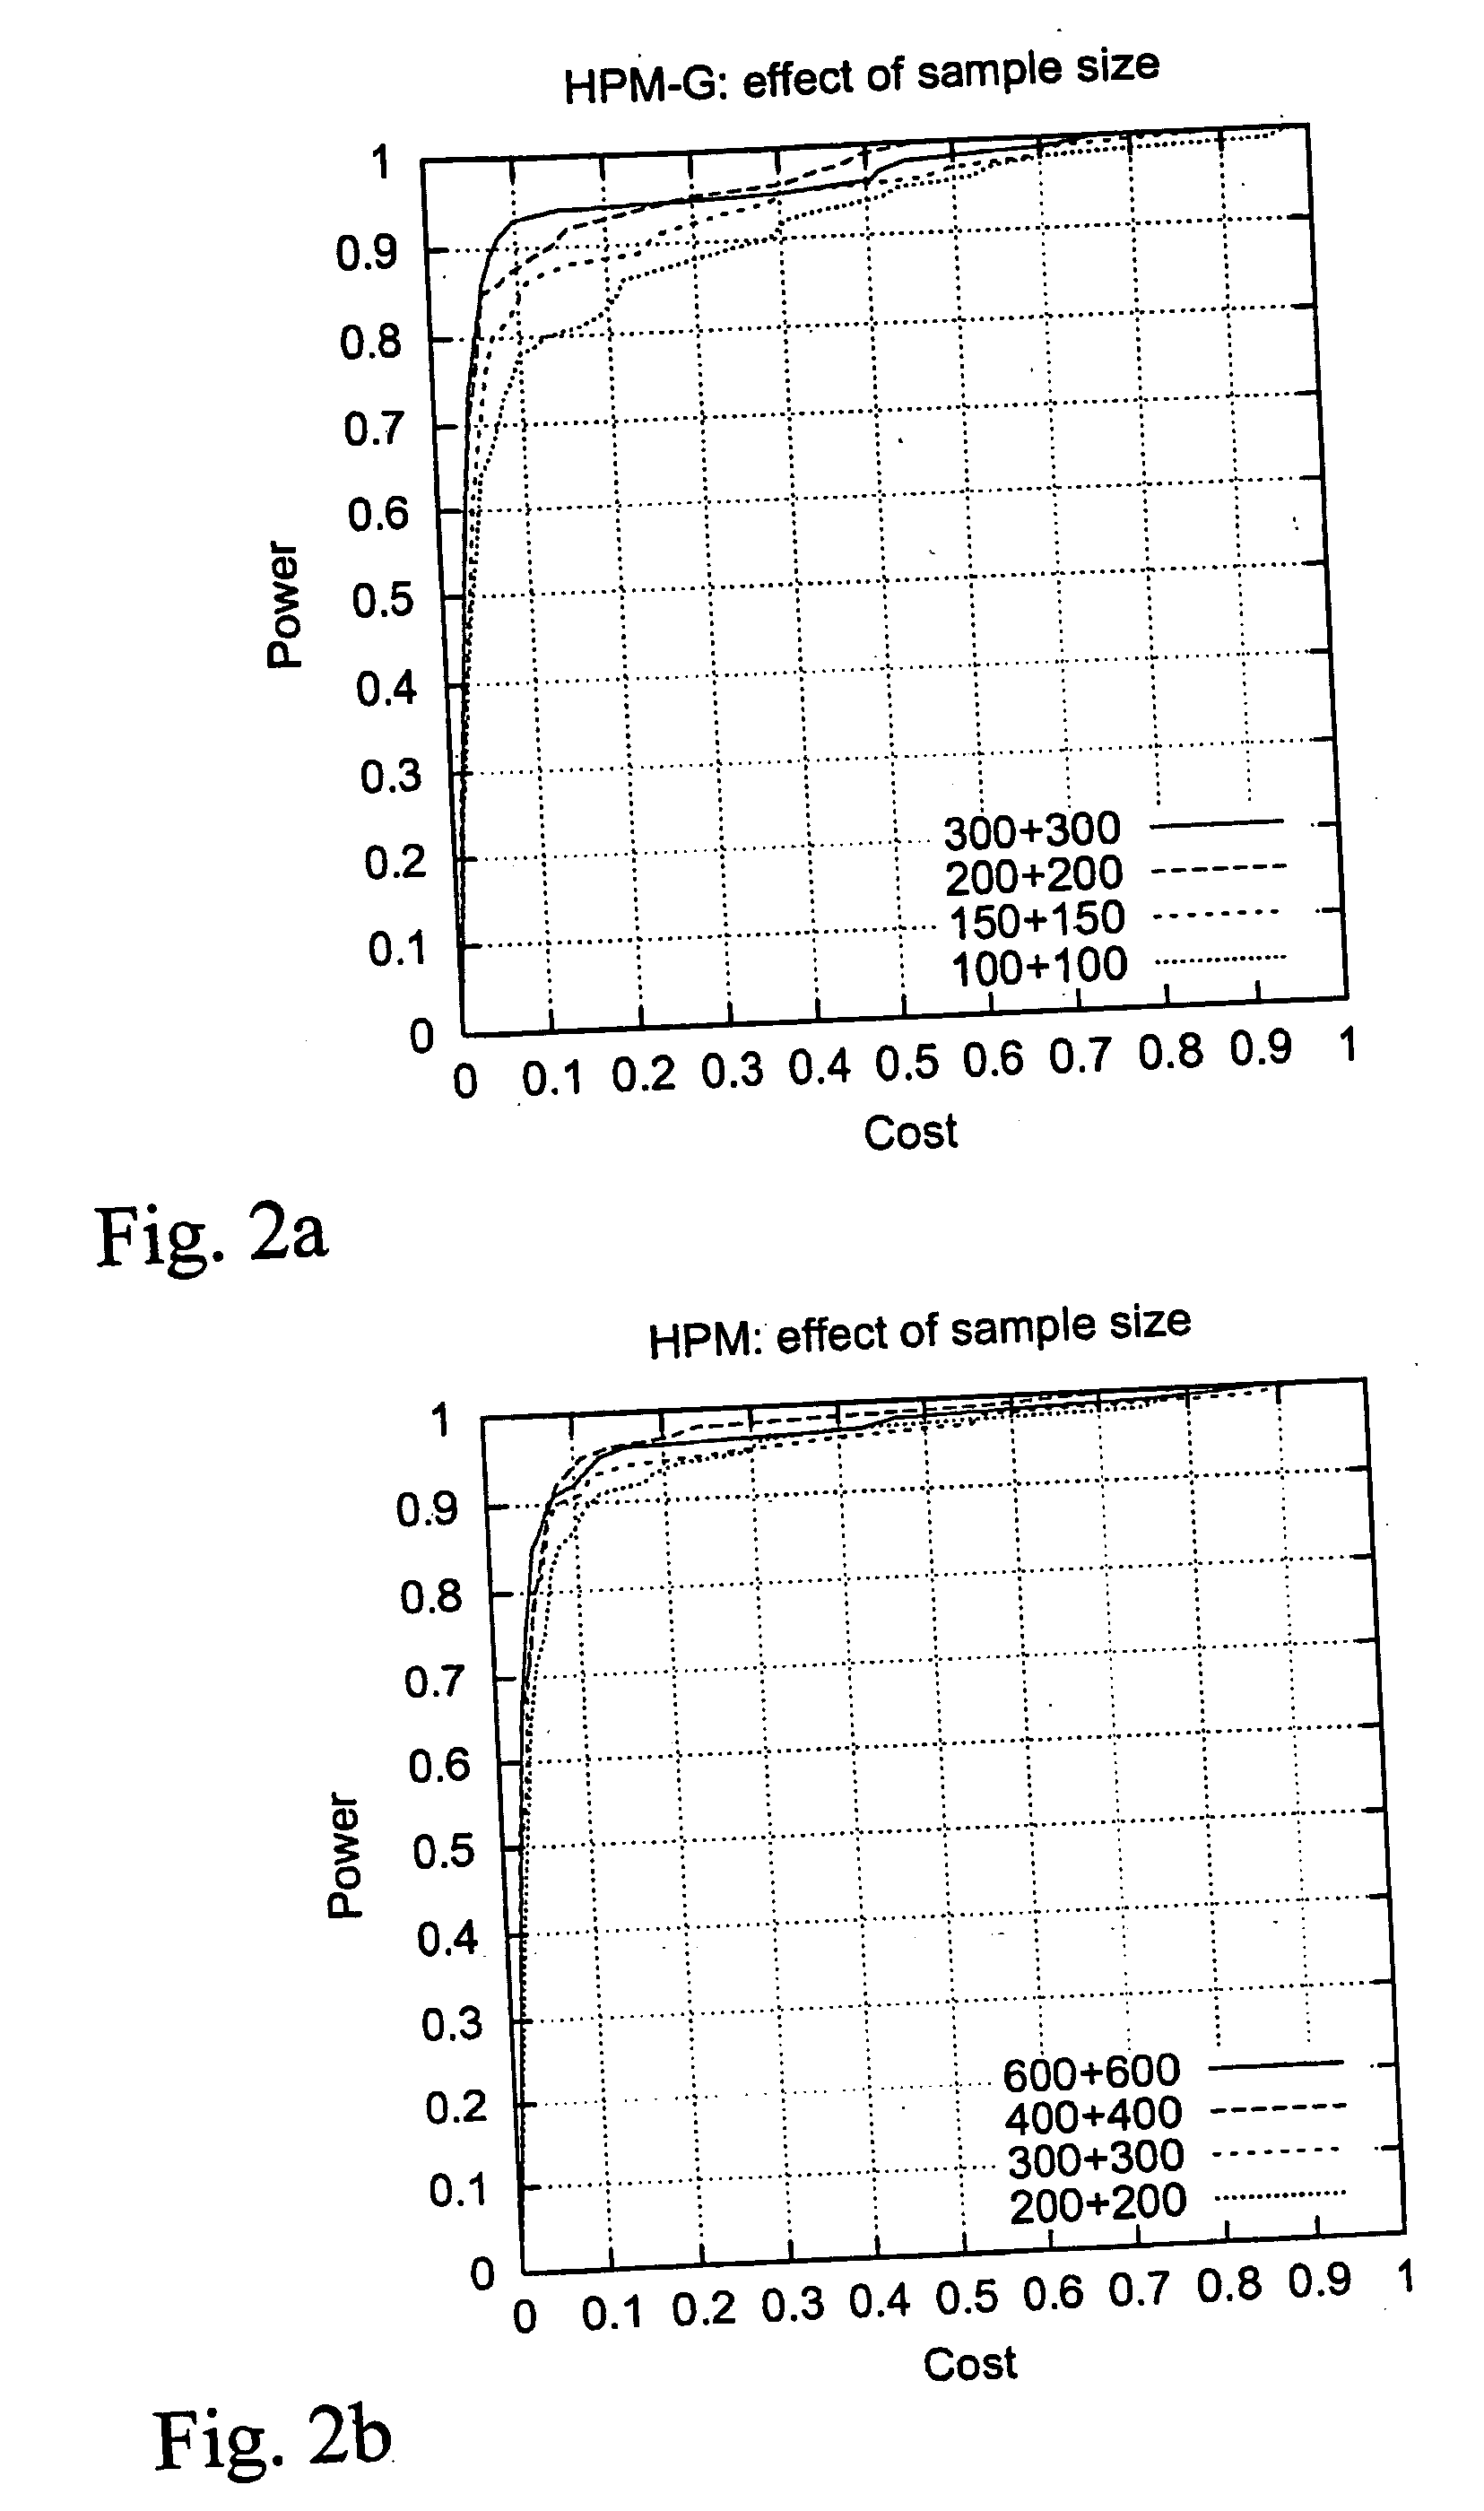
[0136] The effect of sample size was examined by experimenting with sample sizes of 100+100, 150+150, 200+200 and 300+300 people (FIG. 2a). FIG. 2b shows the corresponding results for HPM.

[0137] HPM-G performs well even with only 100+100 genotypes. On the other hand, if the amount of data is increased, the accuracy is improved.


PUM

PropertyMeasurementUnit
Fractionaaaaaaaaaa
Fractionaaaaaaaaaa
Weightaaaaaaaaaa

Abstract

A method for gene mapping from genotype and phenotype data utilizes linkage disequilibrium between genetic markers mi, which are polymorphic nucleic acid or protein sequences or strings of single-nucleotide polymorphisms deriving from a chromosomal region. All marker patterns P that satisfy a certain pattern evaluation function e(P) are searched from the data, each marker mi of the data is scored by a marker score and the location of the gene is predicted as a function of the scores s(mi) of all the markers mi in the data.

Description

FIELD OF THE INVENTION [0001] The present invention relates to a method for gene mapping from genotype and phenotype data, which method utilizes linkage disequilibrium between genetic markers mi, which are polymorphic nucleic acid or protein sequences or strings of single-nucleotide polymorphisms deriving from a chromosomal region. BACKGROUND OF THE INVENTION [0002] The use of linkage disequilibrium (LD) in detecting disease genes has recently drawn much attention in genetic epidemiology. LD is evaluated with association analysis, which, when applied to disease-gene mapping, requires the comparison of allele or haplotype frequencies between the affected and the control individuals, under the assumption that a reasonable proportion of disease-associated chromosomes has been derived from a common ancestor. Traditional association analysis methods have long been used to test the involvement of candidate genes in diseases and, in special circumstances, to fine-map disease loci found by ...

Claims


Application Information

Patent Timeline
IPC IPC(8): G16B20/40C12QC12Q1/68G01N33/48G01N33/50G06F17/00G16B40/00
CPCG06F19/24G06F19/18G16B20/00G16B40/00G16B20/40
Inventor TOIVONEN, HANNU T. T.ONKAMO, PAIVIVASKO, KARIOLLIKAINEN, VESASEVON, PETTARIMANNILA, HEIKKIKERE, JUHA
Owner LICENTIA OY
Why Eureka
Try Eureka