
Normalization methods for genotyping analysis

a genotyping analysis and normalization method technology, applied in the field of genotyping analysis, can solve the problems of reducing quantitative accuracy, reducing overall results confidence, and often confounding data resolution and analysis, and achieves the effects of convenient comparative analysis, simple and efficient, and convenient comparison and processing

Inactive Publication Date: 2006-08-10
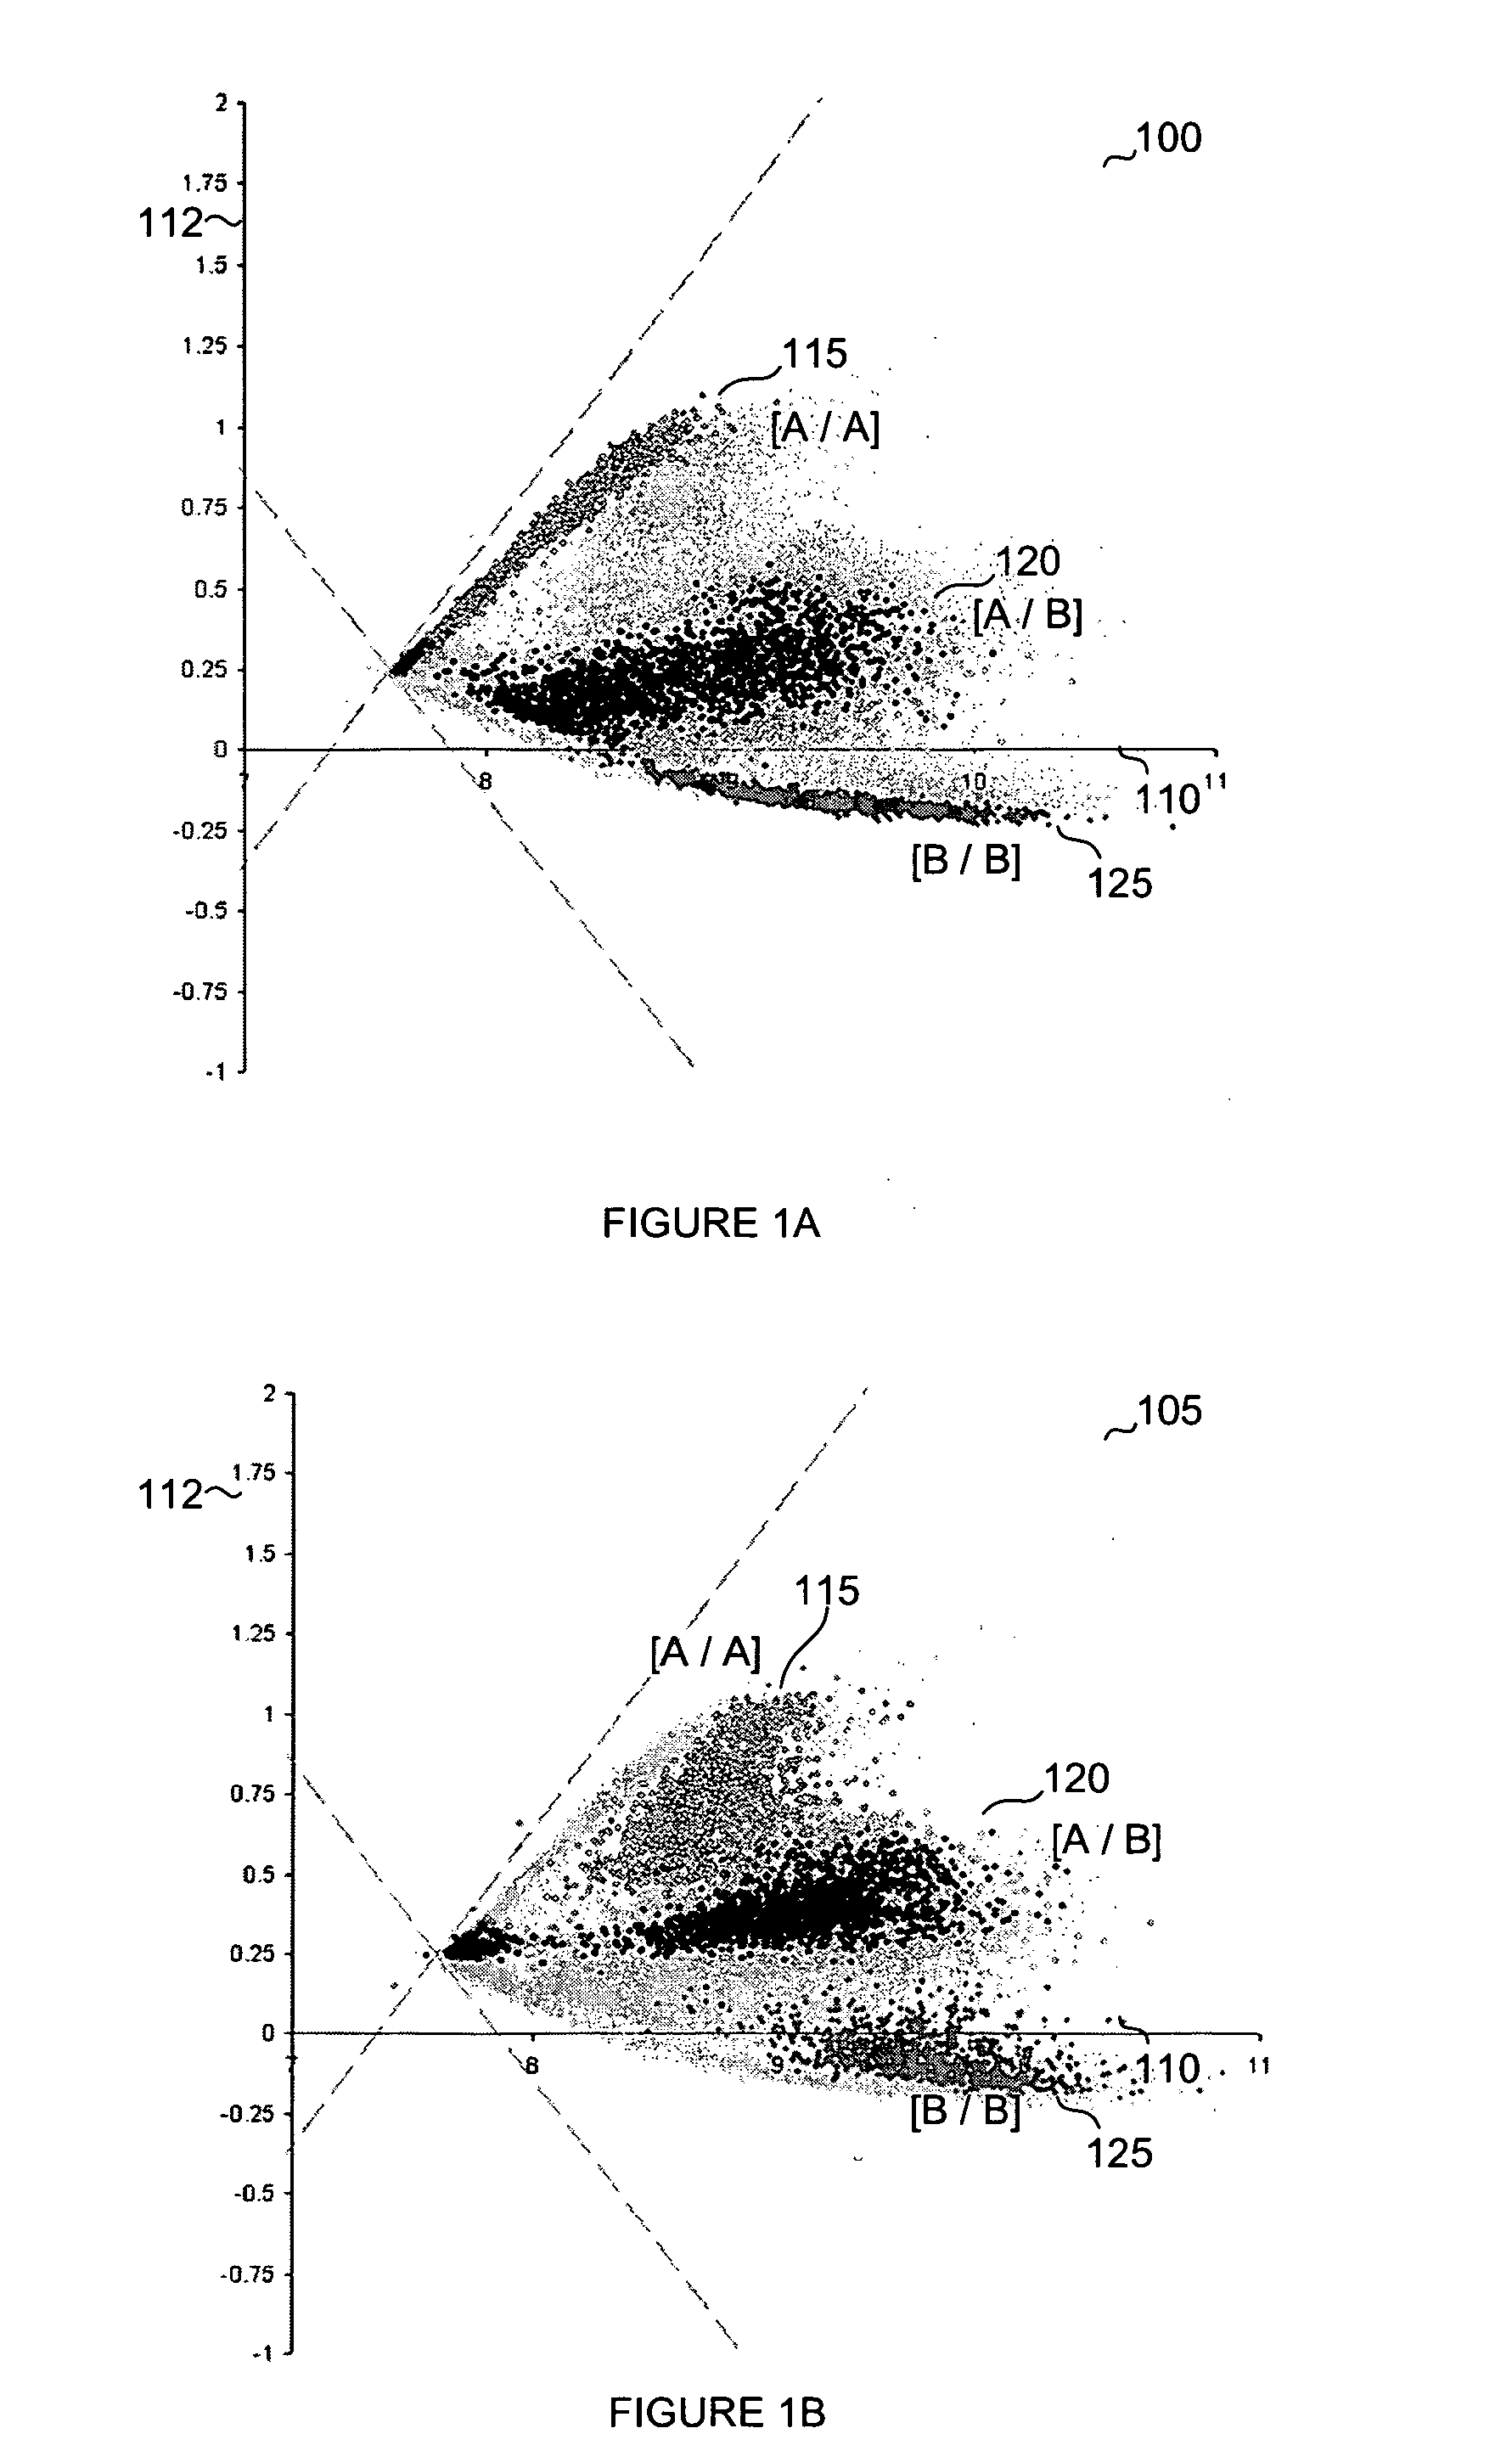
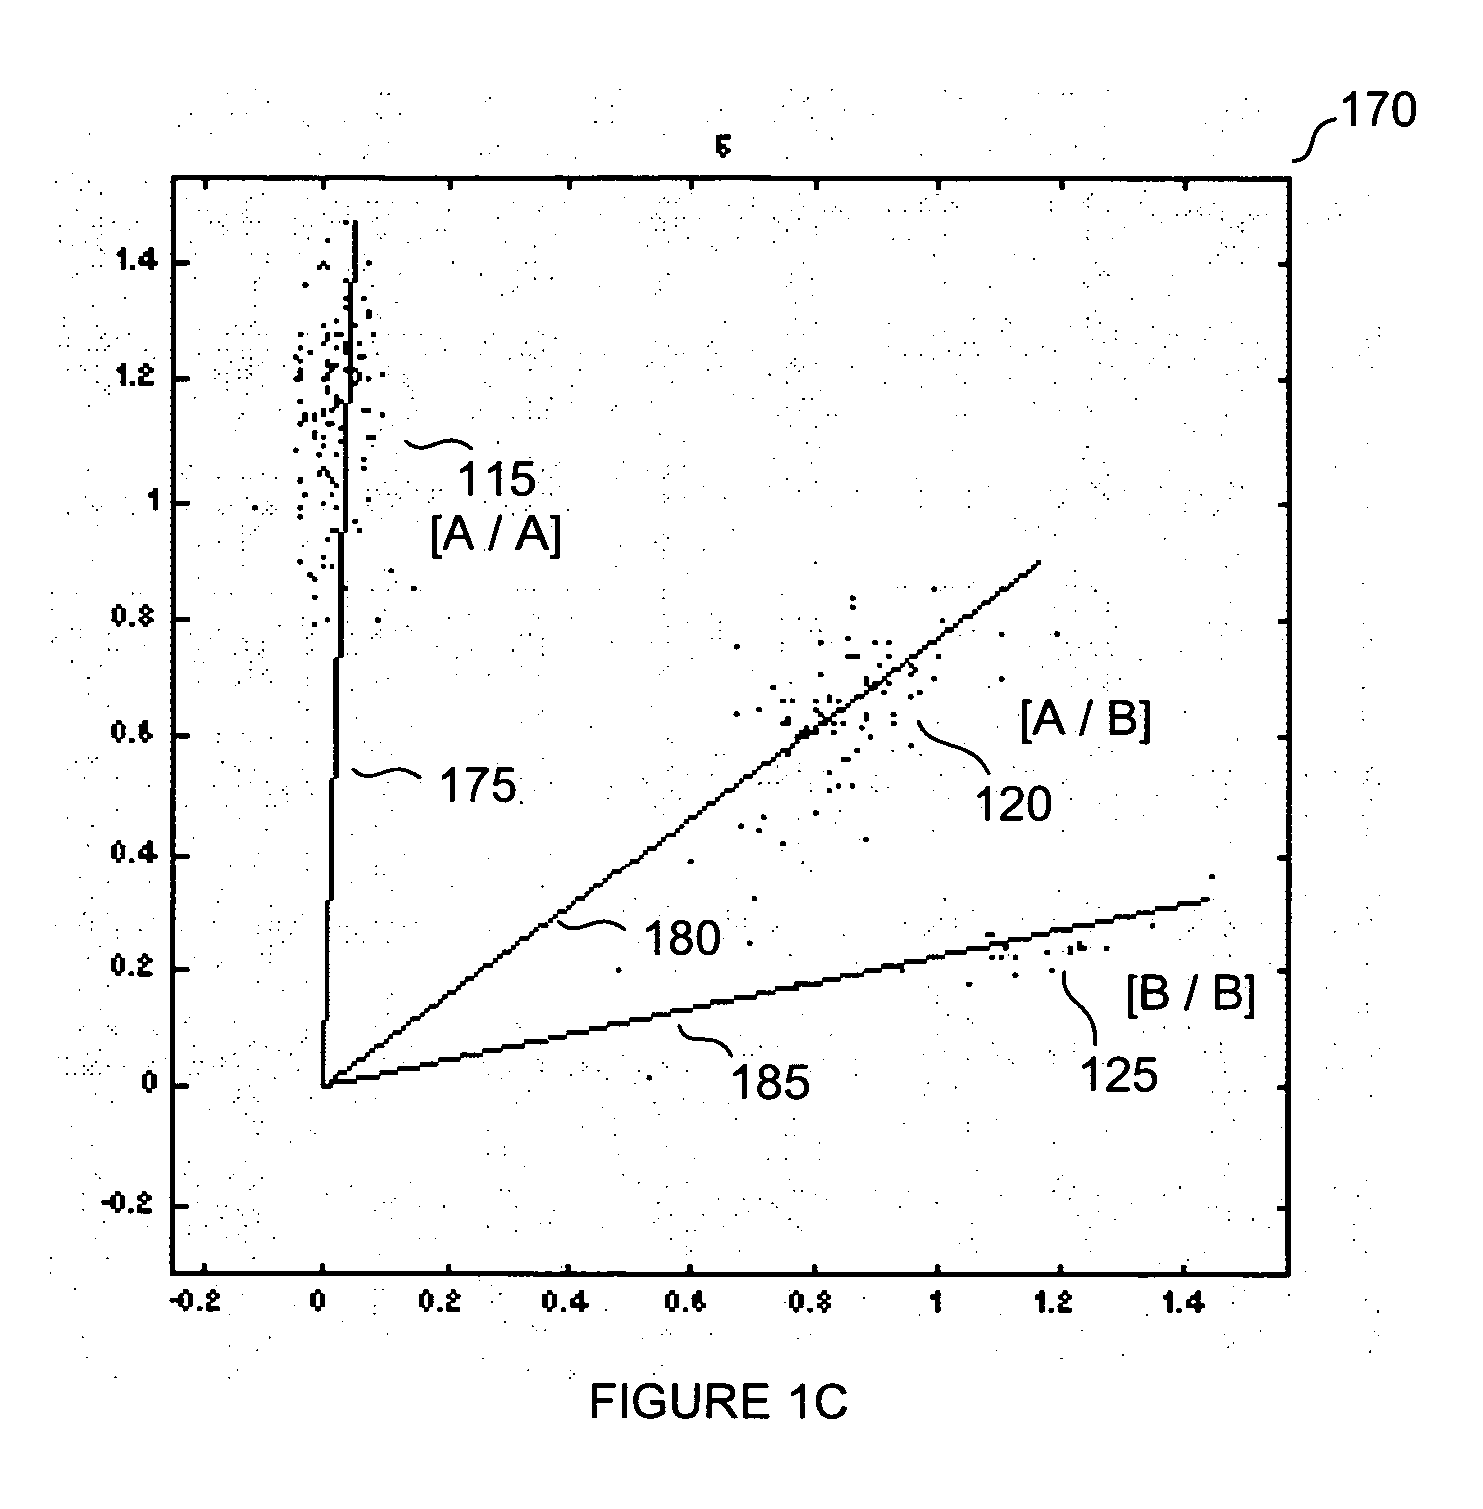
APPL BIOSYSTEMS INC
View PDF2 Cites 25 Cited by
  • Summary
  • Abstract
  • Description
  • Claims
  • Application Information

AI Technical Summary

Benefits of technology

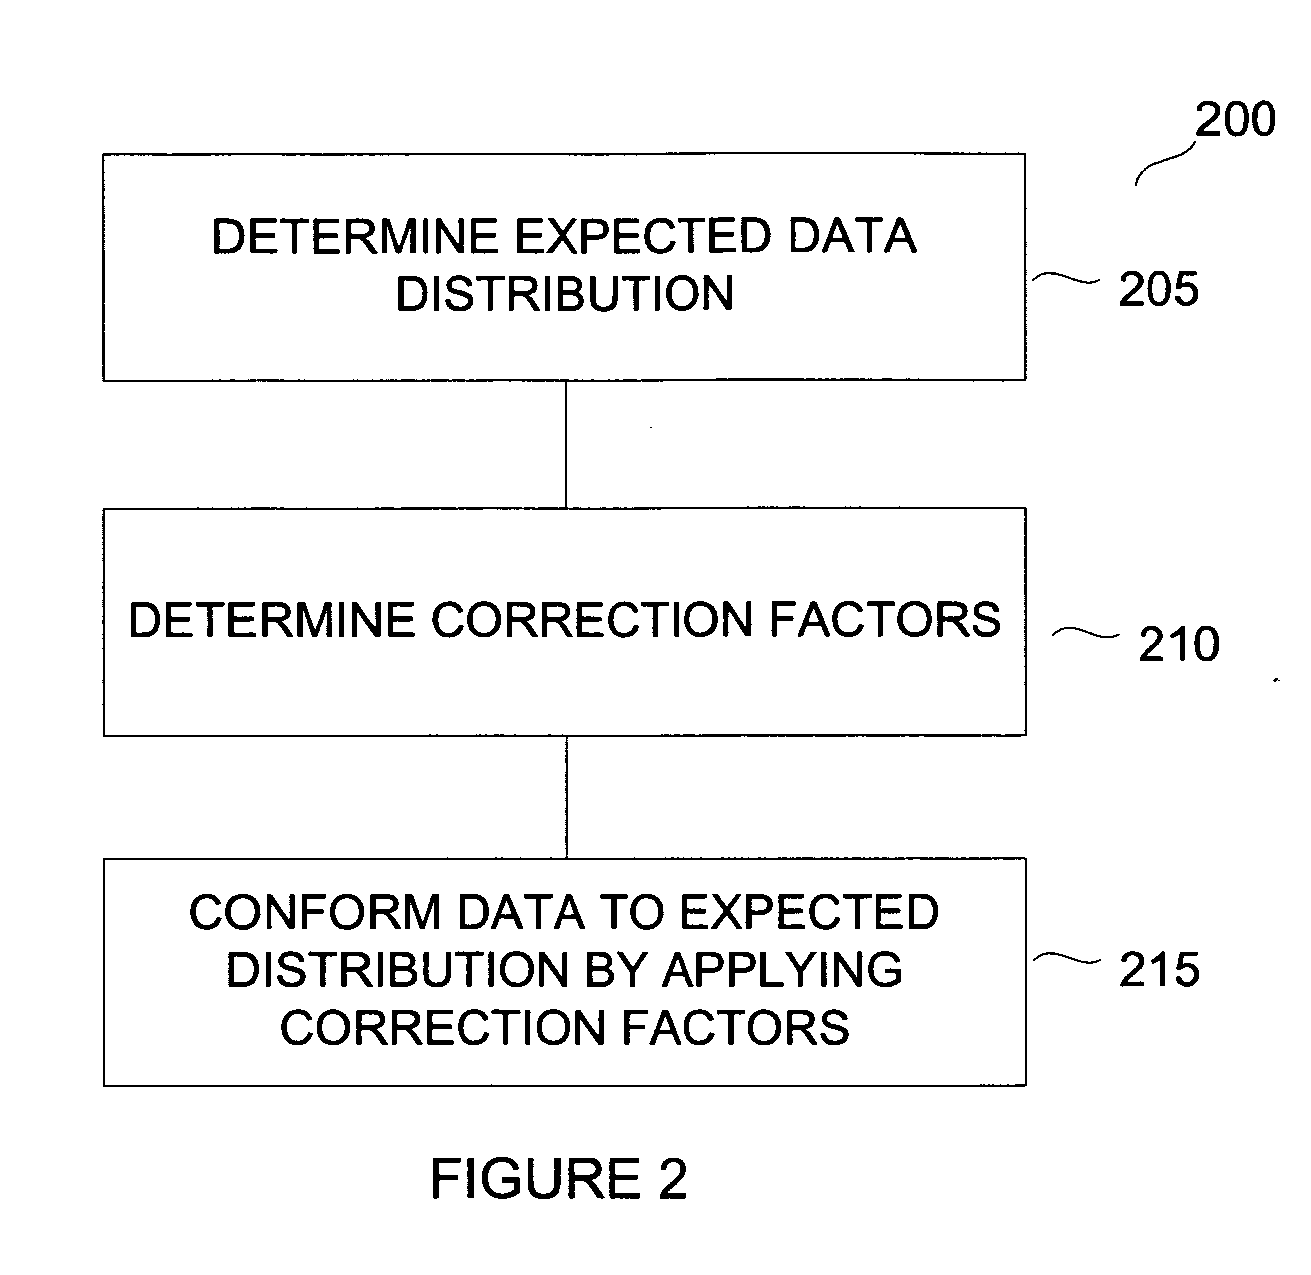
[0003] In various embodiments the present teachings describe methods for identifying and accounting for variabilities / deviations between data sets. These methods implement numerical approaches to analyze the relationship between one or more series / collections of data points (for example, signal or intensity data from a microarray or multiplex-PCR assay). These processes may be applied to array-based data or multi-component analyses to facilitate the comparison and processing of data arising from two or more sample sets. Correction factors are developed and used in the normalization of the data sets with respect to one another to facilitate comparative analysis. This approach provides a relatively straightforward and efficient mechanism to assess and correlate data. Furthermore, the disclosed methods may increase quantitative accuracy and improve overall confidence in the analysis.
[0004] In certain embodiments, the disclosed methods may be directed towards the evaluation of genotyping data. Data processing in this context may involve performing analyses across multiple data sets grouped into one or more clusters wherein the standard deviation between data of the clusters includes variabilities such as non-linear spectral shifts. The observed variabilities may be expressed as angular values and graphically represented. The methods described herein do not necessarily require control sample information to conduct the normalization process allowing this information to be used in other ways such as in assessing assay performance. This approach may be desirable as control sample information can be retained to independently verify the accuracy of the correction factors. Furthermore, the disclosed methods may be readily adapted for use with or incorporated into new and existing data analysis software to perform data normalization in an automated manner.

Problems solved by technology

While, many hundreds, if not thousands, of different targets can be simultaneously evaluated in this manner, data resolution and analysis is frequently confounded by sample-to-sample variations including non-linear spectral shifts.
This problem is particularly apparent when attempting to compare data across multiple samples or experiments.
Conventional normalization and scaling methods that adjust raw data so that it may be used in comparative analysis frequently introduce undesirable errors or biases that reduce quantitative accuracy and diminish overall results confidence.

Method used


Image

  • Normalization methods for genotyping analysis
  • Normalization methods for genotyping analysis
  • Normalization methods for genotyping analysis

Examples


example 1

[0072] Example 1 represents the results obtained for a relatively small data set comprising 5 different SNPs in 6 samples. Fluorescence intensities between the two alleles for each SNP were determined. The fluorescence intensities were graphed such that one allele was represented on the x-axis and the second allele was represented on the y-axis. From this information, the polar angle was determined. These operations were performed for each SNP in each sample (see Table 1).

TABLE 1Sample Data:SampleSampleSampleSampleSampleSampleAngles123456SNP 1108515404580SNP 2122032460SNP 3111564045SNP 49034386510SNP 5884745707385

[0073] Using the aforementioned ranking approach each data point was ranked according to fluorescence intensity within its respective sample as shown in Table 2. In this case, the data point was ranked from lowest to highest angle. However, ranking could have similarly proceeded from highest to lowest. In general, the method of ranking will be similar for each sample.

TA...

example 2

[0075] Example 2 represents the results obtained for a larger data set wherein a SNP analysis was performed using fluorescence data obtained from 667 detectable SNPs. Using this information, an approximated accuracy assessment was determined before and after correction using the correction factor determination method described in connection with FIG. 3. Using this method, known SNPs were tested for call accuracy and the results plotted as a pie chart (see FIGS. 6A and 6B).

[0076] When evaluating the call accuracy over all loci for the selected set of SNPs without applying the correction factors, it was determined that approximately 42% of the SNPs (e.g. 283 SNPs) displayed a call accuracy below 95%. Of the remaining SNPs, 24% (e.g. 161 SNPs) demonstrated a call accuracy between 95%-99% and 33% (e.g. 223 SNPs) demonstrated a call accuracy greater than 99%.

[0077] However, after calculation and application of the correction factors as described by the present teachings a significant i...


PUM


Abstract

In arrays and other high density analysis platforms variabilities between data points and / or data sets may arise for a number of reasons. Disclosed are methods for addressing these variabilities and generating correction factors that may be used in conforming the data to expected or desired distributions. The methods may be adapted to operate with existing data analysis approaches and software applications to improve downstream analysis.

Description

FIELD [0001] The present teachings generally relate to the field of genetic analysis and more particularly to methods for normalization of genotyping data. INTRODUCTION [0002] High density analysis platforms such as oligonucleotide microarrays and multiplexed PCR assays are widely used in the study of complex biological samples. These technologies have been adapted for use in experiments wherein large numbers of genes or proteins from multiple samples are compared and / or evaluated. Additionally, these technologies have found application in a variety of areas including: expression profiling, sequencing, mutational analysis, genotyping, and organism / disease identification. In general, fluorescent, radioactive, or chemiluminescent labels / tags are used as a mechanism for detection and quantitation on the basis of observed signal intensities. While, many hundreds, if not thousands, of different targets can be simultaneously evaluated in this manner, data resolution and analysis is freque...

Claims


Application Information

Patent Timeline
IPC IPC(8): G06F19/00G16B40/10G16B25/10
CPCG06F19/20G06F19/22G06F19/24G16B25/00G16B30/00G16B40/00G16B40/10G16B25/10
Inventor MARKS, JEFFREY A.
Owner APPL BIOSYSTEMS INC
Learn More