Method and system for measuring the concentrations of fluorescent dyes

Active Publication Date: 2007-05-31
HAMAMATSU PHOTONICS KK
View PDF4 Cites 33 Cited by
  • Summary
  • Abstract
  • Description
  • Claims
  • Application Information

AI Technical Summary

Benefits of technology

[0022] The above-described calculation formula is not affected by overlap between the fluorescence spectra of the of fluorescent dyes contained in the target sample. Thus, this measurement system is able to accurately determine the concentrations of the fluorescent dyes having the overlapping fluorescence spectra. The number of fluorescent dyes that can be measured by this system is equal to (the number of detection wavelength bands)×(the number of types of excitation beams). Therefore, it is possible to increase the number of fluorescent dyes that can be measured, according to the number of types of excitation beams.
[0023] In the measurement system of the present invention, the imaging device may include one or more imaging devices for taking the fluorescence images of the target sample in the first to kth detection wavelengt

Problems solved by technology

The replacement of filter set will cause a slight change in an optical system and thus affect the accuracy of the measurement

Method used


Image

  • Method and system for measuring the concentrations of fluorescent dyes
  • Method and system for measuring the concentrations of fluorescent dyes
  • Method and system for measuring the concentrations of fluorescent dyes

Examples


first example

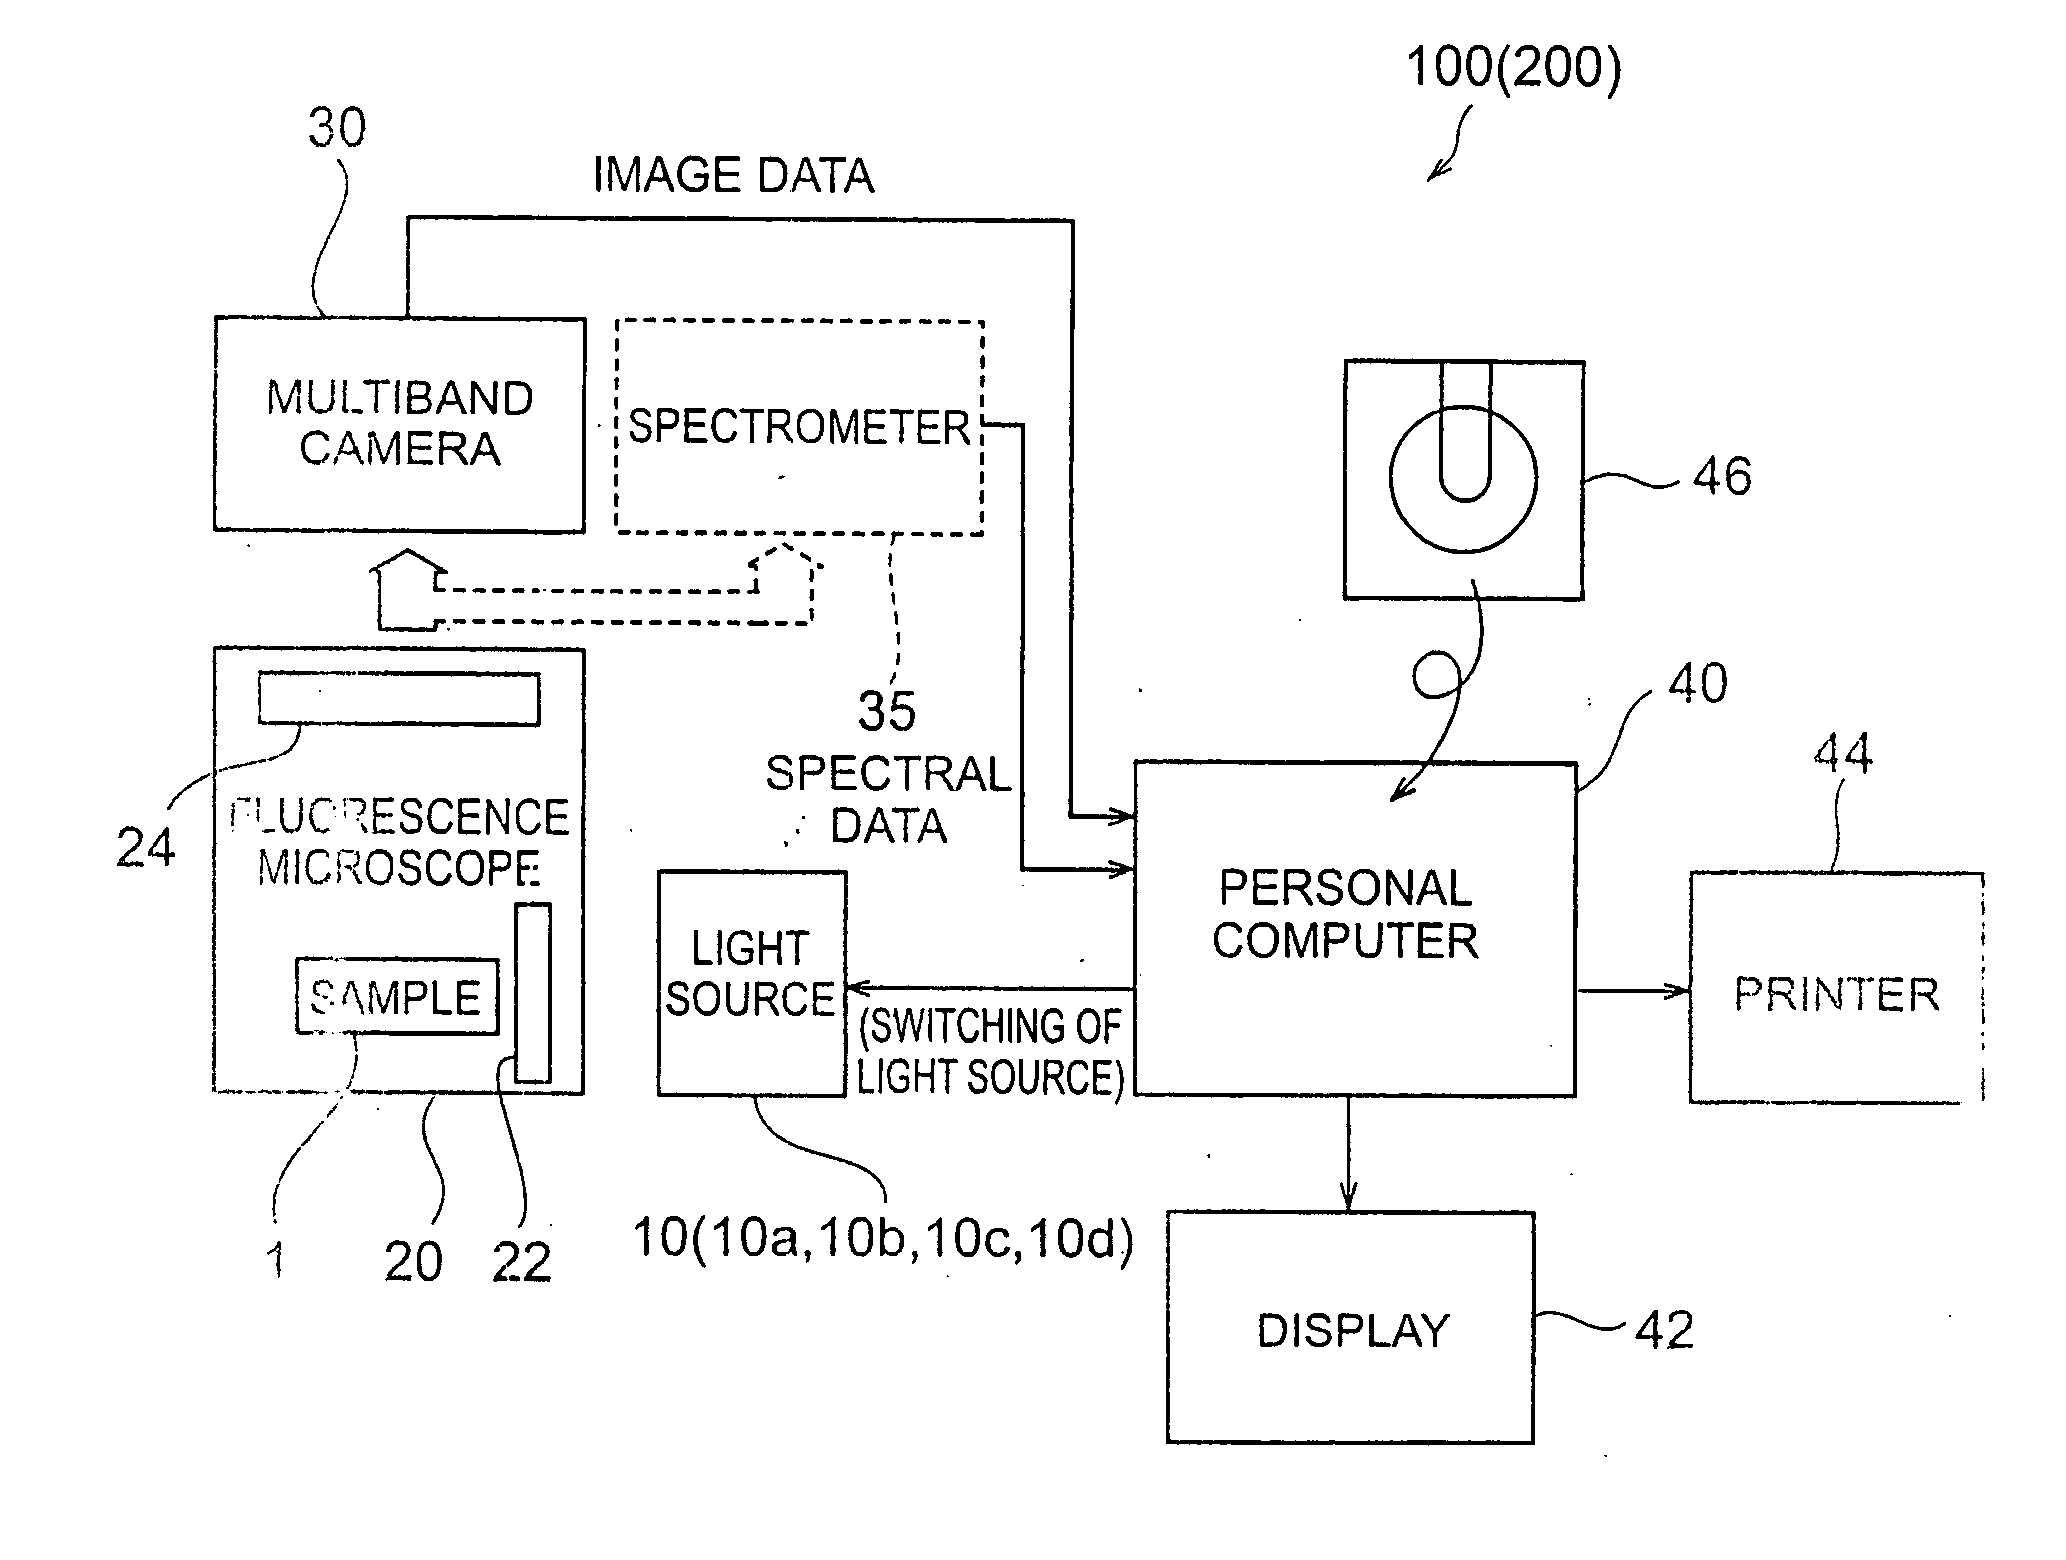
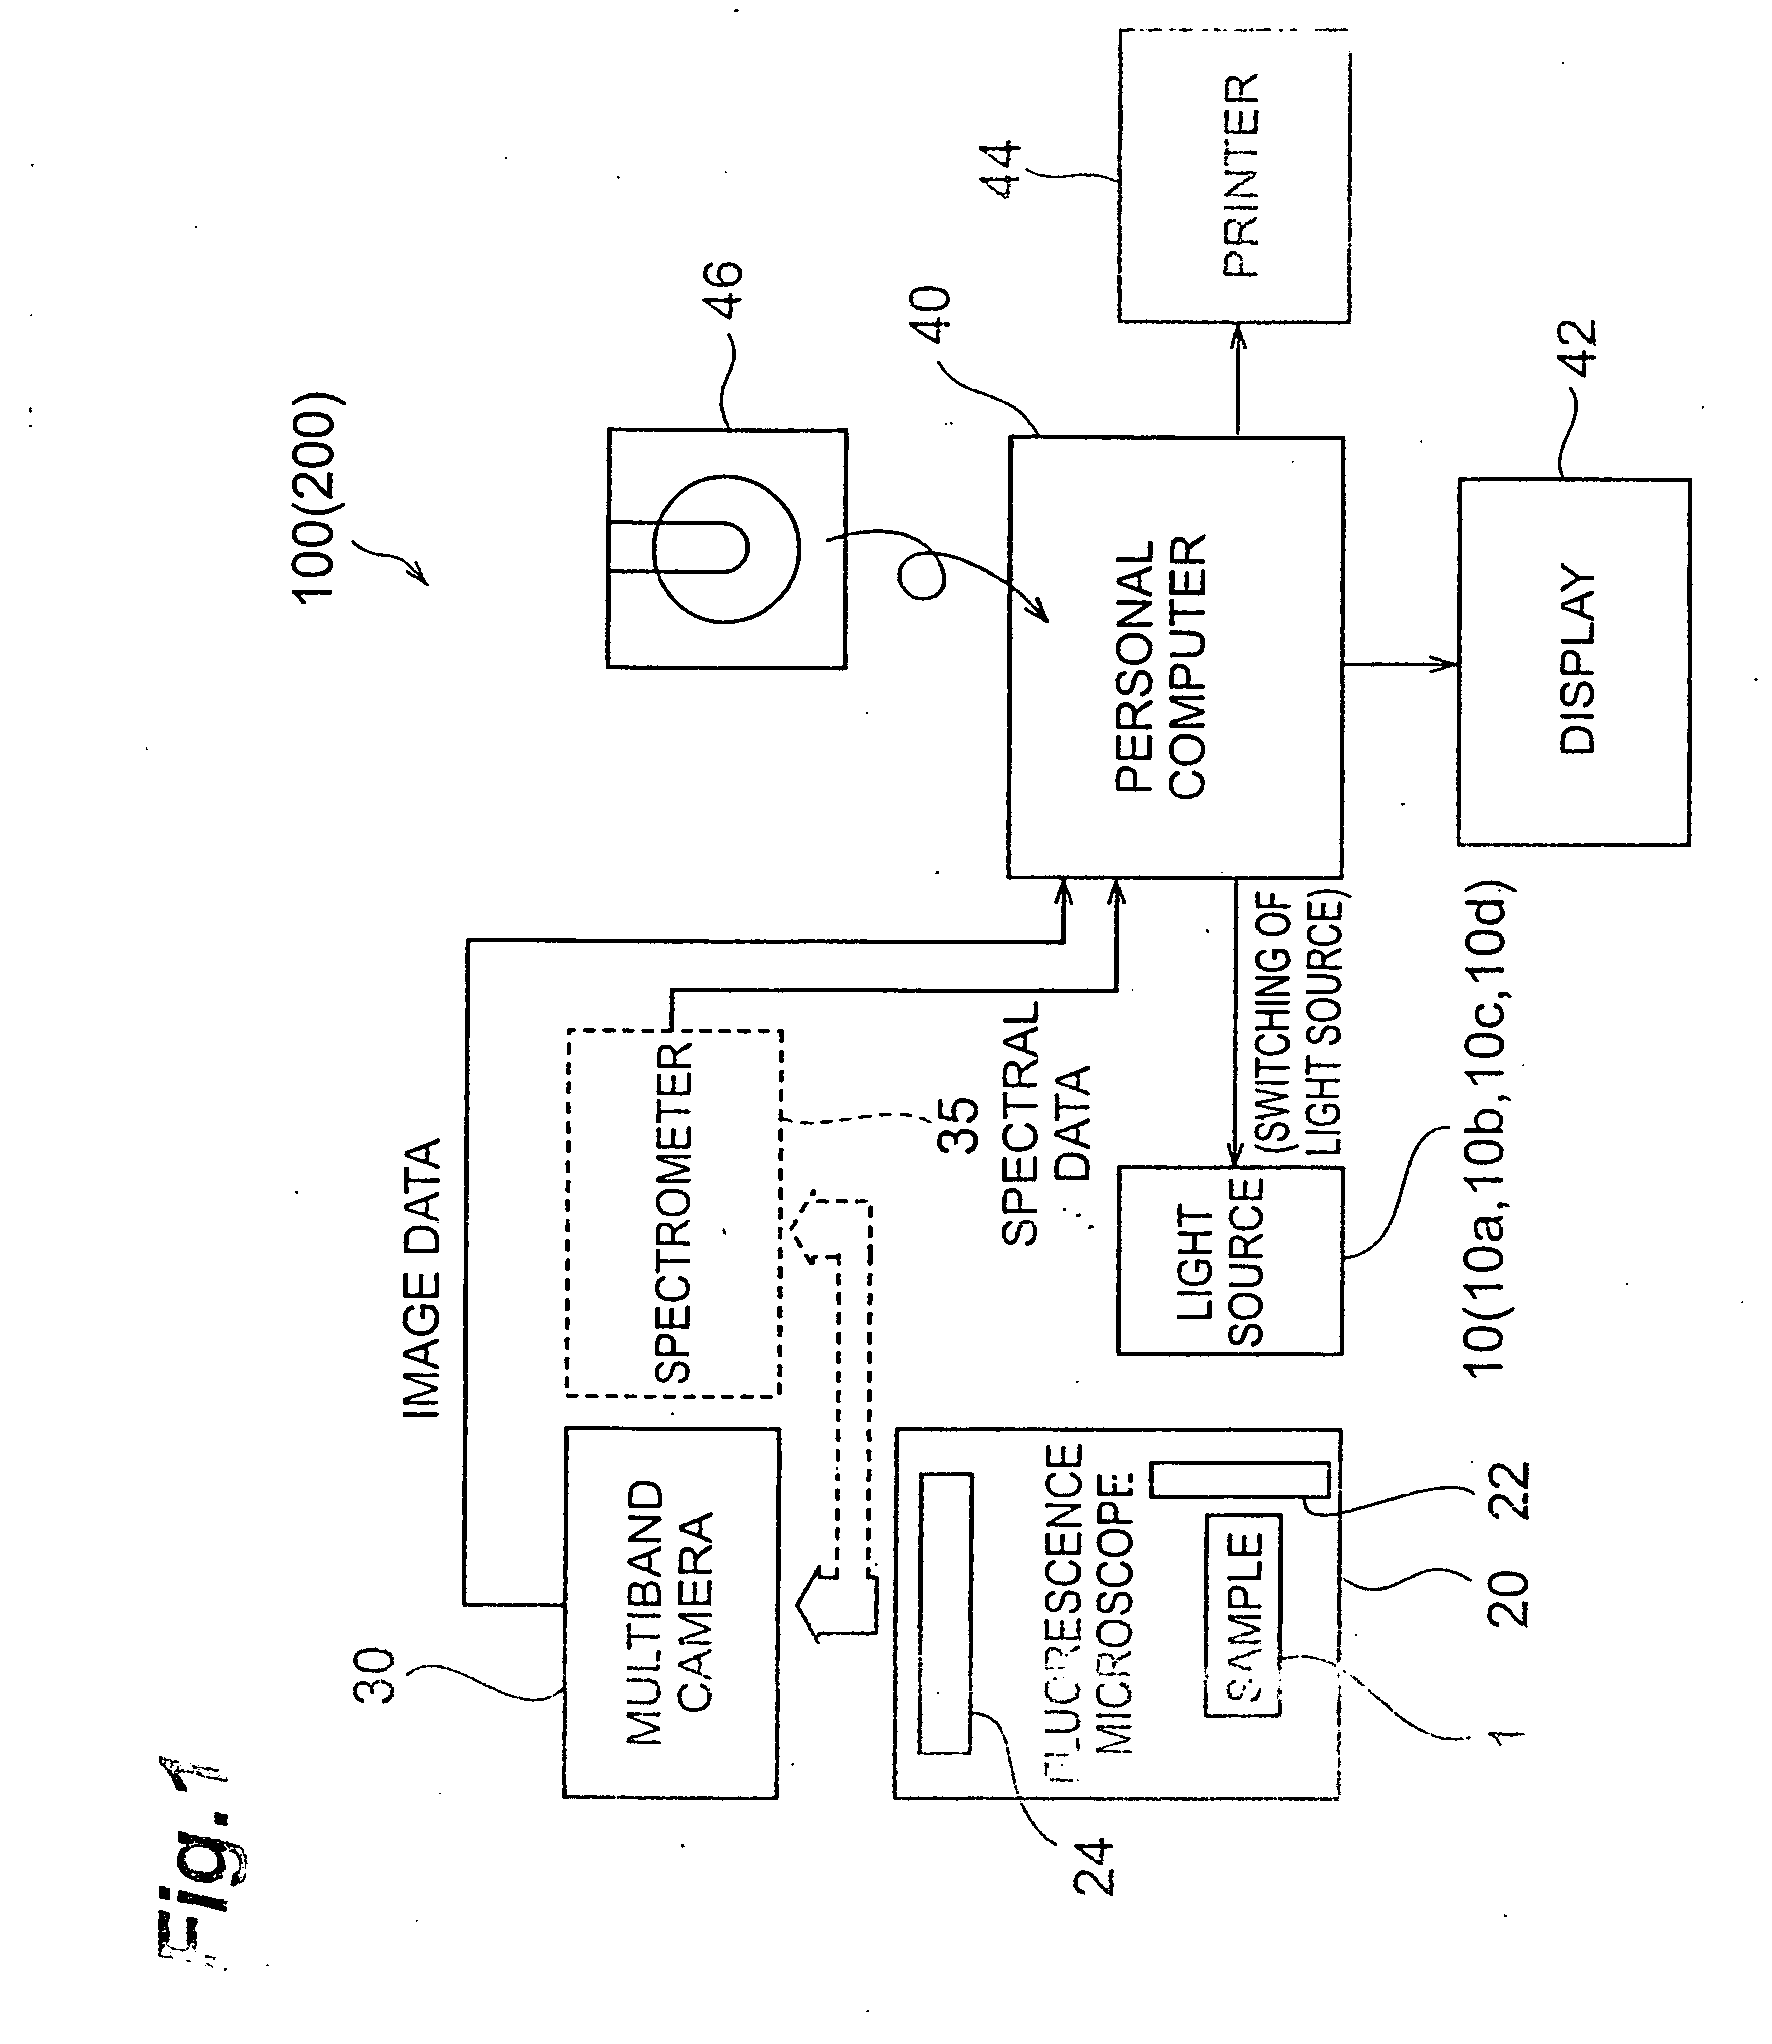
[0148] The present invention will be further described below with some examples. The Inventor conducted the measurement of fluorescent dyes by use of the measurement system 100 shown in FIG. 1 and in accordance with the method of the first embodiment. The multiband camera 30 used was the 3-CCD color camera ORCA-3CCD C7780 available from Hamamatsu Photonics K.K. FIG. 9 shows spectral sensitivity characteristics of the camera 30. As described previously, the camera 30 has the two types of sensitivity modes, the Low Light mode and the High Light mode. In FIG. 9 solid lines indicate the sensitivity characteristics in the Low Light mode, and dashed lines the characteristics in the High Light mode. In the present example the R, G, and B values in the Low Light mode were used in the measurement calculation.

[0149] The fluorescent dyes used were three types, Alexa Fluor 350, Fura2, and Cascade Yellow. The Inventor mixed two of them in appropriate concentrations to prepare three types of so...

second example

[0153] The Inventor also conducted acquisition of the basic data and target data with the use of the spectrometer 35, instead of the camera 30. The spectrometer 35 used was PMA-11 (c7473, BTCCD 200-950 nm) available from Hamamatsu Photonics K.K. The measurement of fluorescence from reference samples with the spectrometer 35 was conducted in the light source mode and under the conditions of s / n=18, Gain=Middle, and wavelength interval=1 nm. The computer 40 performed a smoothing process of 5 points (5 nm) on the spectral data acquired with the spectrometer 35.

[0154] For reference, the spectral data acquired from target samples is presented in FIGS. 10 and 11. FIG. 10 shows the spectral data acquired from target samples in which the fluorescent dyes Alexa Fluor and Cascade Yellow are mixed at various ratios. The spacing between peak wavelengths of fluorescence emitted from these dyes is relatively wide, about 110 nm. FIG. 11 shows the spectral data required from target samples in whic...

third example

[0156] The Inventor also conducted measurement of the concentrations of fluorescent dyes according to the method of the fifth embodiment. In this example, intensities of fluorescence emitted from samples and target samples were measured through the band-pass filter. Three band-pass filters were used according to the fluorescence spectra of three types of fluorescent dyes. The first band-pass filter had the center wavelength of 440 nm and the bandwidth of 21 nm. The second band-pass filter had the center wavelength of 510 nm and the bandwidth of 23 nm; The third band-pass filter had the center wavelength of 546 nm and the bandwidth of 10 nm.

[0157] Fluorescence through each band-pass filter was detected with a monochrome (B / W) camera. The monochrome camera used was the digital B / W camera ORCA-II available from Hamamatsu Photonics K.K. The acquisition of fluorescence images was conducted under the conditions of exposure of 30 msec, Gain=Low, and binning 4*4.

[0158] The computer 40 pe...


PUM


Abstract

The concentrations of fluorescent dyes in a target sample (1) are measured using an imaging device (). This imaging device has detection wavelength bands. Reference samples each containing only one of the fluorescent dyes respectively at predetermined unit concentrations, and a measured intensity of fluorescence emitted from each reference sample is measured in each detection wavelength band. A fluorescence image of the target sample is taken in each detection wavelength band using the imaging device. An operation is executed using the fluorescence intensities acquired from the reference samples and target sample to calculate the concentrations of the respective fluorescent dyes in the target sample.

Description

TECHNICAL FIELD [0001] The present invention relates to measurement of the concentrations of fluorescent dyes contained in a sample. BACKGROUND ART [0002] A method of measuring the concentration of a fluorescent dye contained in a sample is described in Gary R. Bright, “Multiparameter Imaging of Cellular Function” on pp 204-215 in “Fluorescent and Luminescent Probes for Biological Activity” edited by W. T. Mason, 1993, Academic Press, USA. This method is to extract a wavelength component necessary for excitation of a fluorescent dye, from white light by means of a dichroic filter and to illuminate a sample with the wavelength component to produce fluorescence. This fluorescence is detected through a band-pass filter and with a monochrome (black-and-white) camera, and the intensity thereof is measured. The band-pass filter is used for receiving only the wavelength component corresponding to the fluorescent dye in the sample, with the camera. Since the intensity of the fluorescence em...

Claims


Application Information

Patent Timeline
IPC IPC(8): G01N21/64G01N21/27
CPCG01N21/274G01N21/6428G01N21/6458G01N2021/6419G01N2021/6421G01N2021/6423G01N2021/6441G01N2021/6471
Inventor MATSUMOTO, KAZUJIHIRANO, MASAHIKOHARA, MASAHIRO
Owner HAMAMATSU PHOTONICS KK
Why Eureka
Try Eureka