Method For Evaluating Sedimentary Basin Properties By Numerical Modeling Of Sedimentation Processes
a numerical modeling and sedimentation technology, applied in seismology for waterlogging, instruments, reradiation, etc., can solve the problems of insufficient resolution or spatial coverage of available data, general non-replicating geologic structures observed in natural systems, and complicated application
- Summary
- Abstract
- Description
- Claims
- Application Information
AI Technical Summary
Problems solved by technology
Method used
Image
Examples
embodiments
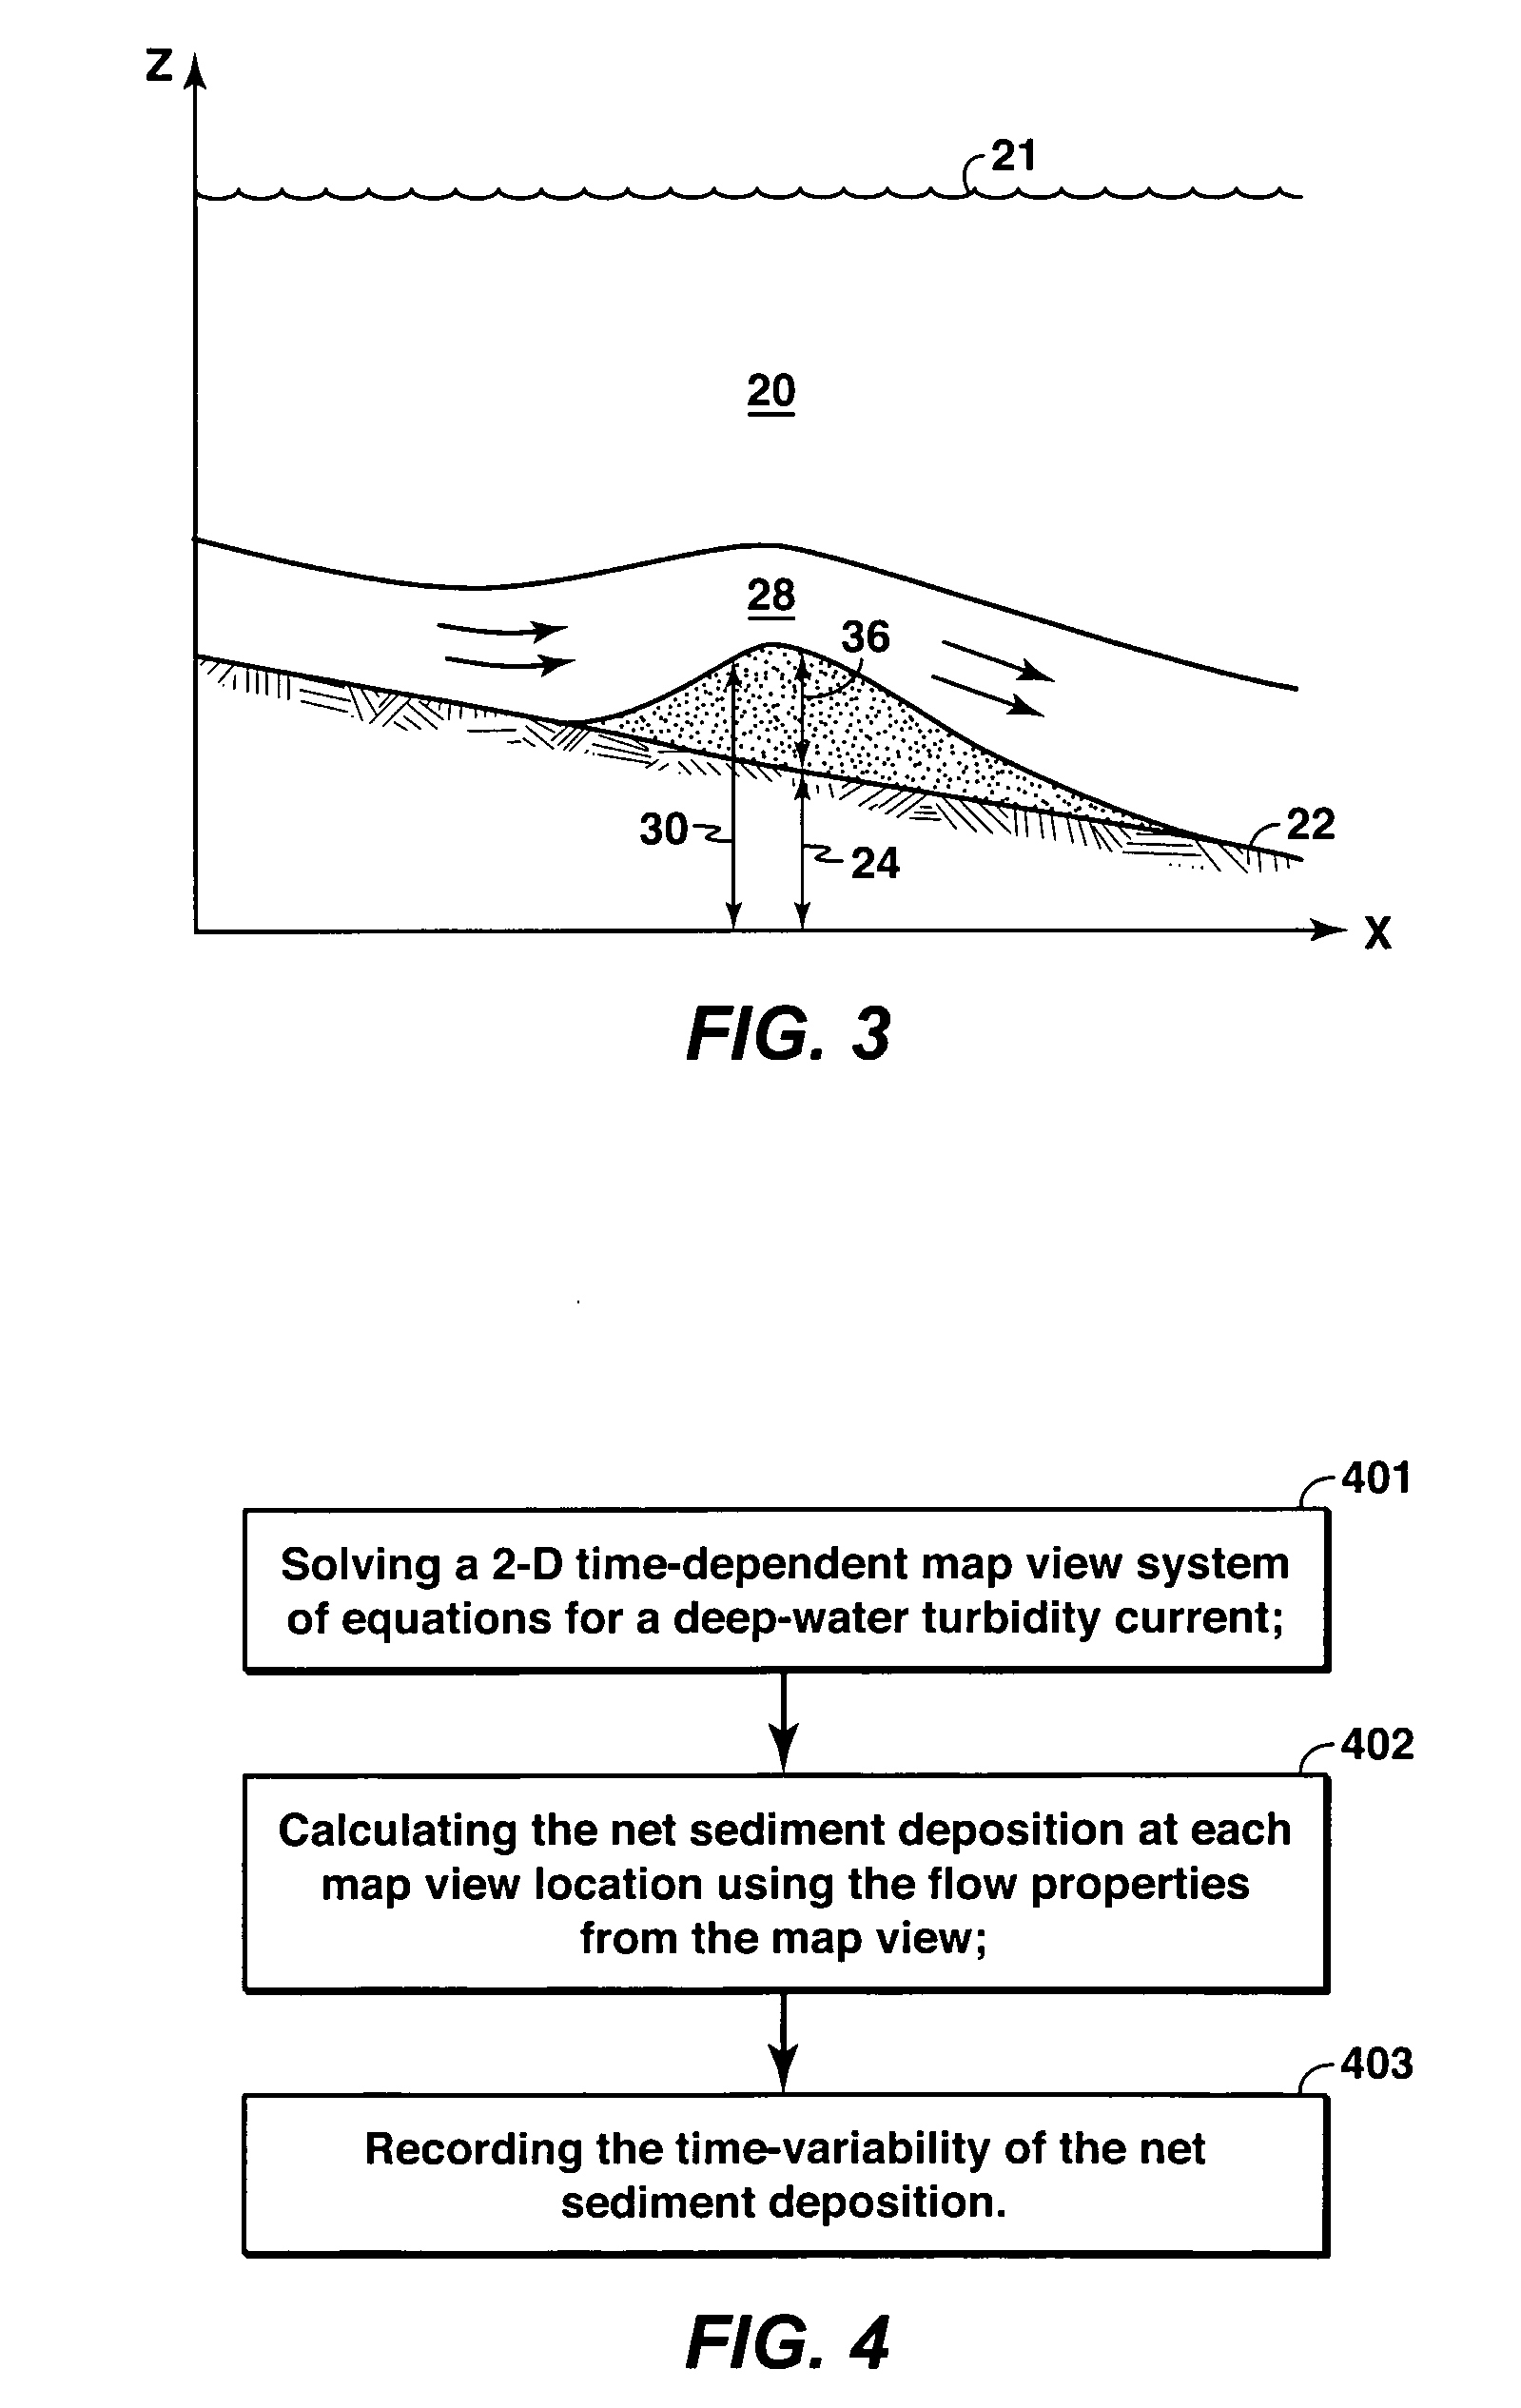
[0086] A first embodiment of the invention will now be described. With reference to FIG. 4, this embodiment is a method for simulating the formation of sedimentary systems. As illustrated in FIG. 4, this embodiment involves solving a two-dimensional time-dependent map view system of equations for the flow of sediment-laden water (step 401), calculating net sediment deposition at each map view location using the flow properties of the two-dimensional map view system of equations (step 402), recording the net sediment deposition as it varies with time and spatial location (step 403), and repeating, if necessary, steps 401-403 for each time step until the time duration of the simulation is complete. The individual steps will be described in greater detail in the following paragraphs.
[0087] In one embodiment, step 401 involves determining the properties of the turbidity flow by solving a two-dimensional time-dependent map view system of equations, where the flow properties described by...
example
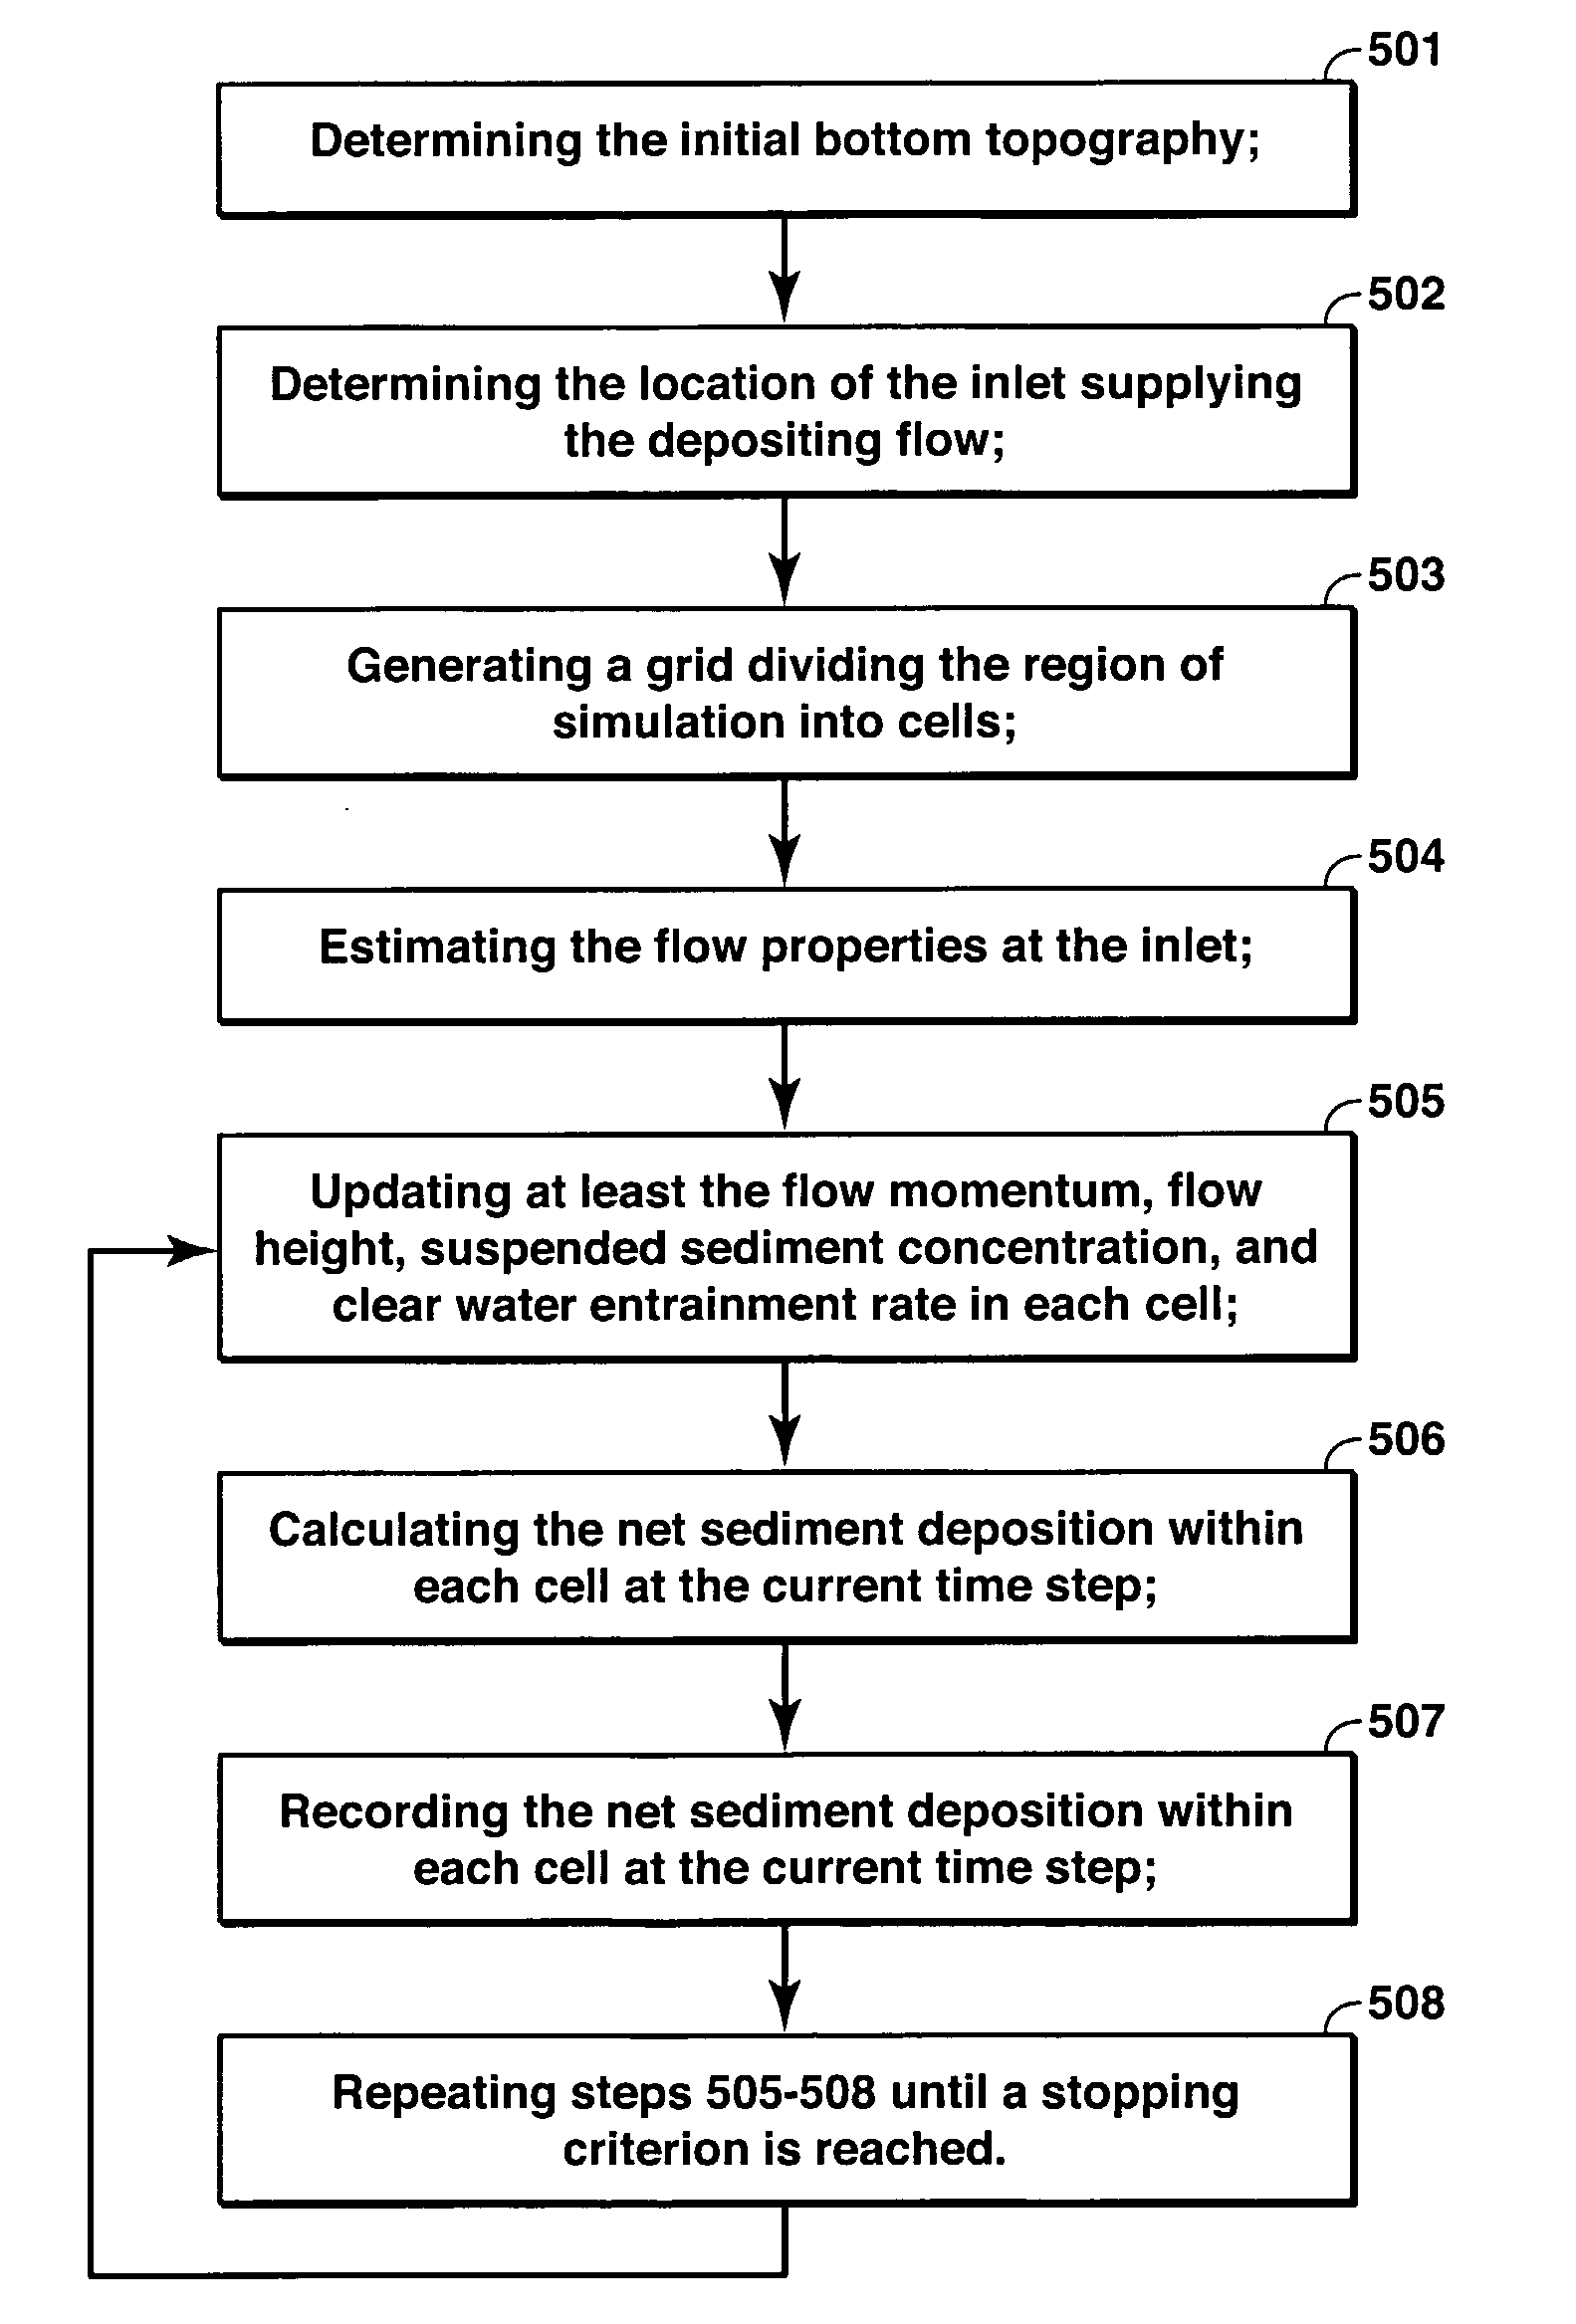
[0107] A hypothetical example of an embodiment of the inventive method will now be discussed. FIG. 6 shows a three-dimensional initial bottom surface 61 synthesized for this example, as specified in step 501 of FIG. 5. Typically, the initial bottom surface 61 would be an interpreted stratigraphic surface obtained from seismic data. The initial bottom surface could also be obtained from well log data, core data, and / or outcrop studies.
[0108] After the initial bottom surface is determined, the inlet location is determined (step 502 of FIG. 5), a grid is created (step 503), the inlet properties are estimated (step 504), and the process of repeating steps 505-507 begins. FIG. 7 is a map view of the simulation in progress, specifically showing the magnitude of the flow velocity (grayscale). Lighter shades indicates faster flow velocities and darker shades indicate slower flow velocities. The inlet 73, as chosen in step 502, is at the top center of the figure. The grid 71, as chosen in s...
PUM
 Abstract
Description
Claims
Application Information
 - R&D
- Intellectual Property
- Life Sciences
- Materials
- Tech Scout
- Unparalleled Data Quality
- Higher Quality Content
- 60% Fewer Hallucinations
Browse by: Latest US Patents, China's latest patents, Technical Efficacy Thesaurus, Application Domain, Technology Topic, Popular Technical Reports.
© 2025 PatSnap. All rights reserved.Legal|Privacy policy|Modern Slavery Act Transparency Statement|Sitemap|About US| Contact US: help@patsnap.com


