
Method of Differentiating Between Blood and Control Solutions Containing a Common Analyte

Active Publication Date: 2008-06-19
ASCENSIA DIABETES CARE HLDG AG
View PDF46 Cites 18 Cited by
  • Summary
  • Abstract
  • Description
  • Claims
  • Application Information

AI Technical Summary

Benefits of technology

[0009]The invention distinguishes between analytes in biological fluids, particularly glucose in whole or lysed blood, and the analyte in control solutions used to test the performance of an optical instrument. The control solution contains a label, i.e. a substance not found in the normal biological sample, which is recognized by the optical instrument as identifying the control solution. In one example, the optical instrument employs an LED emitting light with a wavelength in the range of from about 600 to about 800 nm corresponding to a characteristic wavelength absorbed by the identifying substance. Preferably, the labeling substance is a dye or a member of the group of water soluble dyes or dyes that can be made water soluble upon addition of surfactants or the like. Typically, the peak absorbance of the dye is within a narrow spectral range that is readily identified as associated with the control solution.
[0010]In one aspect, the invention is a method of distinguishing between measurements made of glucose in blood samples and glucose in control solutions. A label substance is added to the control solution, which is recognized by th

Problems solved by technology

Also, the composition should not respond to the light used to illuminate a sample in a way that interferes with the reading of the color developed by reaction of the glucose content with the reagents.
A problem arising in certain instruments relates to the need to distinguish between measurements made with blood samples and those made with control solutions, which are frequently used to assure that the test equipment is performing correctly.
If the control solution is formulated to respond in a manner similar to that of a whole blood sample, the instrument does not recognize that a control solution is being tested rather than a blood sample.
Of course, that could be done manually by the user, but through inadvertence the glucose history could be distorted.

Method used


Image

  • Method of Differentiating Between Blood and Control Solutions Containing a Common Analyte
  • Method of Differentiating Between Blood and Control Solutions Containing a Common Analyte
  • Method of Differentiating Between Blood and Control Solutions Containing a Common Analyte

Examples


example 1

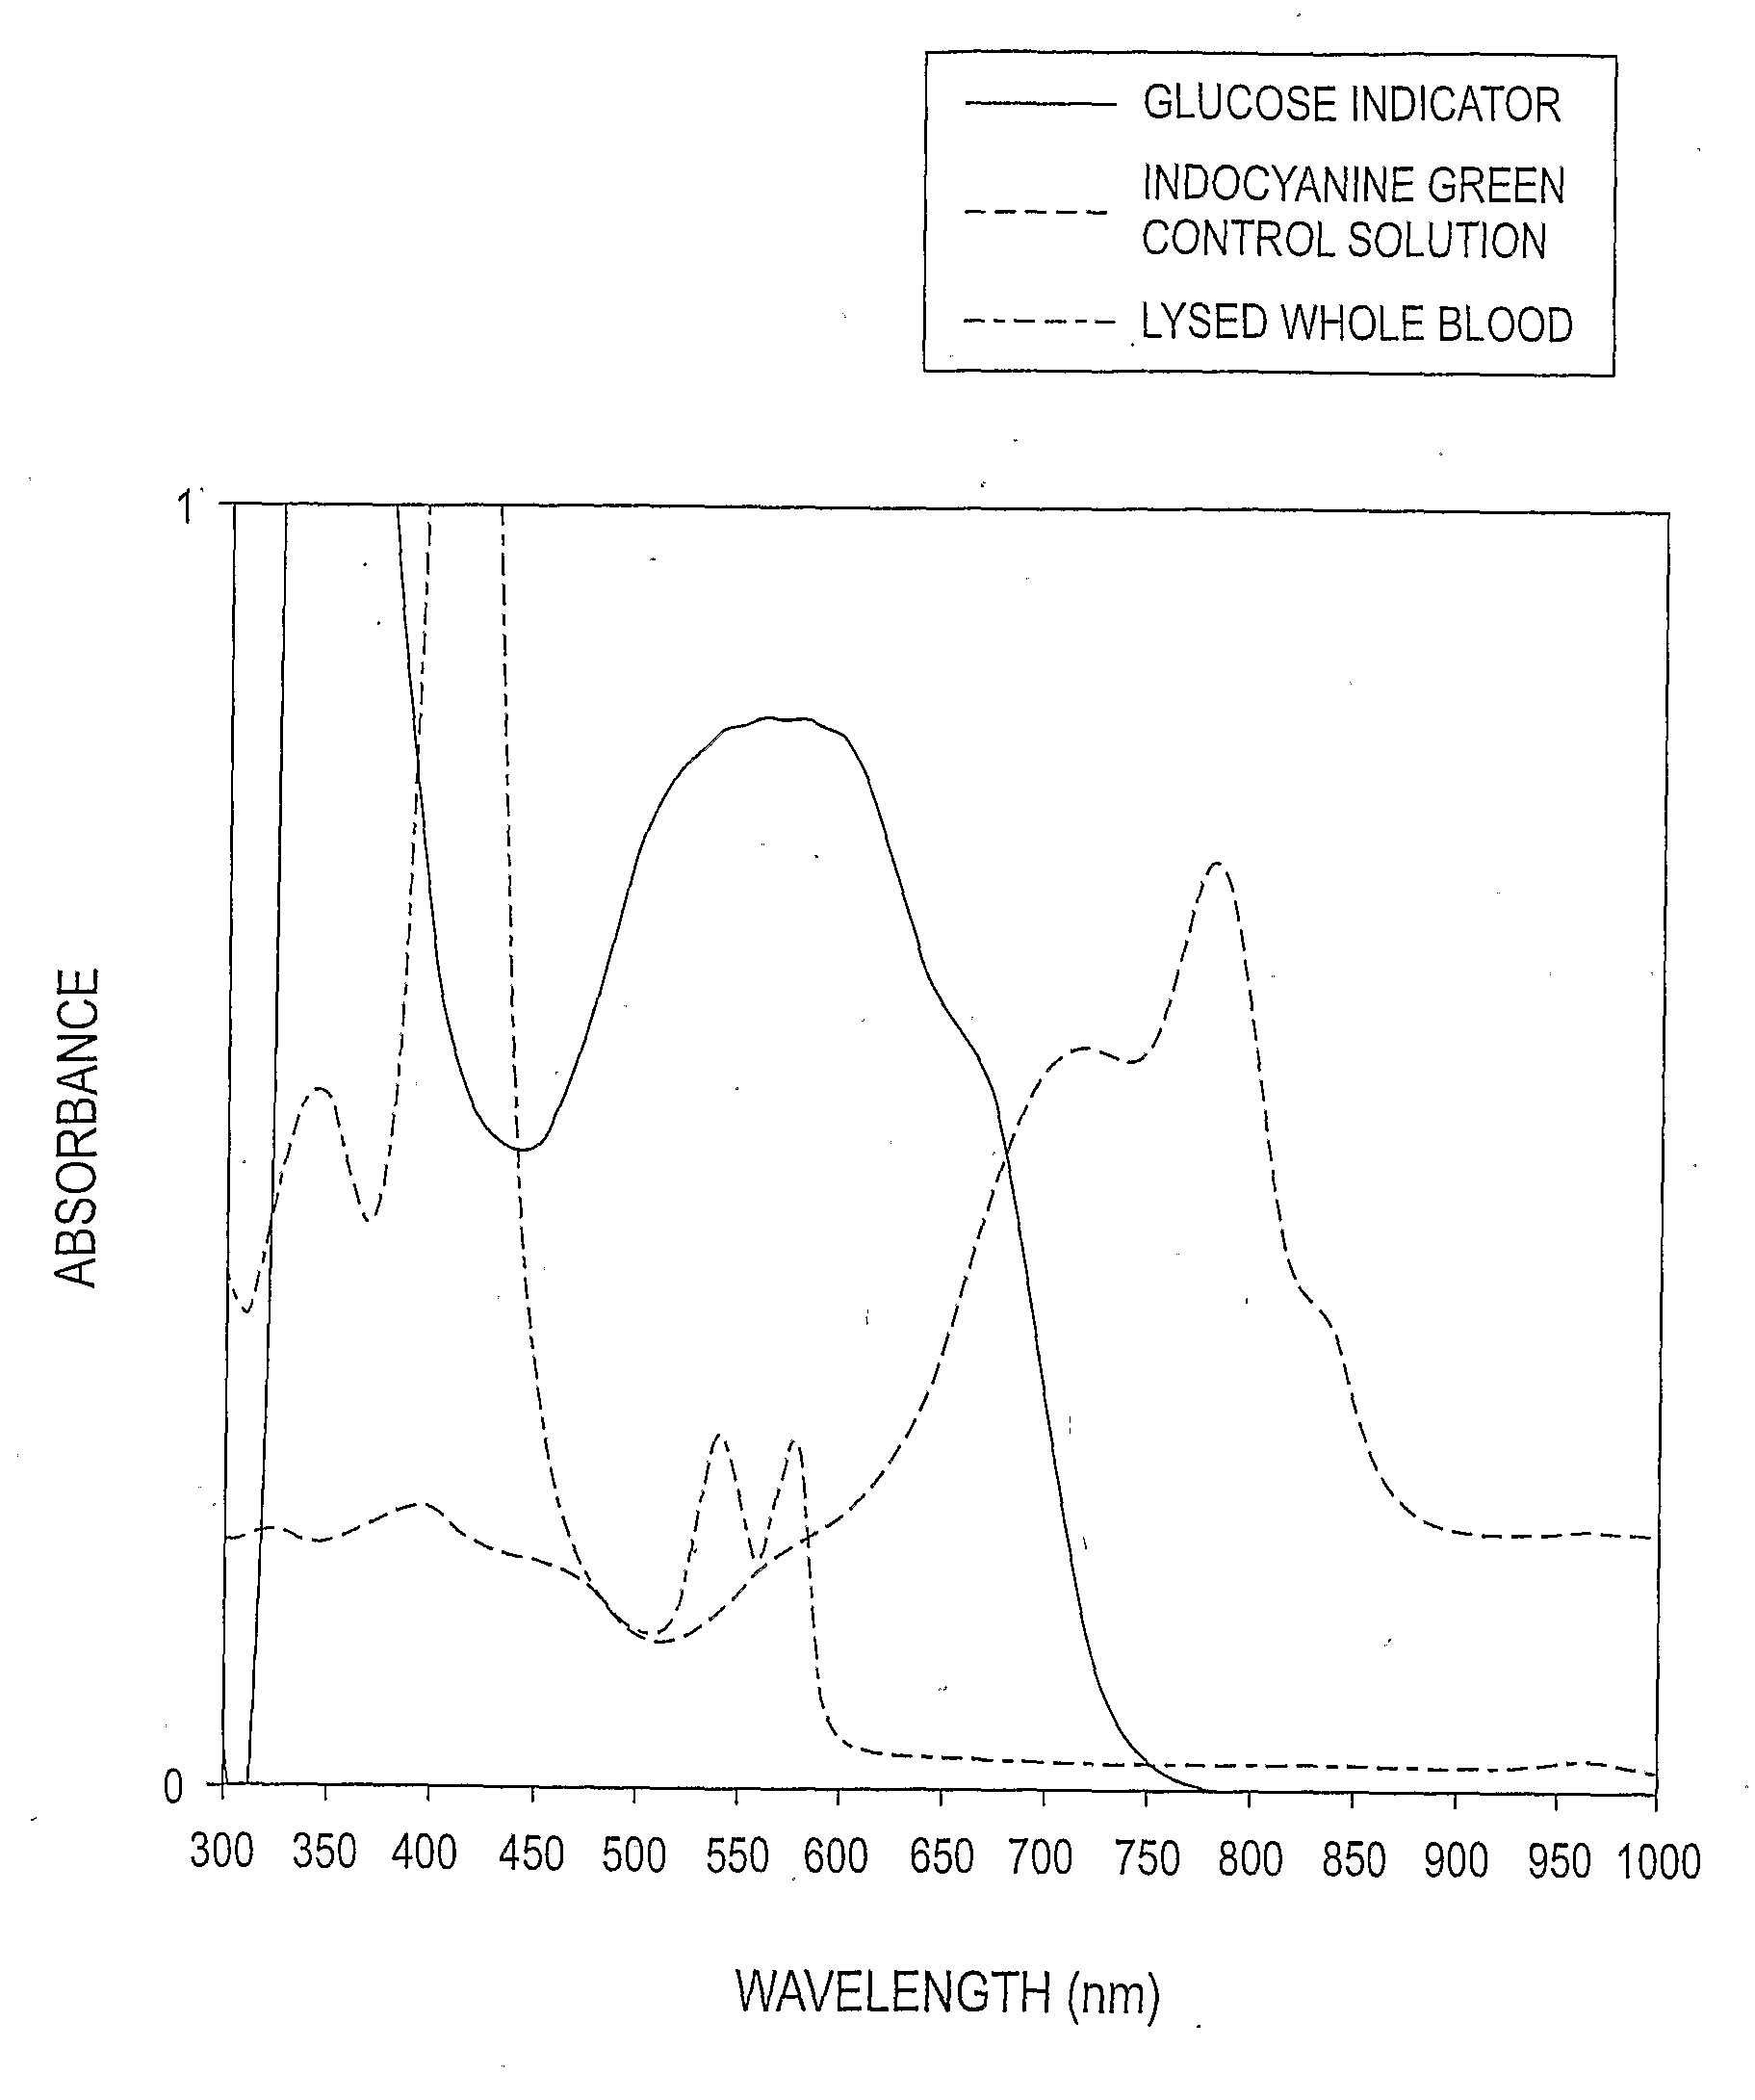
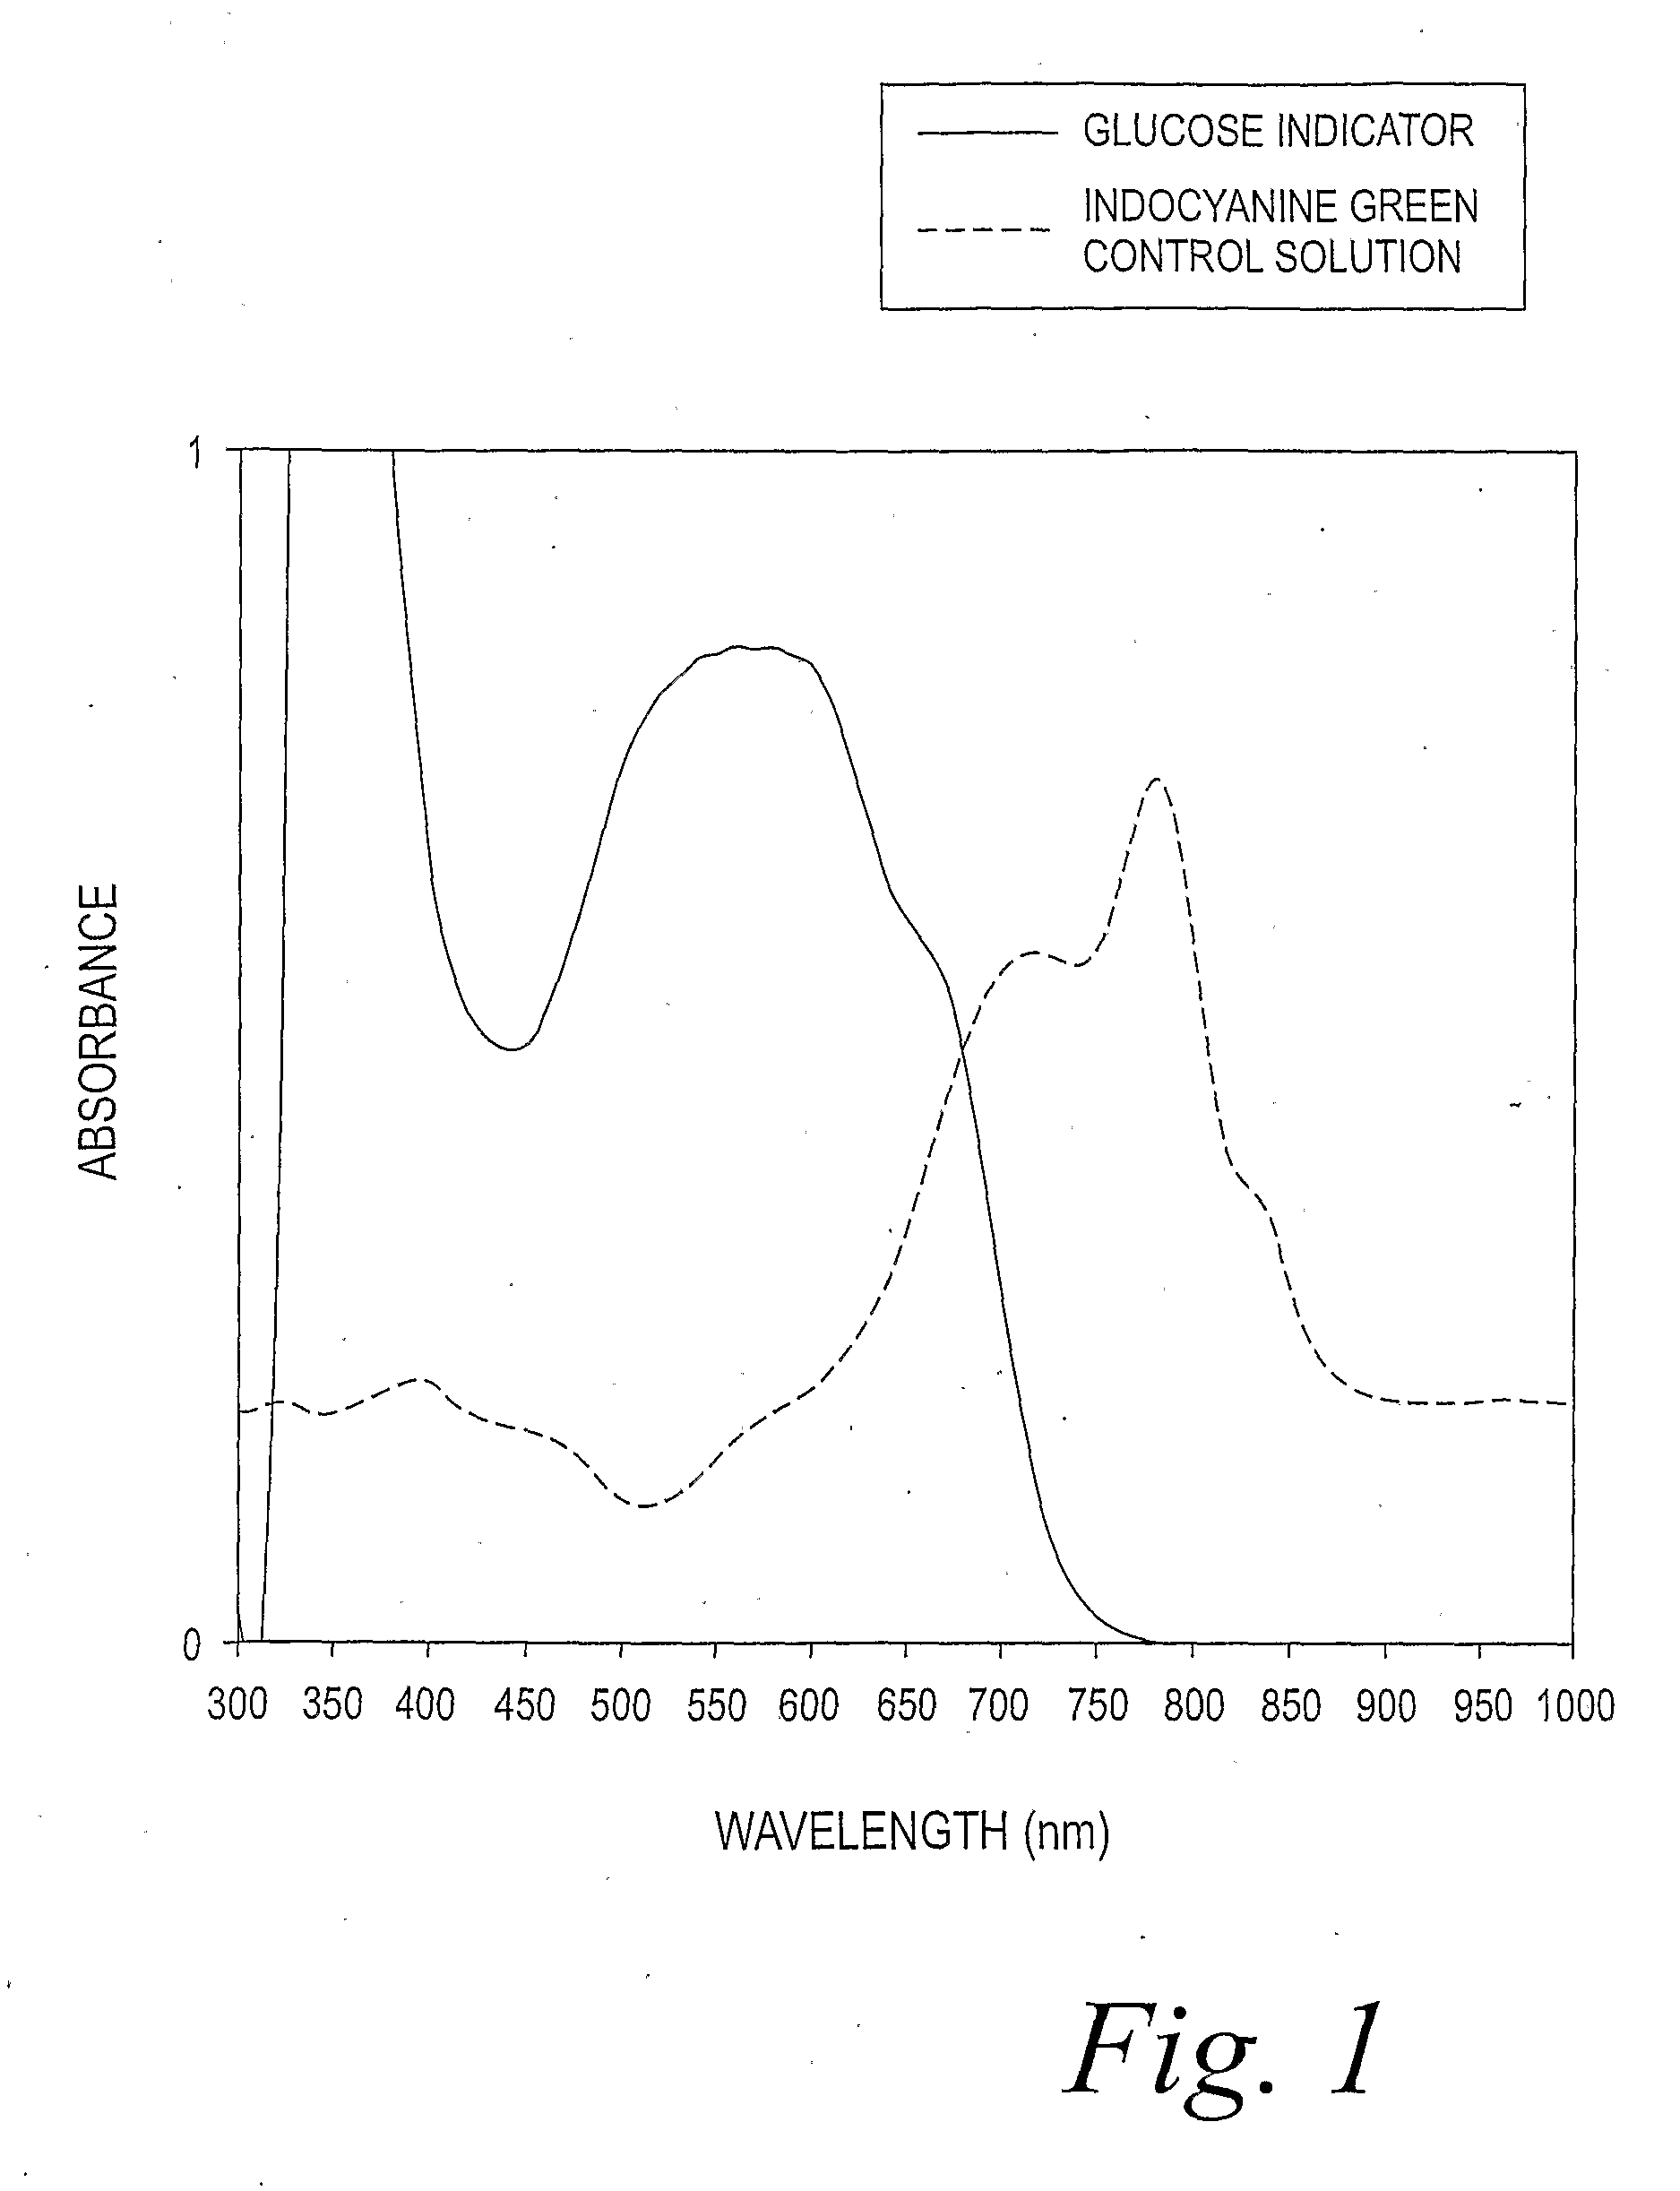
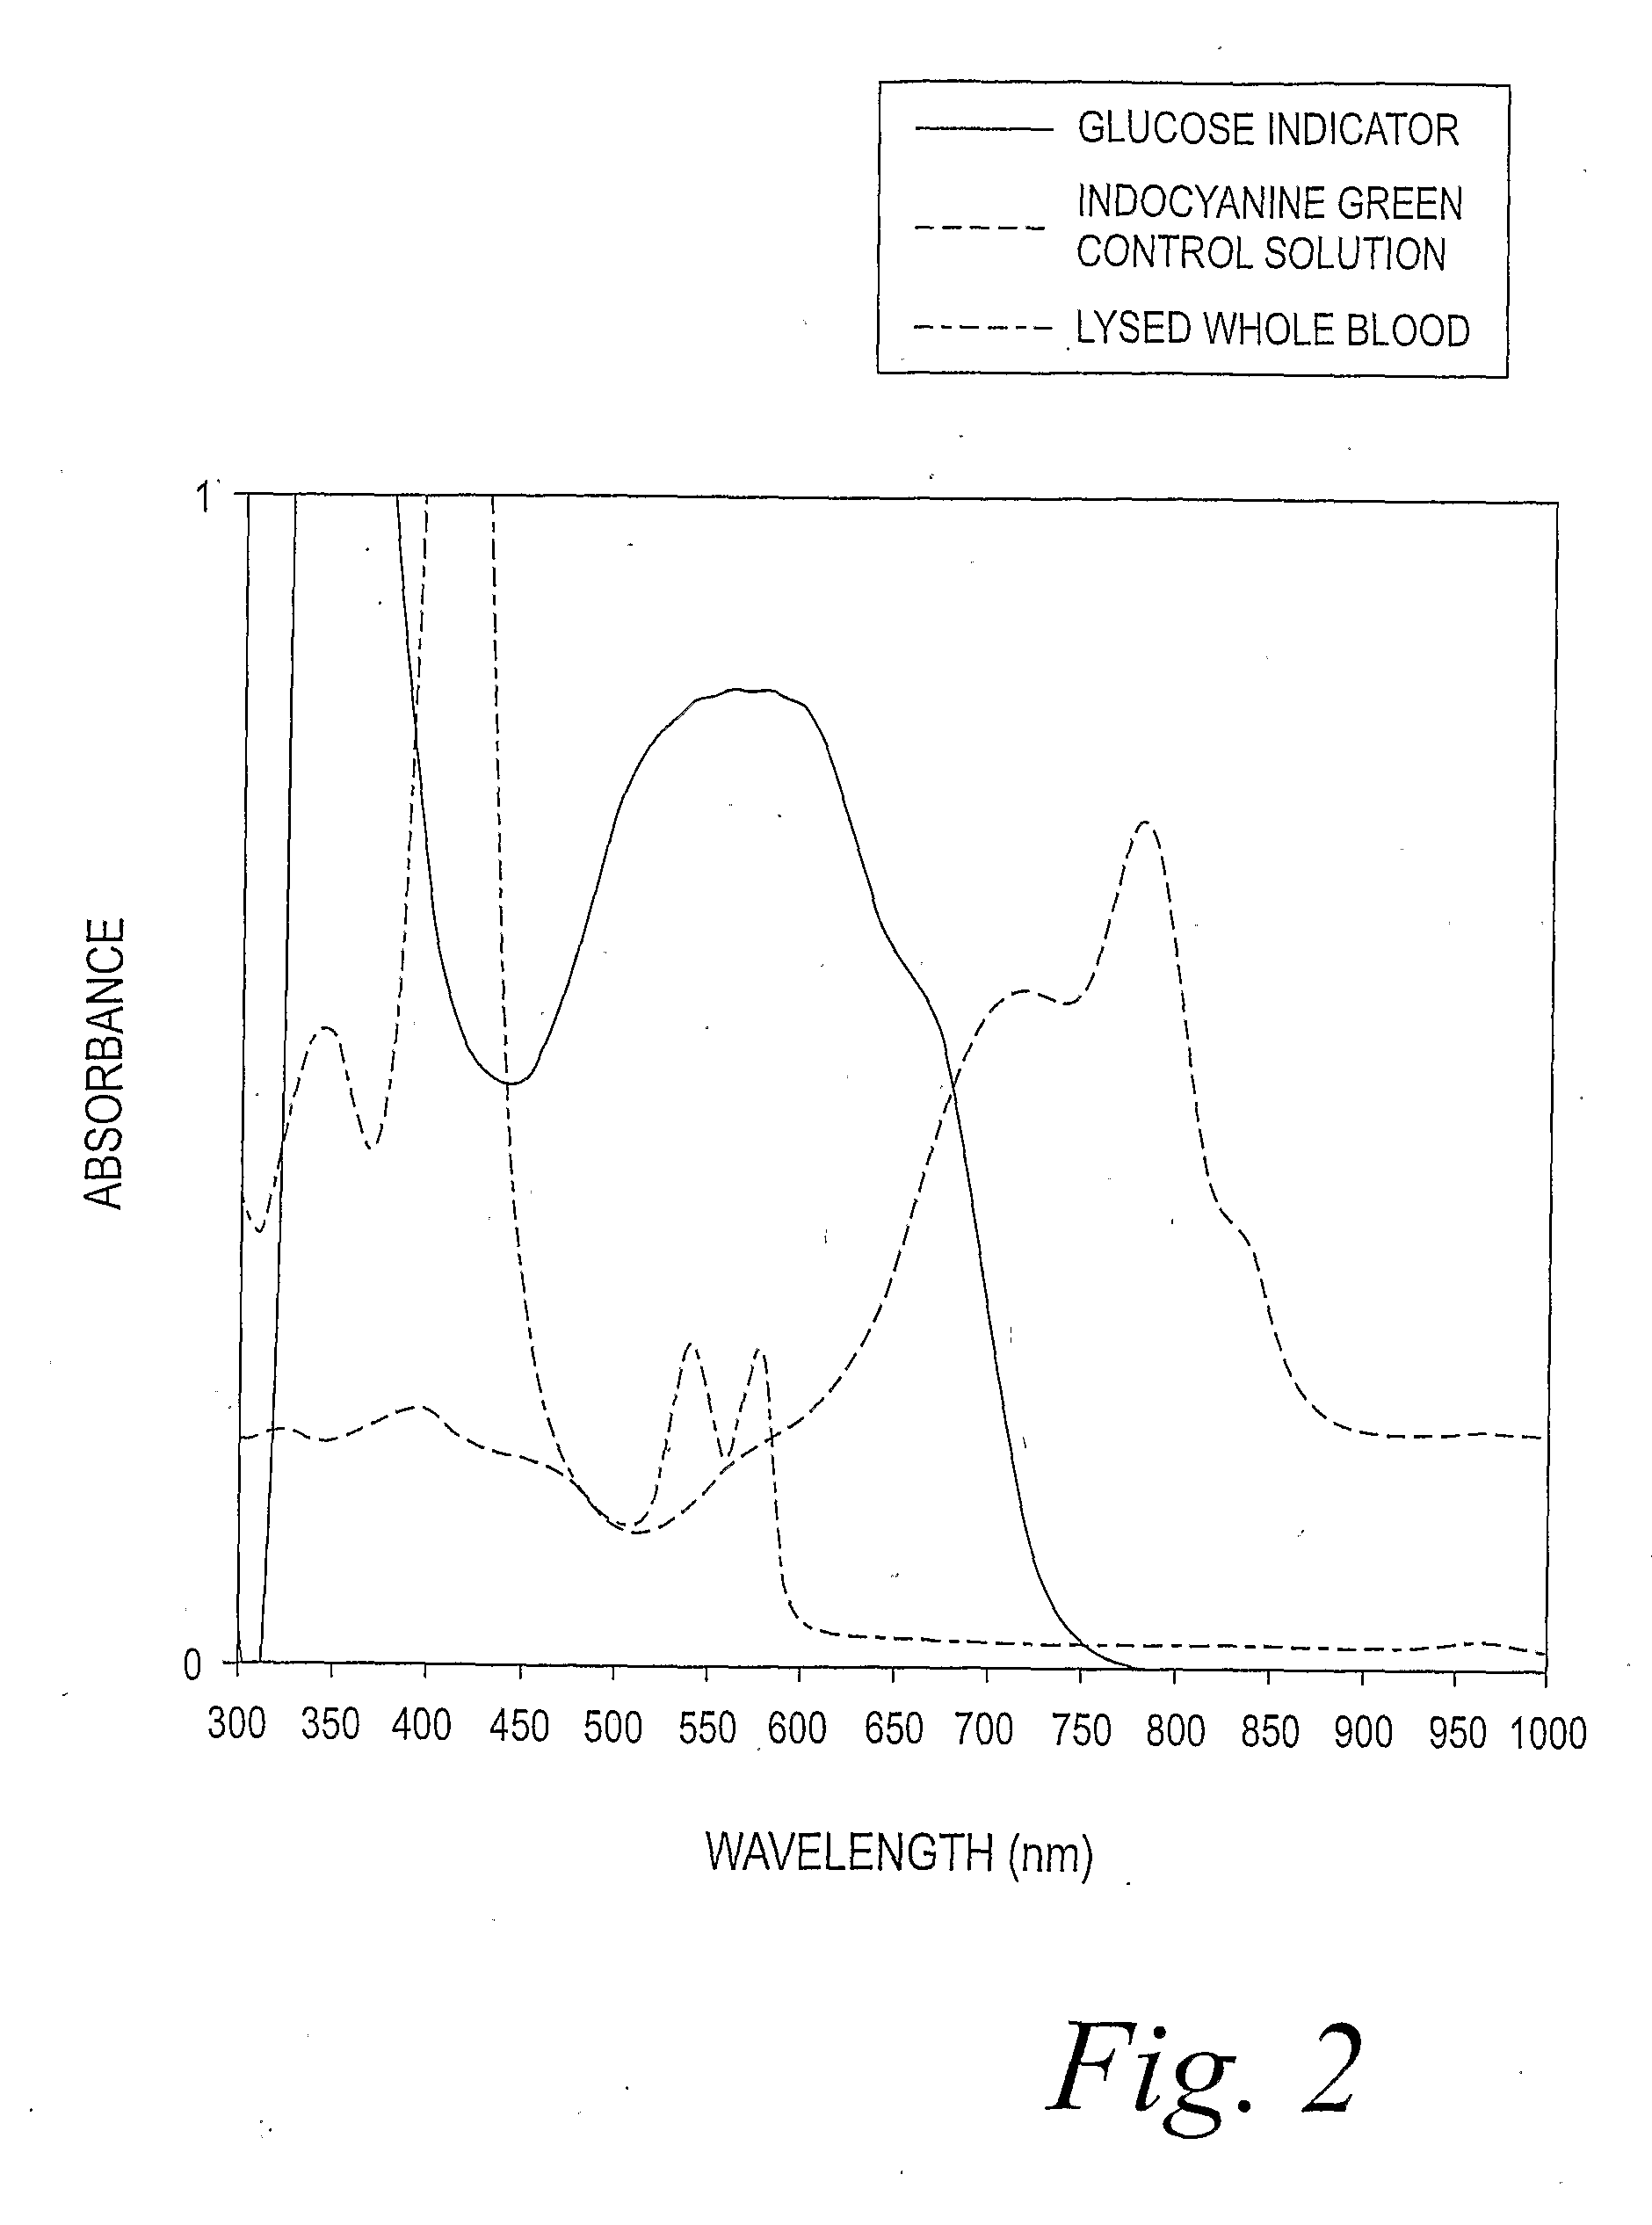
[0026]The dye indocyanine green (Sigma Aldrich) was dissolved in a phosphate-buffered saline solution. The absorbance spectra of this solution was measured with a Hewlett-Packard Model 8453 diode-array UV-visible spectrophotometer and the results were plotted in FIG. 1. As shown in FIG. 1, the maximum absorbance was found to be at about 780 nm.

[0027]A commercially available tetrazolium salt, WST-4 (Dojindo) was dissolved in 100 millimolar potassium phosphate buffer having a pH of about 7.5. The WST-4 was reduced to the equivalent formazan dye by addition of ascorbic acid, thus simulating the production of a colored indicator in glucose tests. The solution was measured and the results were plotted in FIG. 1 for comparison with the absorbance spectra of the dye indocyanine green. The peak of the absorbance of the formazan was about 550-600 nm, clearly being distinguished from the absorbance of the dye.

example 2

[0028]Whole blood was lysed with a hypotonic solution of water and then diluted in phosphate buffered saline. The absorbance of the lysed blood was measured as in Example 1 and the results plotted in FIG. 2 along with the two absorbance plots of FIG. 1. The maximum absorbance of the lysed blood was about 400 nm, a wavelength clearly distinguished from those of the formazan and indocyanine green. It can be concluded that if blood is lysed as part of a glucose test, that it will not interfere with the labeling dye that indicates the presence of a control solution.

embodiment a

Alternative Embodiment A

[0029]A control solution for testing the performance of an optical instrument adapted to measure the concentration of glucose in blood in proportion to the optical response of an indicator, the solution comprising a labeling substance recognized by the optical instrument as identifying the presence of the control solution.


PUM

PropertyMeasurementUnit
Concentrationaaaaaaaaaa
Absorbanceaaaaaaaaaa
Wavelengthaaaaaaaaaa

Abstract

Glucose measured in blood samples is distinguished from glucose measured in the control solutions used to test the optical instruments which make such measurements. The control solutions contain a labeling substance recognized by the optical instrument to distinguish glucose measurements made of control solutions from those made of blood samples.

Description

BACKGROUND OF THE INVENTION[0001]This invention relates generally to measuring analytes in biological fluids, such as whole blood samples, using optical instruments. Such instruments normally will be tested using solutions that mimic the usual biological sample and contain a known amount of the analyte. The present invention is concerned with identifying a sample as a test solution, commonly called a control solution. More particularly, the invention relates to preventing optical instruments from including in their retained history of measurements those made of the analyte in control solutions. That is, avoiding errors that may occur when the retained history does not accurately report the content of samples previously measured, but includes the results obtained with control solutions.[0002]The quantitative determination of analytes in biological fluids is of great importance in diagnosing and treating medical problems, such as measuring the glucose level in biological fluids, which...

Claims


Application Information

Patent Timeline
IPC IPC(8): C12Q1/54C12M1/00
CPCG01N33/66G01N33/96Y10T436/144444Y10T436/110833Y10T436/10G01N1/28
Inventor MARFURT, KAREN L.
Owner ASCENSIA DIABETES CARE HLDG AG
Learn More