
Method of Processing Mass Spectrometry Data

a mass spectrometry and data technology, applied in the field of mass spectrometry data processing, can solve the problems of large amount of memory required for storage, affecting the skill of operators, and unable for users or software to re-evaluate data for further characteristics such as peak shape, background, signal-to-noise ratio or other, so as to reduce the amount of noise data

Active Publication Date: 2008-10-30
THERMO FINNIGAN
View PDF10 Cites 23 Cited by
  • Summary
  • Abstract
  • Description
  • Claims
  • Application Information

AI Technical Summary

Benefits of technology

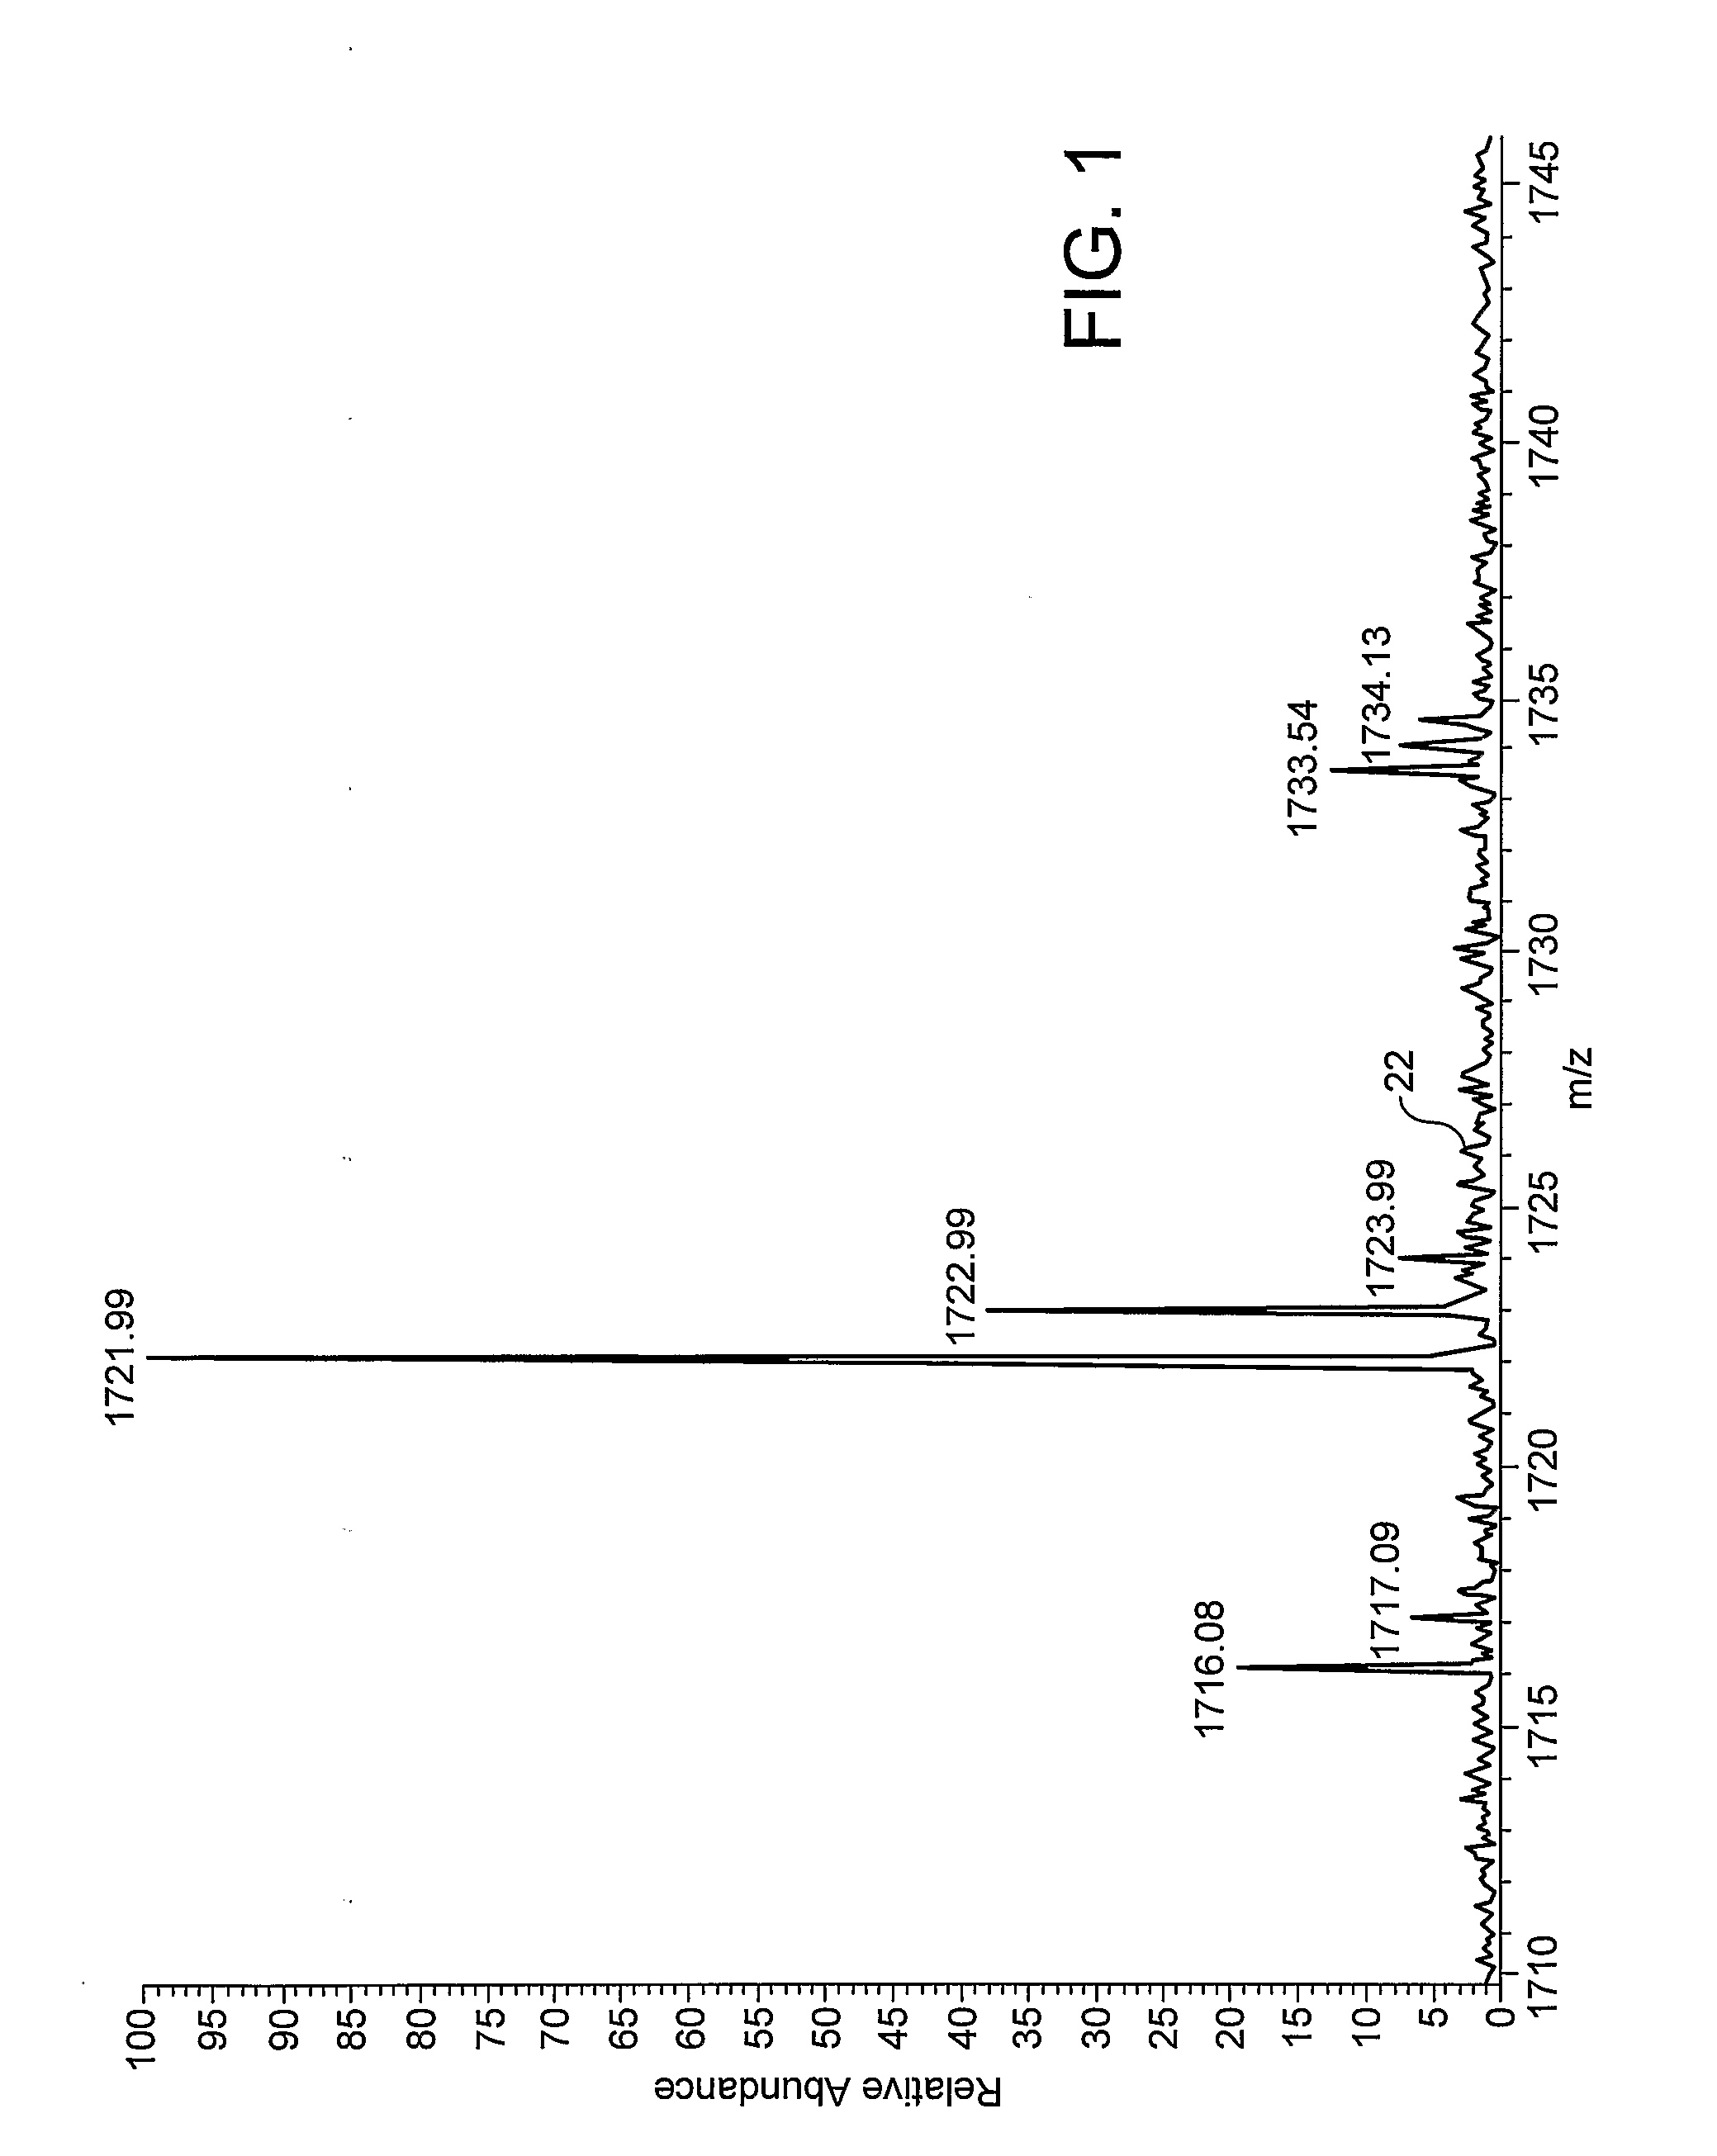
[0010]By transforming only a fraction of a full FTMS data set in the time domain into the frequency domain, a relatively small number of false peaks will be located at a given threshold because of the reduced resolution. Once the peaks which extend above the threshold have been identified (in preference, the location of such peaks), the full data set may be transformed but only the data around the locations previously identified at the lower resolution need be analysed and / or saved. In other words, the problem of the larger number of false peaks that would be found if the threshold were just applied to the full data set in the frequency domain is avoided, because the false peaks can be ignored as a result of the prior threshold application at the lower resolution.
[0016]Methods of discriminating peaks in larger molecules, where numerous isotope peaks occur, are also disclosed, which rely upon two thresholds. It will also be understood that the methods disclosed are not simply advantageous because they permit data compression (i.e. by reducing the amount of noise data which may be stored). The correlation approach in particular allows the detection of low intensity “real” peaks even where these appear in a full spectrum, to be of lower intensity than the noise floor.

Problems solved by technology

Typically, these spectra are stored in a computer memory or an alternative computer readable medium and a large amount of memory is thus required for storage.
This method has the disadvantage that it is impossible for a user or software to re-evaluate data for further characteristics such as peak shape, background, signal-to-noise ratio or other information that cannot be generated without additional assumptions.
However, this method has the disadvantage that it relies upon the skill of an operator to set the threshold level correctly.
If the threshold level is set too low, typically a large quantity of noise data points will be stored along with peak data points and, if the threshold is set too high, valuable information relating to peak shape will be lost as data points of the base of peaks will be missed.
Accordingly, such software is difficult for anyone other than an experienced operator to use successfully.
In addition, no information relating to noise is stored such that all such information is lost.
Whilst the techniques described in the Hanna articles allow a better estimate of a suitable noise threshold to be achieved, they do still suffer from several drawbacks.
Firstly, the techniques only result in the determination of peak locations and their intensity, and the valuable information regarding both the peak shape and the spectral noise are lost.
Secondly, the techniques are computationally relatively expensive, since, to obtain the parameters of the noise distribution, several iterations are necessary until these parameters stabilise.

Method used


Image

  • Method of Processing Mass Spectrometry Data
  • Method of Processing Mass Spectrometry Data
  • Method of Processing Mass Spectrometry Data

Examples


Embodiment Construction

[0037]In Fourier transform ion cyclotron resonance mass spectrometry (FTMS), as is well known, ions are generated at an ion source and are injected into a measurement cell, usually from a storage device such as a linear ion trap. Application of an homogeneous magnetic field and an rf electric (excitation) field to ions held in the cell cause them to orbit at a cyclotron frequency in that cell. The ions are detected by image currents in detection electrodes in the cell.

[0038]The raw data which is obtained by this technique is in the time domain and is known as a transient. Once the transient has been obtained, in a prior art FTMS, a mass spectrum is obtained by the following technique. Firstly, the transient is apodised and zero filled. Next, a Fourier Transform of the data into the frequency domain is carried out. This provides a complex frequency spectrum which consists of pairs of values made up of a real and an imaginary part. After that, a magnitude spectrum is obtained point by...


PUM


Abstract

A method of processing Fourier Transform Mass Spectrometry (FTMS) data comprises carrying out a Fourier Trans-form of a part of a time domain transient and identifying from that transformed data signal peaks representative of the presence of ions. Once the peaks have been identified, the full transient is then transformed, and the peaks identified in the partial transient transform are used to locate true peaks in the transformed full transient. The number of ‘false’ peaks resulting from random noise has been found to correlate to the resolution, so that using a partial transient to identify true peaks reduces the risk of false peaks being included; nevertheless this information can then be applied to the full data set when transformed. As an alternative, different parts of the full data set can be transformed and then correlated; because any noise will be random, false peaks should occur at different places in the two partial transforms.

Description

BACKGROUND OF THE INVENTION[0001]This invention relates to a method of processing mass spectrometry data, particularly but not exclusively data obtained from Fourier Transform Ion Cyclotron Resonance Mass Spectrometry (FTMS).[0002]Spectrometry in general, and mass spectrometry in particular, produces extremely rich data sets. This is especially true for high-resolution mass spectrometry data such as those obtained using double focussing magnetic sector mass spectrometry, time-of-flight mass spectrometry and Fourier transform mass spectrometry (FTMS). For example, a standard acquisition from m / z 200-2000 in FTMS involves the measurement of one million data points. Measuring one scan per second (typical for liquid chromatography / mass spectrometry (LC / MS) applications) results in the generation of raw data at a rate of 7.2 GB / hour (approximately 170 GB / day).[0003]Typically, these spectra are stored in a computer memory or an alternative computer readable medium and a large amount of me...

Claims


Application Information

Patent Timeline
IPC IPC(8): G06F15/00G06K9/00H01J49/38
CPCG06K9/00523H01J49/38H01J49/0036G06F2218/08G16Z99/00H01J49/02
Inventor LANGE, OLIVERSENKO, MICHAEL W.
Owner THERMO FINNIGAN
Learn More