
Totally Integrated Intelligent Dynamic Systems Display

Active Publication Date: 2009-02-19
OJARALI SYST LLP
View PDF14 Cites 29 Cited by
  • Summary
  • Abstract
  • Description
  • Claims
  • Application Information

AI Technical Summary

Benefits of technology

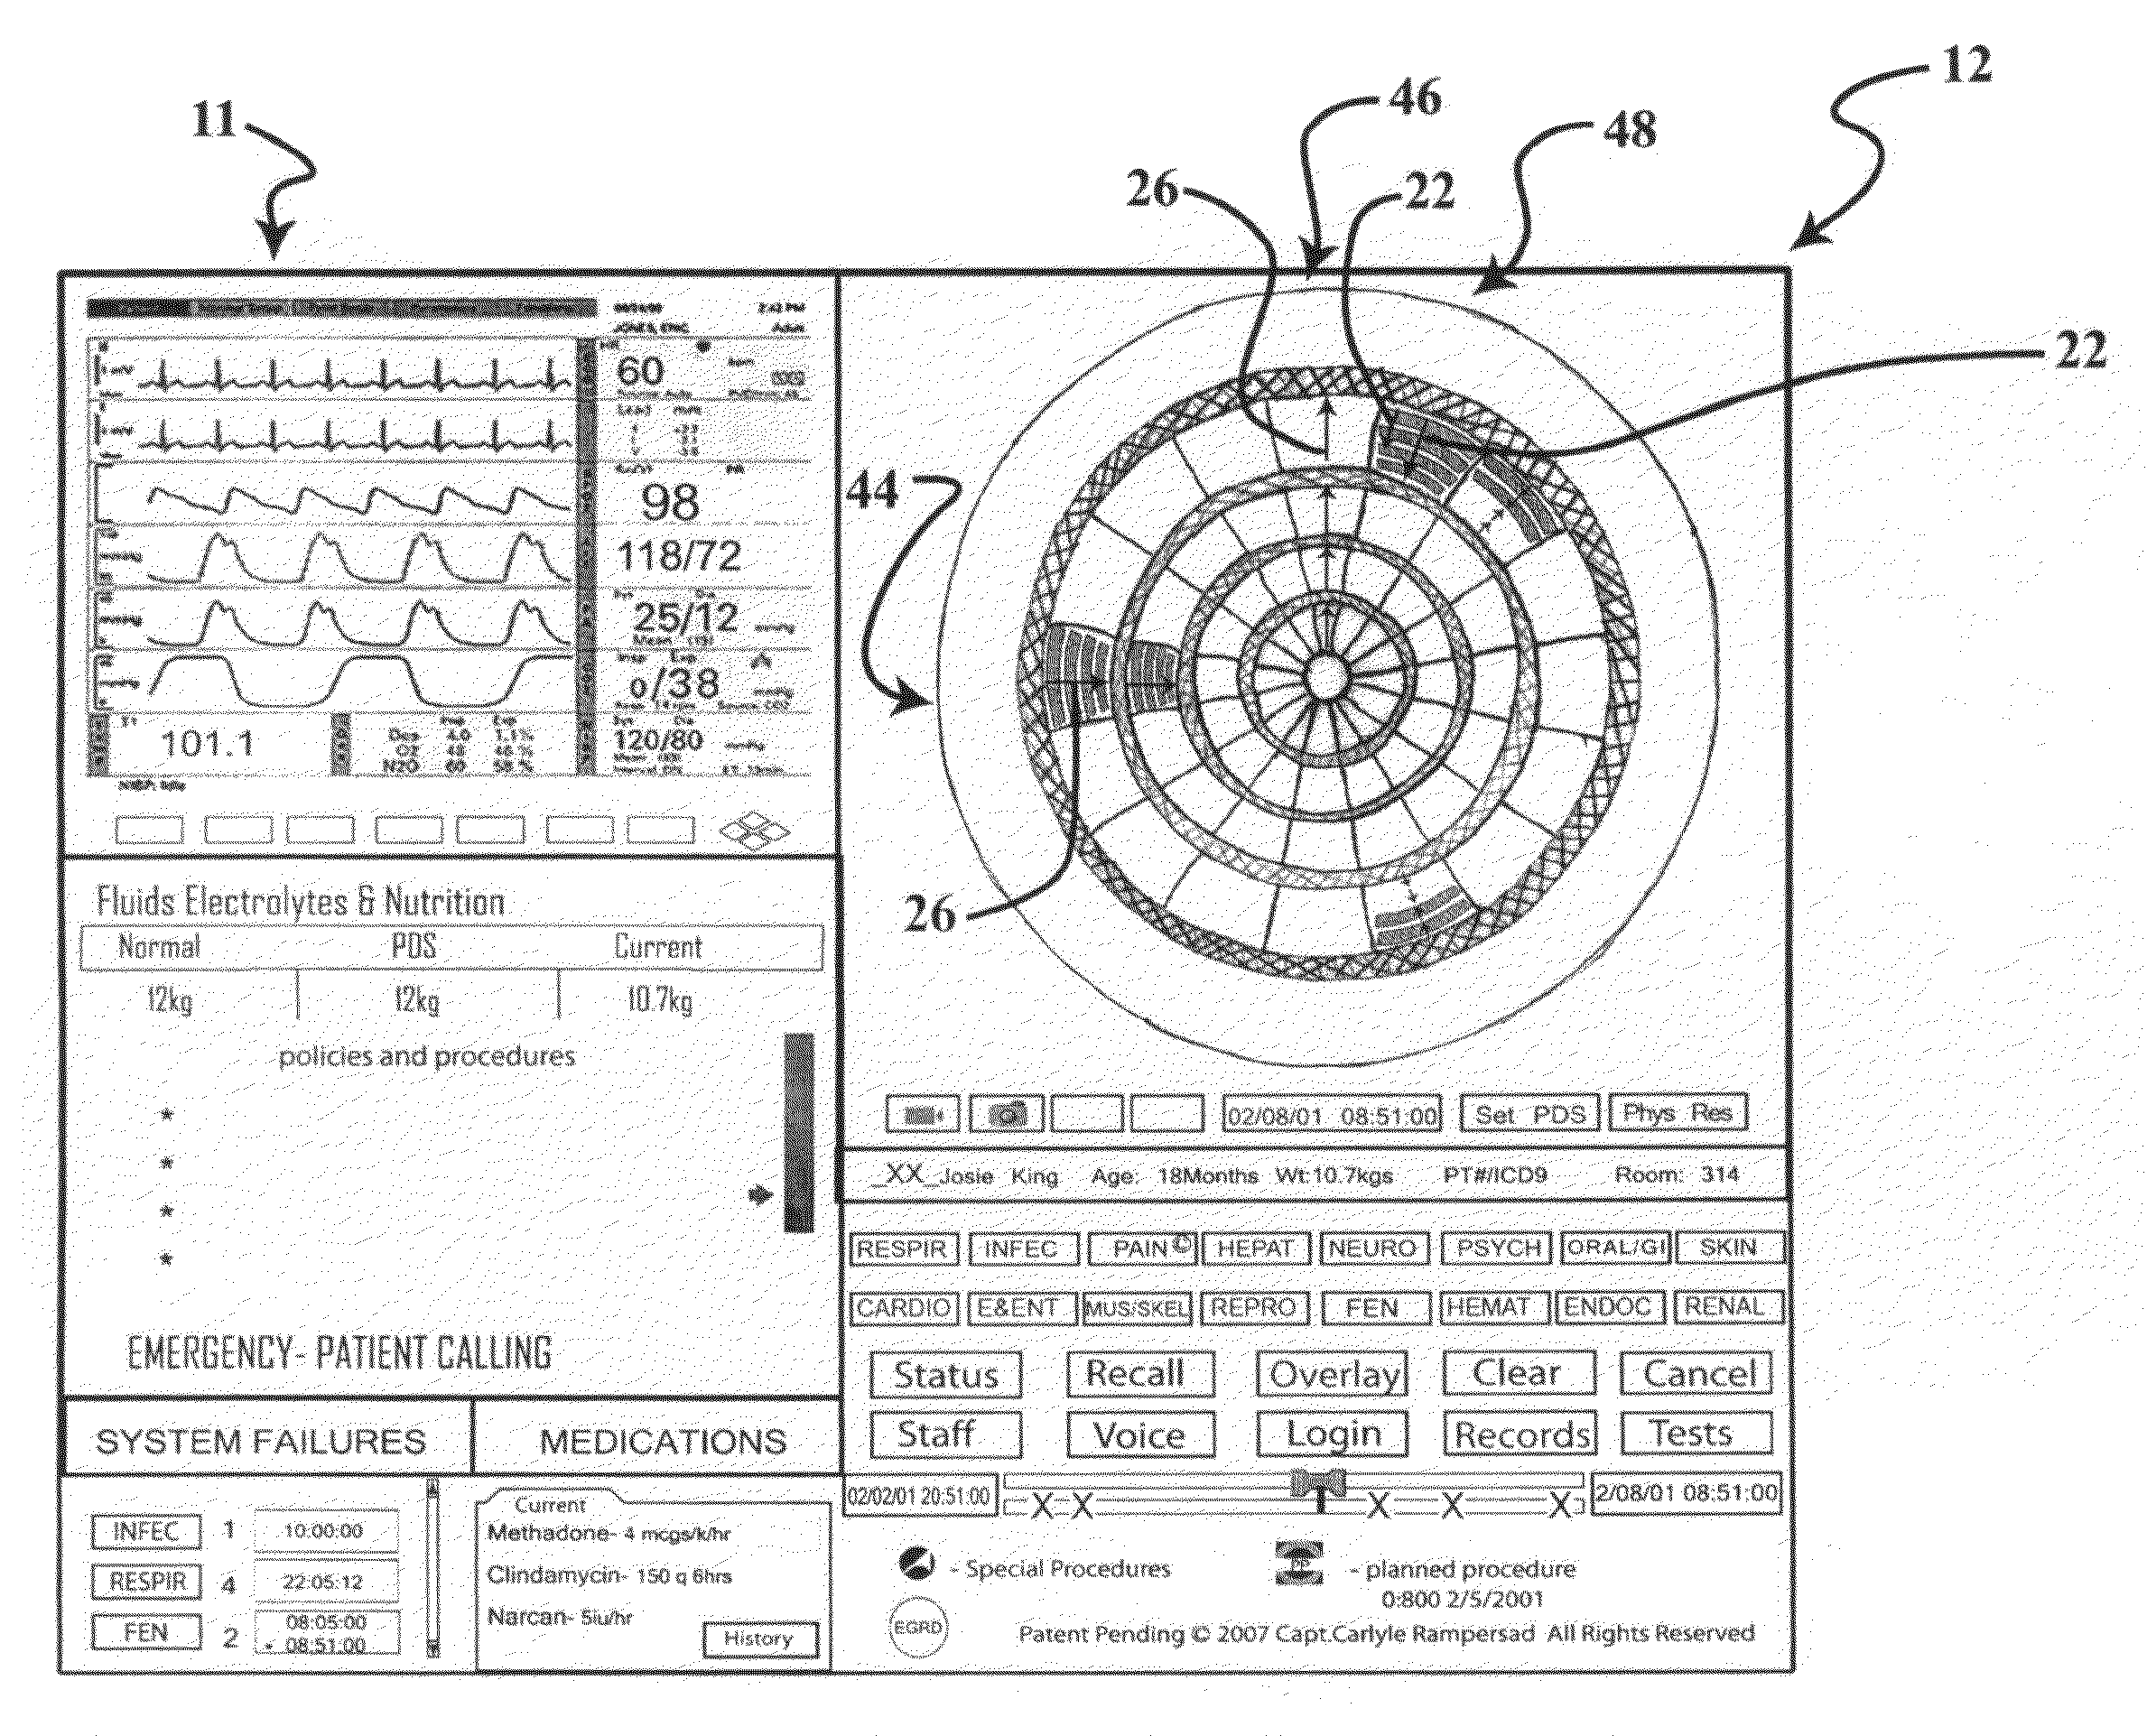
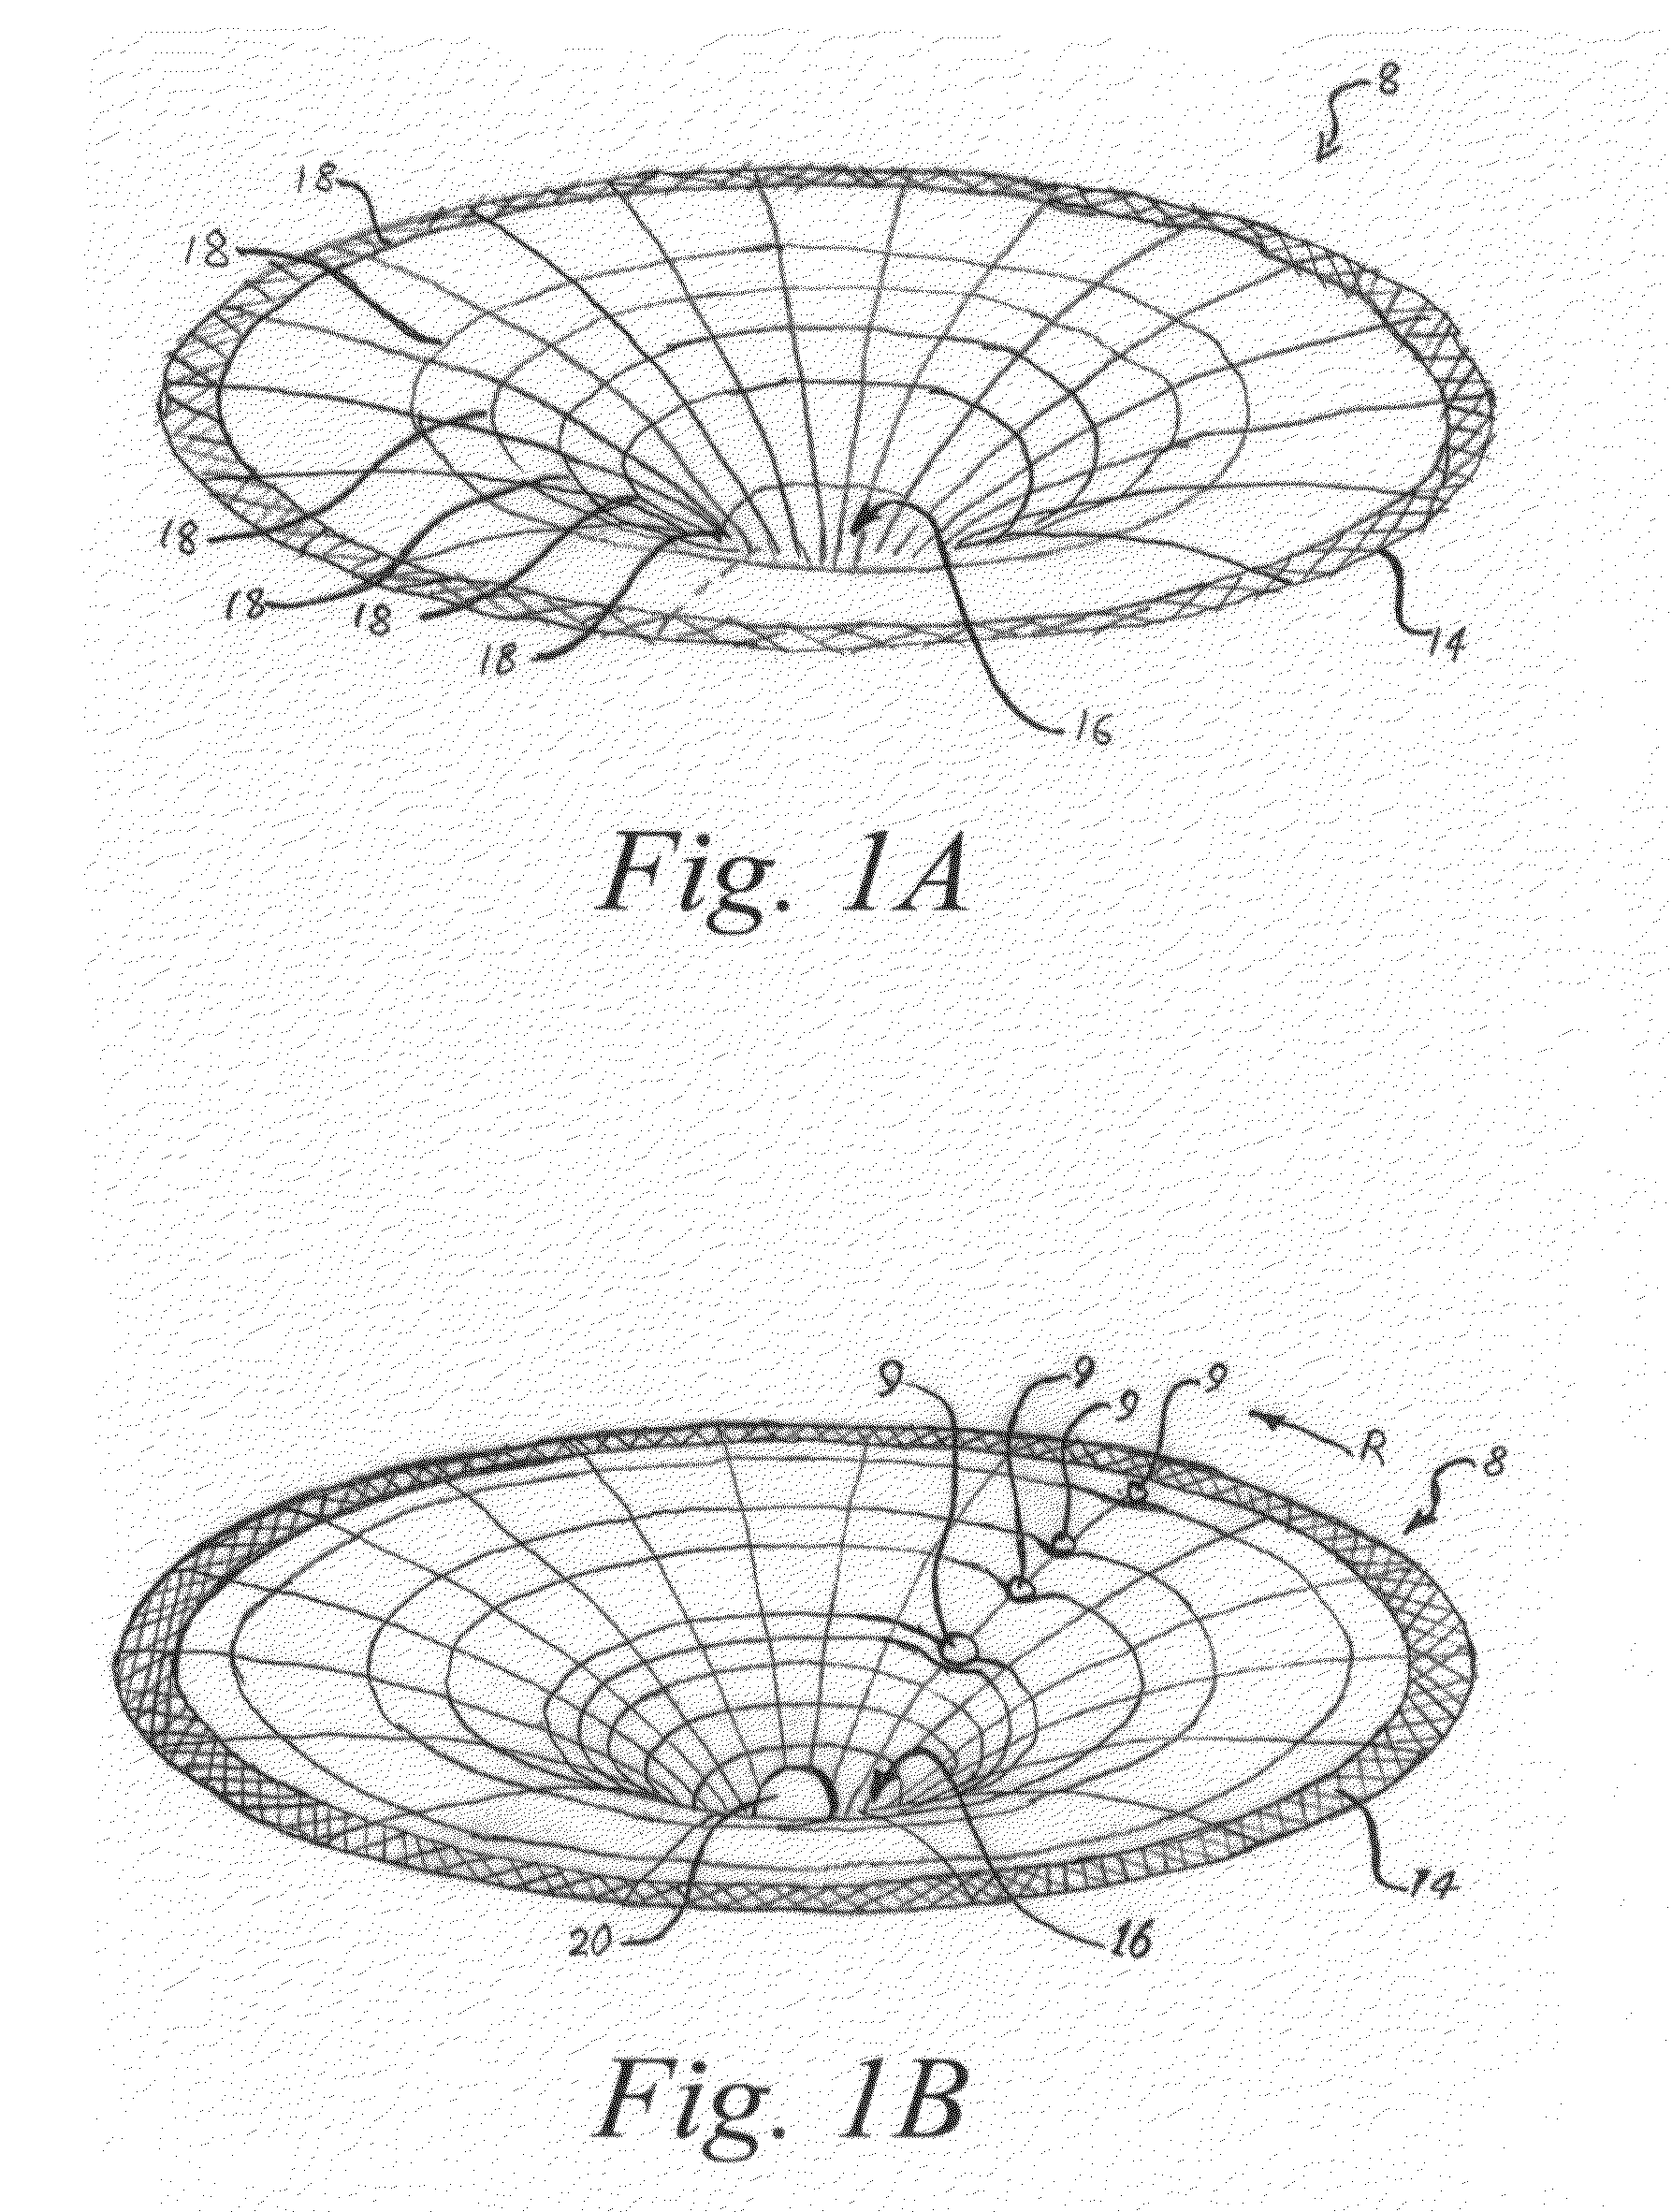
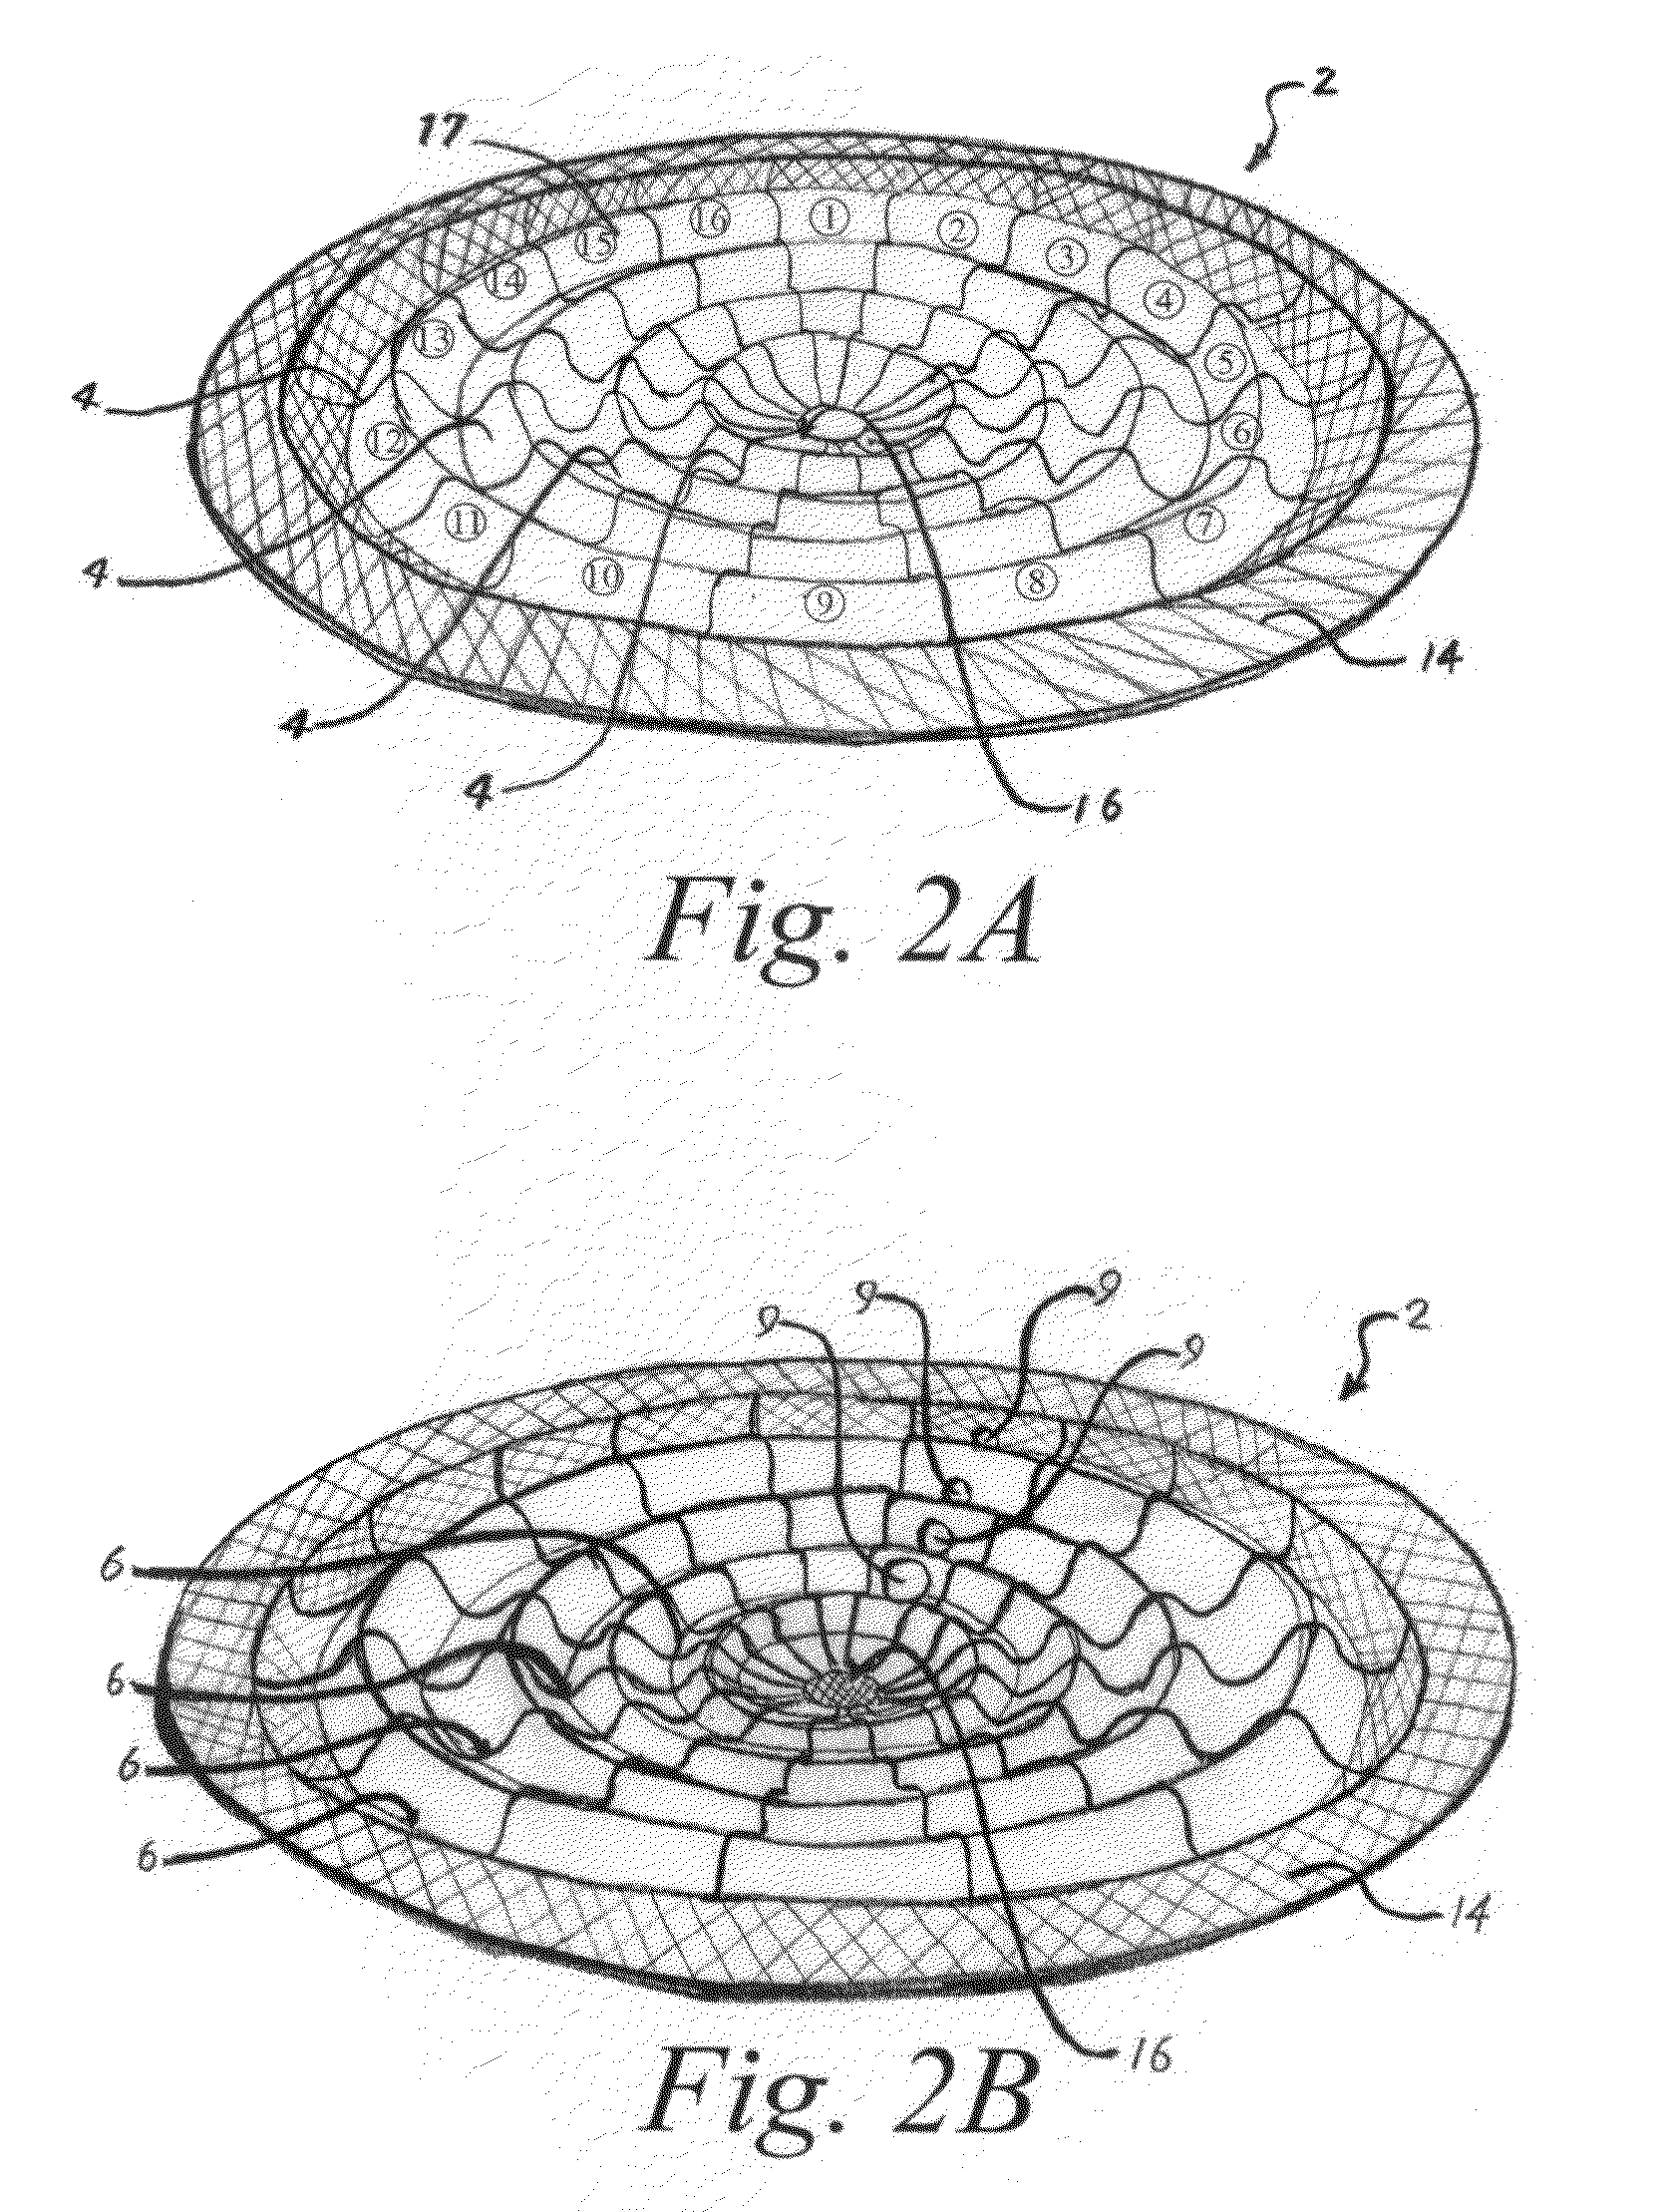
[0011]The Totally Integrated Intelligent Dynamic Systems Display is an apparatus for graphically displaying analytical data, comprising a generic model to graphically represent a complex set of physical characteristics potentially leading to catastrophic failure of a physical system. The model comprises a central region representing failure of the physical system, a series of concentric ridges substantially centered about the central region, where proximity of ridges to the central region is representative of criticality of a subsystem to avoiding the catastrophic failure. Each ridge represents a level of function of the physical system. A depiction of wedge shaped regions is shown upon the ridges. The wedge shaped regions extend outward from the central region, each of which is distinguished from others by color or pattern or other distinguishing feature. The wedge shaped regions represent predetermined subsystems of the physical system. An icon is displa

Problems solved by technology

The hospital may limit access to patient records and to entry of data about a particular patient that would change the TIIPS model to certain staff members.
Selection of an icon for a particular system failure will result in textual details regarding that failure to be displayed in Quadrant J.
This could represent kidney parenchyma damage or damage to the urinary system related to the fracture damaging urinary soft tissue.
The patient reports she has run out of medication and could not afford her pills.
The risks with surgical interventions may have to be carefully weighed and may not be recommended.
This patient may have very little physiologic reserve and so will have very little resistance to ‘the downward push on the trampoline.’ This lack of ‘elasticity’ may predispose the patient to a rapid deterioration should any minor complication arise.
This could lead to improvement or a collapse of the overall system.
One of the greatest challenges for attending physicians is identifying and diagnosing infectious disease soon enough to save a patient's life.
Bacterial infections are difficult to identify, and if left unchecked, lead to organ failure and death.
African American patients who carry the problematic allele are at risk of a 50% drop in renal function.
This is further complicated by the fact that this drop in renal function is associated with a high rate of in-hospital mortality.
Often, this results in delayed billing and missed costs that the hospital cannot recapture.
Airline accidents often involve the same steps in a series of events leading to tragic results: 1) a catalyst event (such as mechanical errors in design or flaws in manufacturing of airplane parts); 2) a system fault (such as disregarding manufacturers' recommendations on inspections of parts); 3) a loss of situational awareness (such as a captain not being fully aware of the nature or cause of the mechanical problem); and 4) human error (such as the captain choosing to troubleshoot the problem while in flight as opposed to landing the plane as quickly as possible).
With regard to the human error factor, airline pilots may be prone to following the four steps that lead to accidents: namely: 1) posturing; 2) analyzing the facts to support a decision they have already made; 3) disregarding the advice or input of others; and, 4) persisting in a course of action despite a deteriorating condition due to loss of situational awareness.
One of the engines lost a slight amount of power and it resulted in drag on the left side of the aircraft.
The resultant drag created a loss of lift and the autopilot pitched the nose of the aircraft up to maintain altitude.
This further increased drag and reduced lift.
These positions and pressures were totally inconsistent for the location of the flight at that point in time.

Method used


Image

  • Totally Integrated Intelligent Dynamic Systems Display
  • Totally Integrated Intelligent Dynamic Systems Display
  • Totally Integrated Intelligent Dynamic Systems Display

Examples


Embodiment Construction

[0036]The following detailed description illustrates the invention by way of example, not by way of limitation of the scope, equivalents or principles of the invention. This description describes several embodiments, adaptations, variations, alternatives and uses of the invention.

[0037]In this regard, the invention is illustrated in the several figures, and is of sufficient complexity that the many parts, interrelationships, and sub-combinations thereof cannot be fully illustrated in a single patent-type drawing. For clarity and conciseness, several of the drawings show in schematic, or omit, parts that are not essential in that drawing to a description of a particular feature, aspect or principle of the invention being disclosed. Thus, the best mode embodiment of one feature may be shown in one drawing, and the best mode of another feature will be called out in another drawing.

A. Generic Dynamic Error Model

[0038]1. Gravitational Well Format

[0039]Referring to FIGS. 1A and 1B, the ba...


PUM


Abstract

An apparatus for graphically displaying analytical data, comprising a generic model to graphically represent a complex set of physical characteristics potentially leading to catastrophic failure of a physical system. A central region represents failure of the physical system; a series of concentric ridges represents level of function. Wedge shaped regions upon the ridges represent predetermined subsystems of the physical system. An icon is displayed with changes in the icon proportional to time, and any one or more of color, position, shape, and rotation of the icon representing prescribed analysis of the physical characteristics. Mappings correlate predetermined characteristics of the system with failure of the physical system, levels of functioning represented by the ridges, subsystems represented by the wedge shaped regions, and / or analysis of the physical characteristics represented in the icon. A sensor interface receives measurements, and a graphics generator prepares a presentation of the model.

Description

CROSS REFERENCE TO RELATED APPLICATIONS[0001]This application claims priority under 35 USC 119(e) of Provisional Patent Application Ser. No. 60 / 976,897 filed Oct. 2, 2007, entitled “Totally Integrated Interactive Patient Systems Display,” and Provisional Patent Application Ser. No. 60 / 937,655 filed Jun. 29, 2007, entitled “Totally Integrated Intelligent Dynamic Systems Display” which are hereby incorporated by reference in their entirety.FIELD OF THE INVENTION[0002]The invention relates to dynamic systems analysis and displays for complex entities comprising one or more system or subsystems, and particularly, to a three-dimensional dynamic error model for visual display of the status of the multiple subsystems in real time.BACKGROUND OF THE INVENTIONSystem Dynamics[0003]Over any period of time, in any complex system, there are two forces working in opposite directions. One force is working to maintain the unit at optimum function under the theory of complexity. Working in opposition...

Claims


Application Information

Patent Timeline
IPC IPC(8): G06T17/00G16H40/67
CPCG06F19/3406G06T11/206G06F19/345G06F19/3418G16H40/63G16H50/20G16H40/67Y02A90/10
Inventor RAMPERSAD, CARLYLE
Owner OJARALI SYST LLP
Learn More