
Method and System for Non-Invasive Optical Blood Glucose Detection Utilizing Spectral Data Analysis

Active Publication Date: 2009-11-26
ST LOUIS MEDICAL DEVICES INC
View PDF99 Cites 20 Cited by
  • Summary
  • Abstract
  • Description
  • Claims
  • Application Information

AI Technical Summary

Benefits of technology

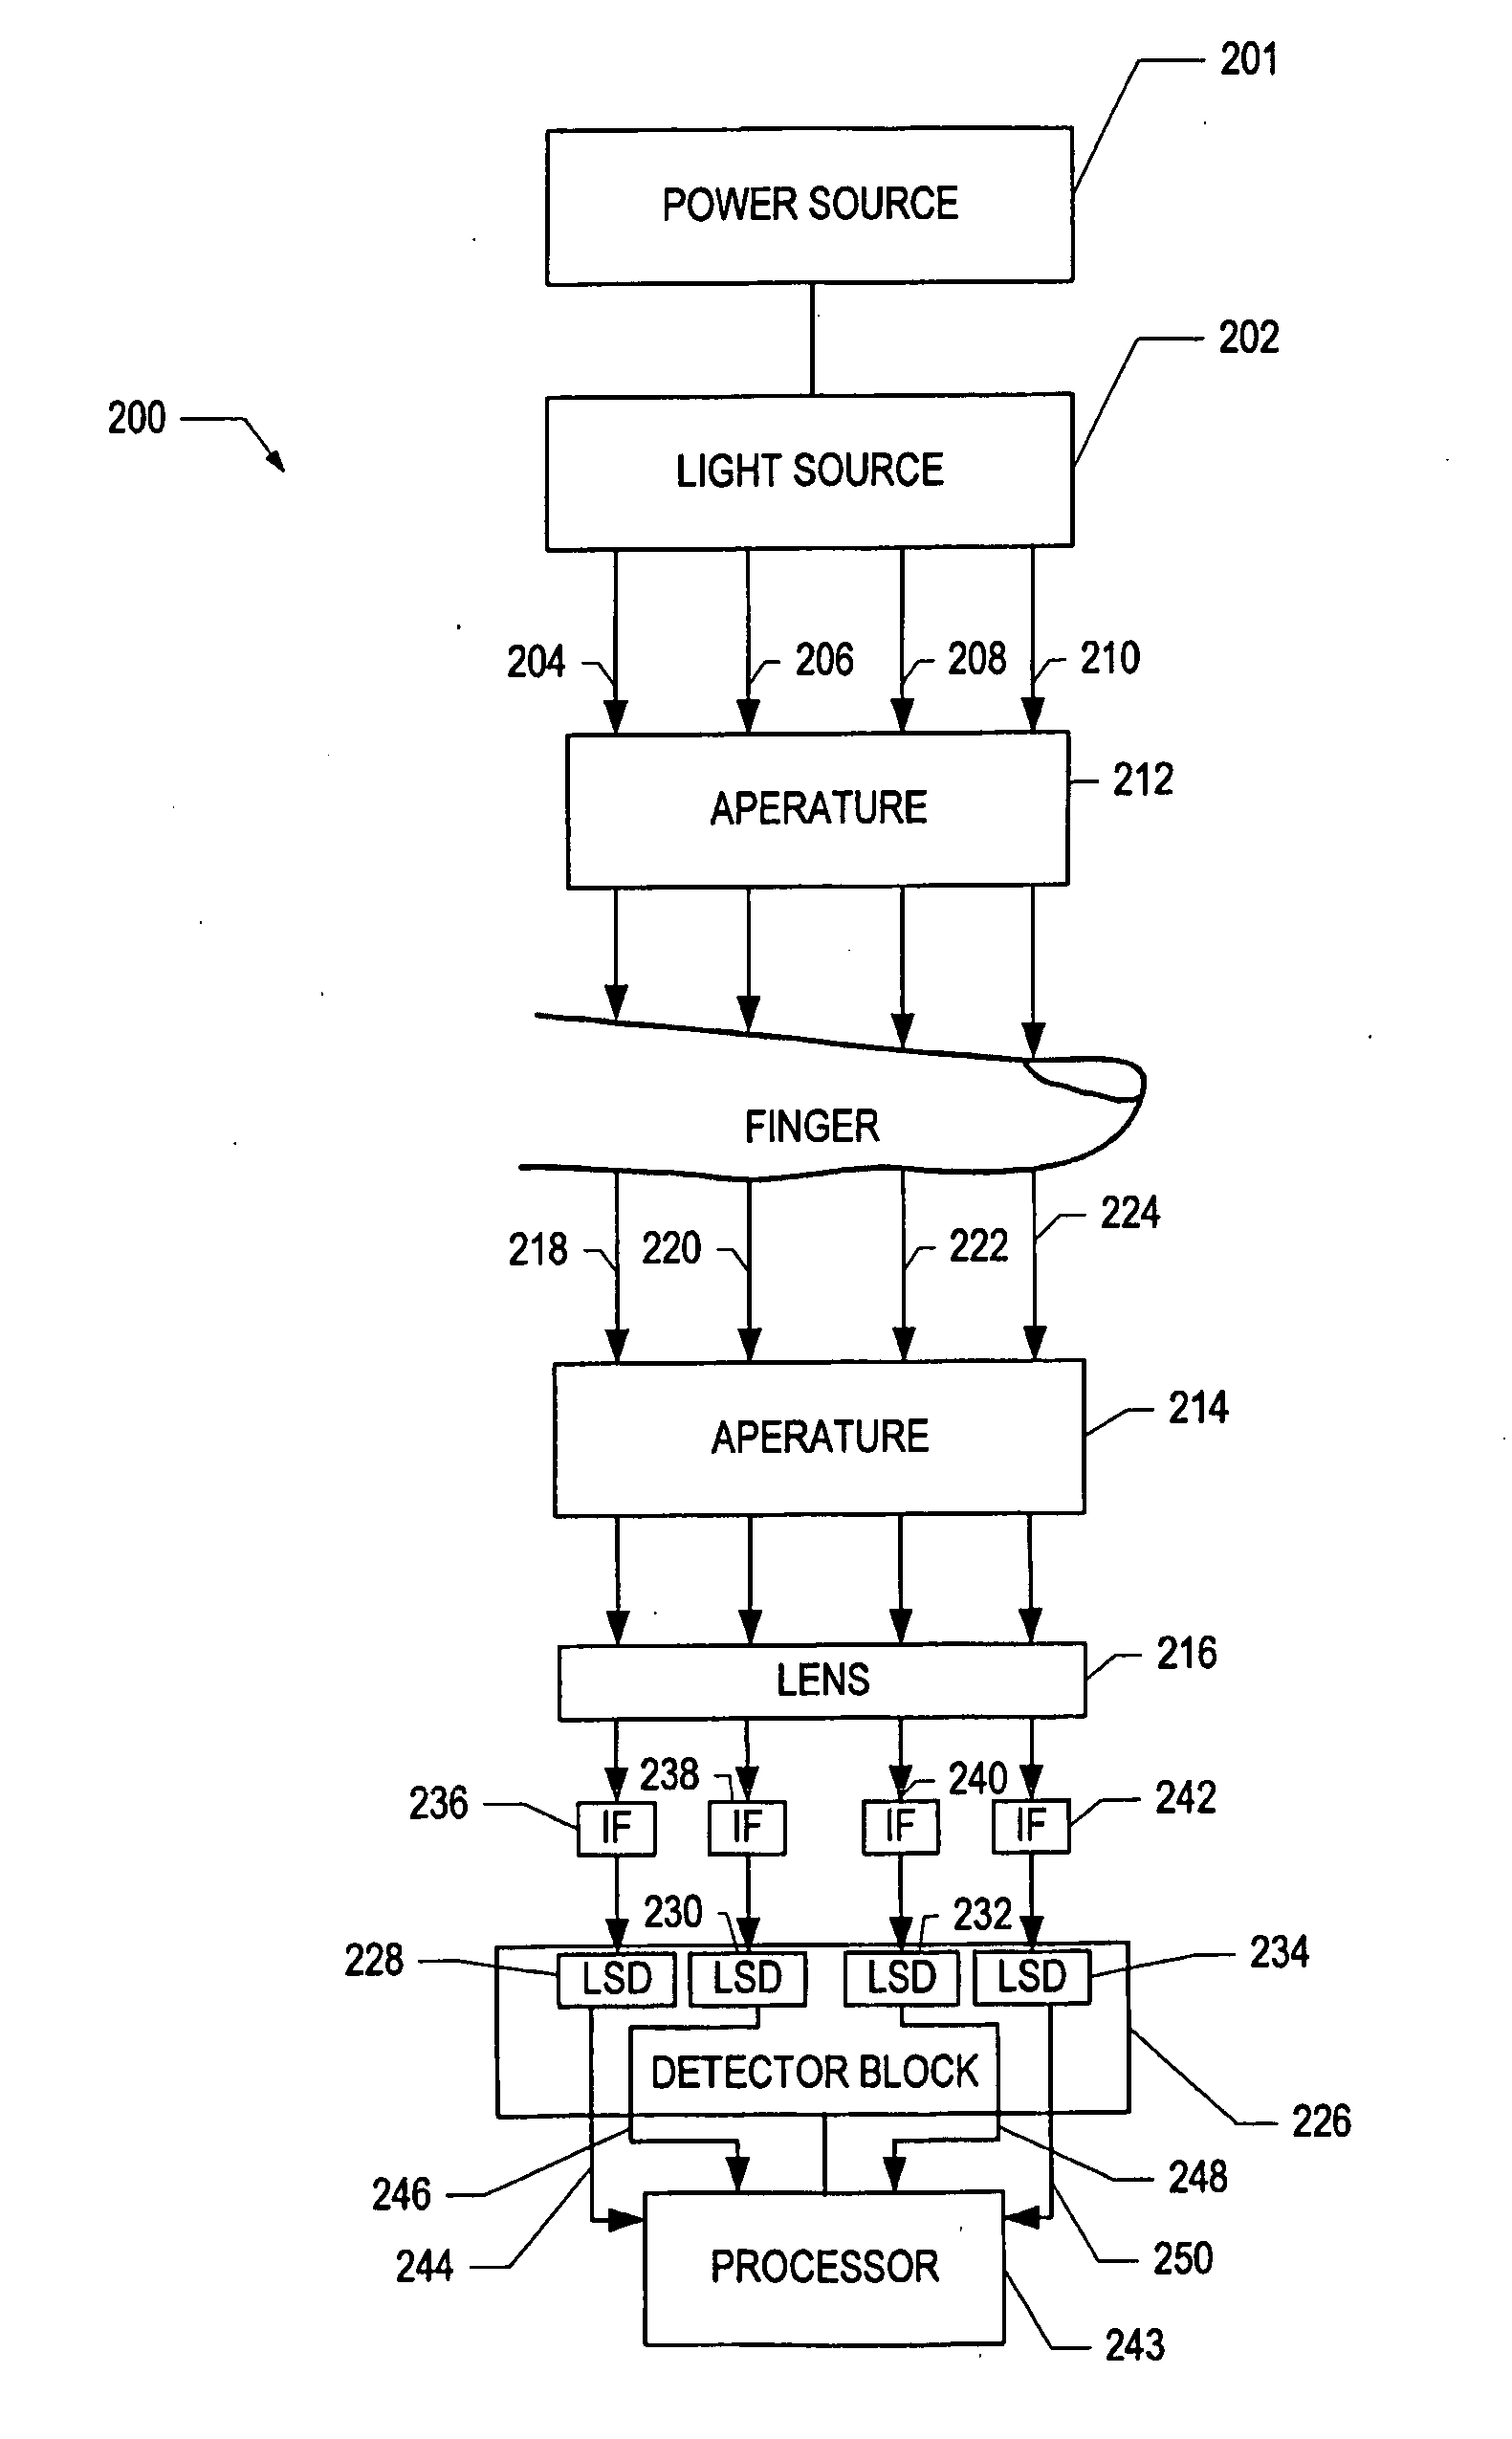
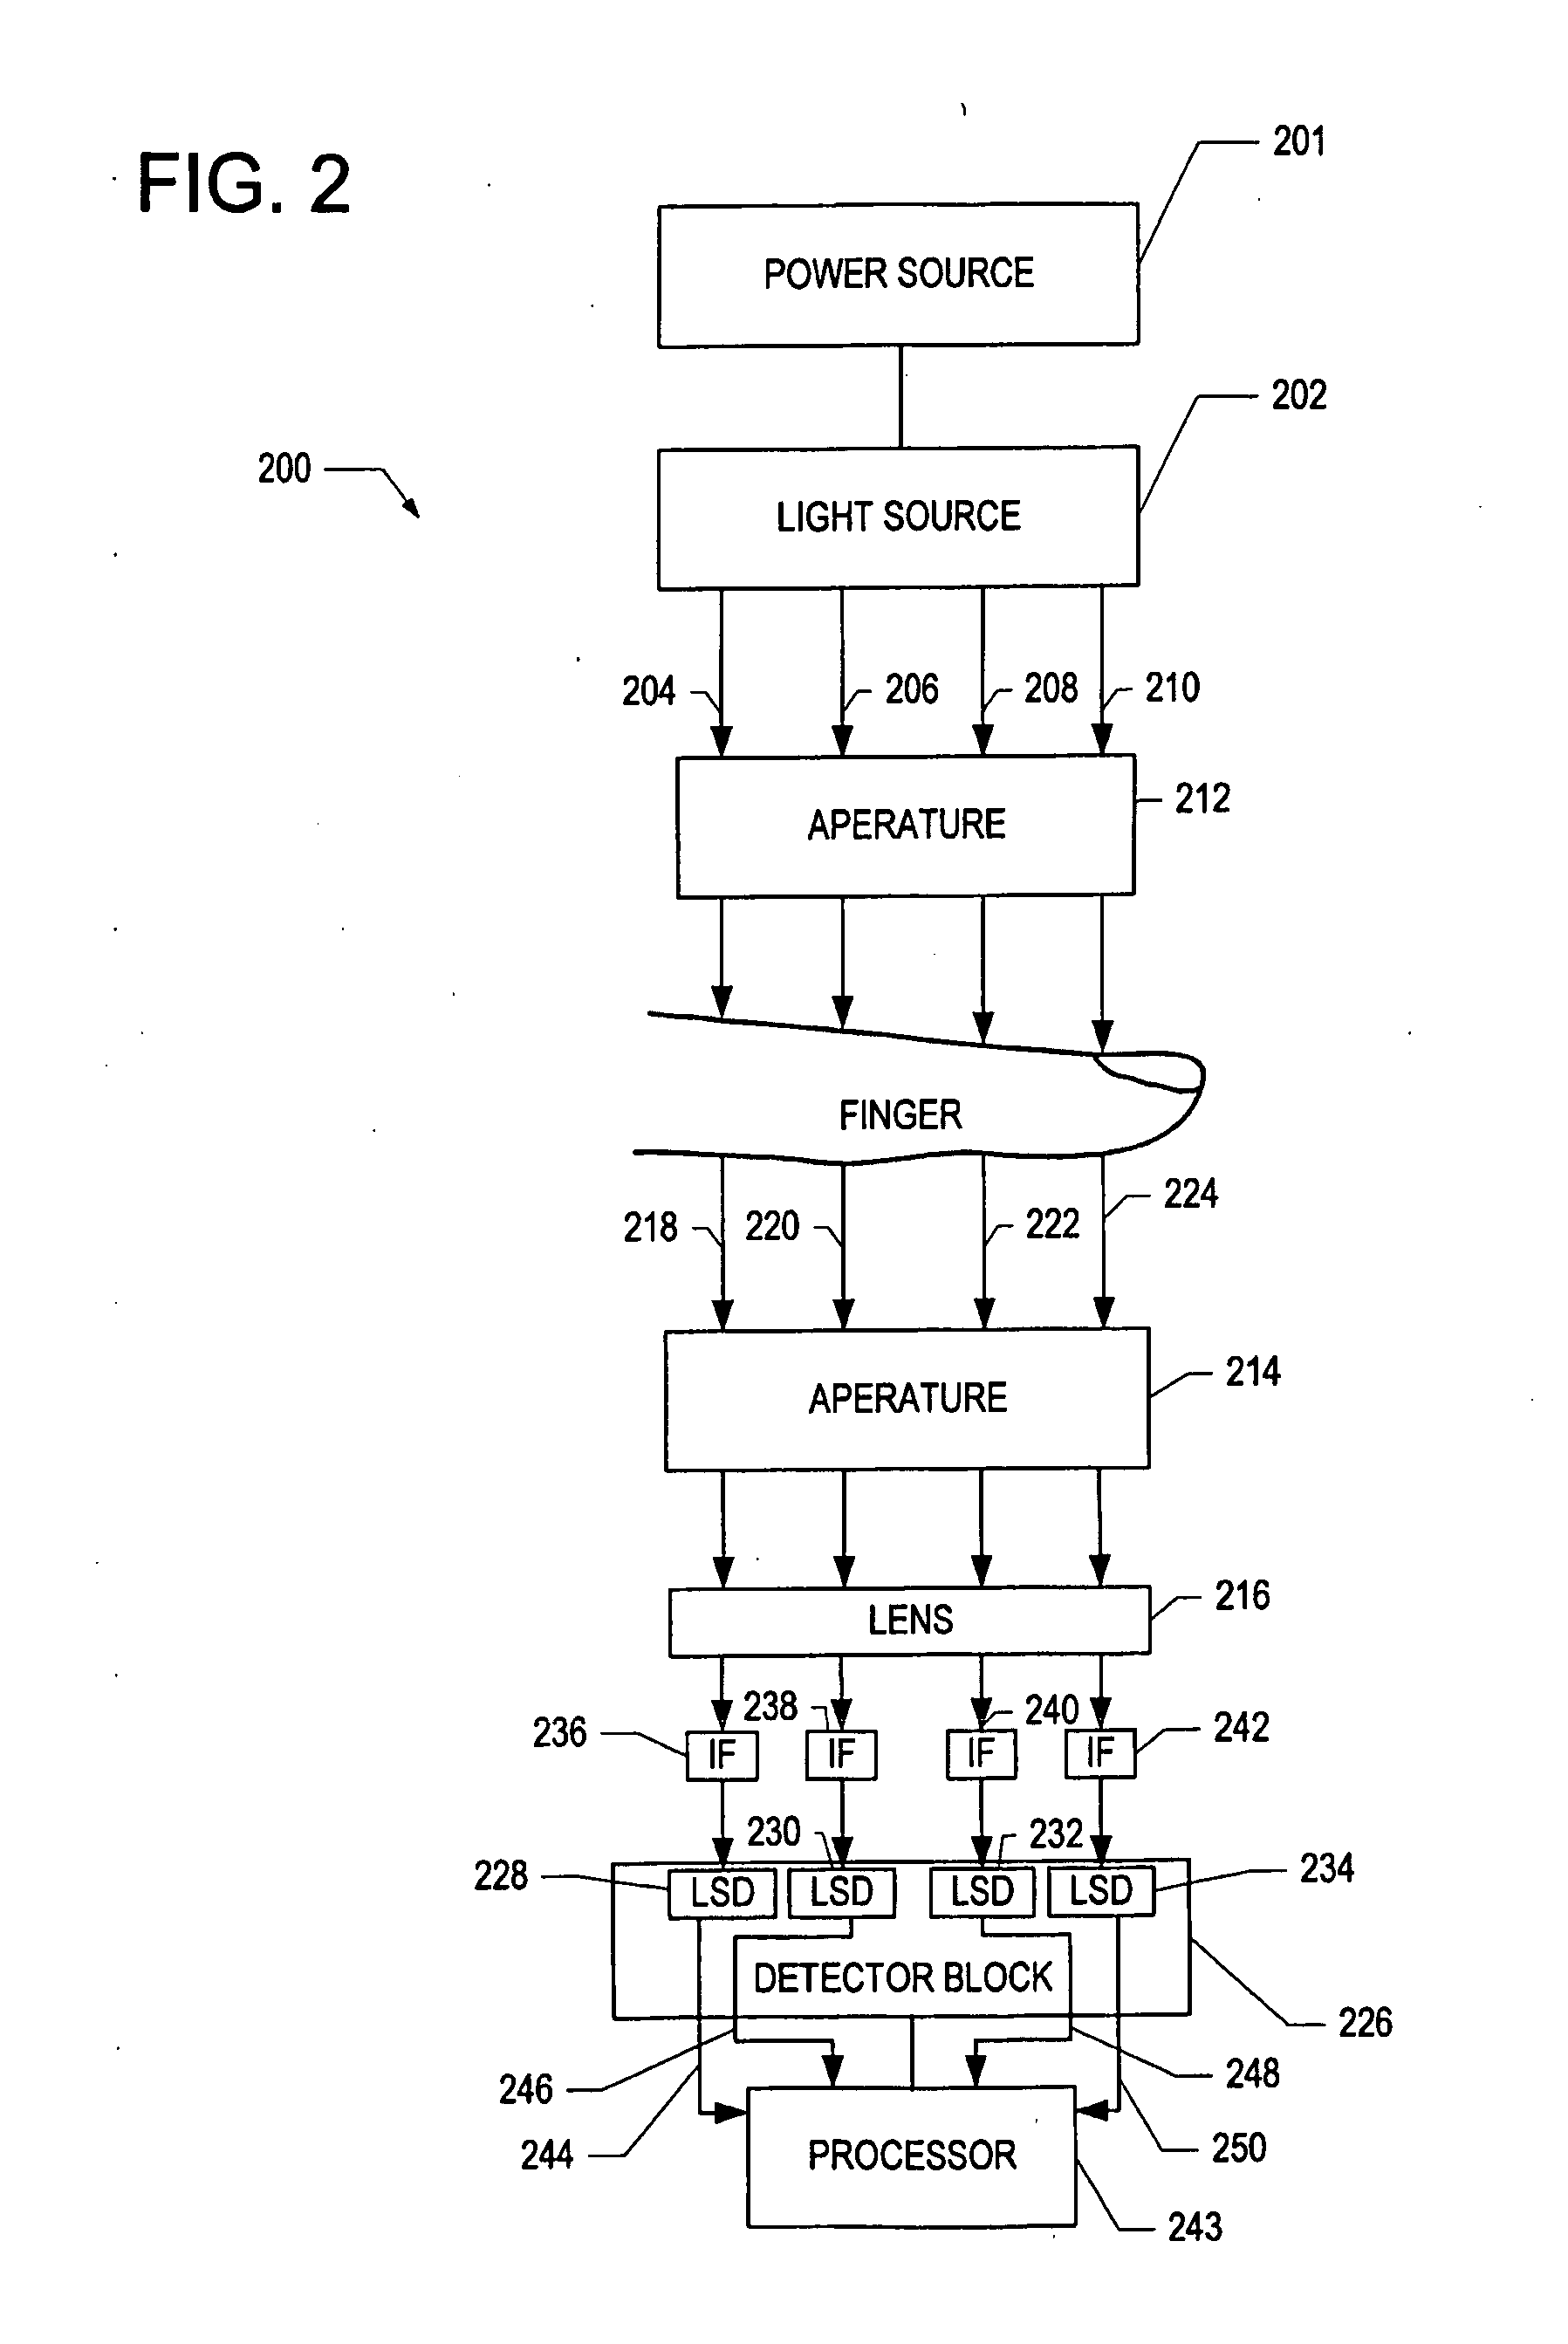
[0012]In still another aspect of the present invention, a system for detecting glucose in a biological sample is disclosed. The system includes at least one light source configured to strike a target area of a sample, at least one light detector positioned to receive light from the at least one light source and to generate an output signal, having a time dependent current, which is indicative of the power of light detected, and a processor that receives the output signal from the at least one light detector and based on the received output signal, calculates the attenuance attributable to blood in a sample present in the target area and eliminates effect of uncertainty caused by temperature dependent detector response of the at least one light detector, and based on the calculated attenuance, determines a blood glucose level associated with a sample present in the target area.
[0013]In still yet another aspect of the present invention, a system for detecting glucose in a biological sample is disclosed. The system includes at least one light source configured to strike a target area of a sample, at least one light detector, which includes a preamplifier having a feedback resistor, positioned to receive light from the at least one light source and to generate an output signal, having a time dependent current, which is indicative of the power of light detected, and a processor that receives the output signal from the at least one light detector and based on the received output signal, calculates the attenuance attributable to blood in a sample present in the target area and eliminates effect of uncertainty caused by temperature dependent detector response of the at least one light detector, and based on the calculated attenuance, determines a blood glucose level associated with a sample present in the target area.
[0018]In another aspect of the present invention, a method for detecting glucose in a biological sample is disclosed. The method includes utilizing at least one light source configured to strike a target area of a sample, utilizing at least one light detector positioned to receive light from the at least one light source and to generate an output signal, having a time dependent current, which is indicative of the power of light detected, receiving the output signal from the at least one light detector with a processor and based on the received output signal, calculating the attenuance attributable to blood in a sample present in the target area with a ratio factor with the processor, eliminating effect of uncertainty caused by temperature dependent detector response of the at least one light detector with the processor, and determining a blood glucose level associated with a sample present in the target area with the processor based on the calculated attenuance with the processor.

Problems solved by technology

Diabetes is a chronic disease that, when not controlled, over time leads to serious damage to many of the body's systems, including the nerves, blood vessels, eyes, kidneys and heart.
The economic burden from diabetes for individuals and society as a whole is substantial.
However, current monitoring techniques discourage regular use due to the inconvenient and painful nature of drawing blood through the skin prior to analysis, which causes many diabetics to not be as diligent as they should be for good blood glucose control.
Extracting information about blood characteristics such as glucose concentration from spectral or other data obtained from spectroscopy is a complex problem due to the presence of components (e.g., skin, fat, muscle, bone, interstitial fluid) other than blood in the area that is being sensed.
In particular, the resulting signal may be much larger in magnitude than the portion of the signal that corresponds to blood, and therefore limits the ability to accurately extract blood characteristics information.

Method used


Image

  • Method and System for Non-Invasive Optical Blood Glucose Detection Utilizing Spectral Data Analysis
  • Method and System for Non-Invasive Optical Blood Glucose Detection Utilizing Spectral Data Analysis
  • Method and System for Non-Invasive Optical Blood Glucose Detection Utilizing Spectral Data Analysis

Examples


Embodiment Construction

[0025]In the following detailed description, numerous exemplary specific details are set forth in order to provide a thorough understanding of the invention. However, it will be understood by those skilled in the art that the present invention may be practiced without these specific details, or with various modifications of the details. In other instances, well known methods, procedures, and components have not been described in detail so as not to obscure the present invention.

[0026]Optical spectroscopy can be used to determine the amount of light absorbed and scattered, i.e., attenuated, by a biological sample such as a human finger. By measuring the amount of light absorbed by the sample, it is possible to determine glucose, cholesterol, and hemoglobin levels of a subject non-invasively. Fingertip measurements are usually preferred because of the large concentration of capillaries in the fingertip and because of the conversion of arterial blood into venous blood that occurs in th...


PUM


Abstract

Systems and methods are disclosed for non-invasively measuring blood glucose levels in a biological sample based on spectral data. A variety of techniques are disclosed for improving signal-to-noise ratio in the acquisition of spectral data and calculating attenuance of light attributable to blood in a sample. Disclosed techniques include (1) using a standard deviation operation in conjunction with the logarithm function, (2) using a normalization factor, (3) using a ratio factor, (4) accounting for the effect of temperature on various system components such as resistors, and (5) accounting for dark current in a light detector by performing a calibration.

Description

CROSS-REFERENCE TO RELATED APPLICATION[0001]This patent application claims priority to U.S. Provisional Patent Application Ser. No. 61 / 055,303 filed on May 22, 2008, the disclosure of which is incorporated herein by reference, and also claims priority to U.S. Provisional Patent Application Ser. No. 61 / 089,152 filed on Aug. 15, 2008, the disclosure of which is incorporated herein by reference.BACKGROUND OF THE INVENTION[0002]Diabetes is a chronic disease that, when not controlled, over time leads to serious damage to many of the body's systems, including the nerves, blood vessels, eyes, kidneys and heart. The National Institute of Diabetes and Digestive and Kidney Diseases (NIDDK) estimates that 23.6 million people or 7.8 percent of the population in the United States had diabetes in 2007. Globally, the World Health Organization (WHO) estimates that more than 180 million people have diabetes, a number they expect to increase to 366 million by 2030, with 30.3 million in the United Sta...

Claims


Application Information

Patent Timeline
IPC IPC(8): A61B5/1455G16Z99/00
CPCA61B5/14532A61B5/6838A61B5/6826A61B5/1455G16Z99/00A61B5/7225A61B2562/0238A61B2576/00
Inventor XU, ZHI
Owner ST LOUIS MEDICAL DEVICES INC
Learn More