Measurements of Redox Potential and Concentration of Redox Active Substances
a technology of redox potential and concentration, which is applied in the direction of measurement devices, instruments, scientific instruments, etc., can solve the problems of inability to investigate light sensitive substances, inability to measure redox active organic substances with pt, and inability to use light sensitive signals. to achieve the effect of good nernstian response and lower sensitivity limi
- Summary
- Abstract
- Description
- Claims
- Application Information
AI Technical Summary
Benefits of technology
Problems solved by technology
Method used
Image
Examples
example 1
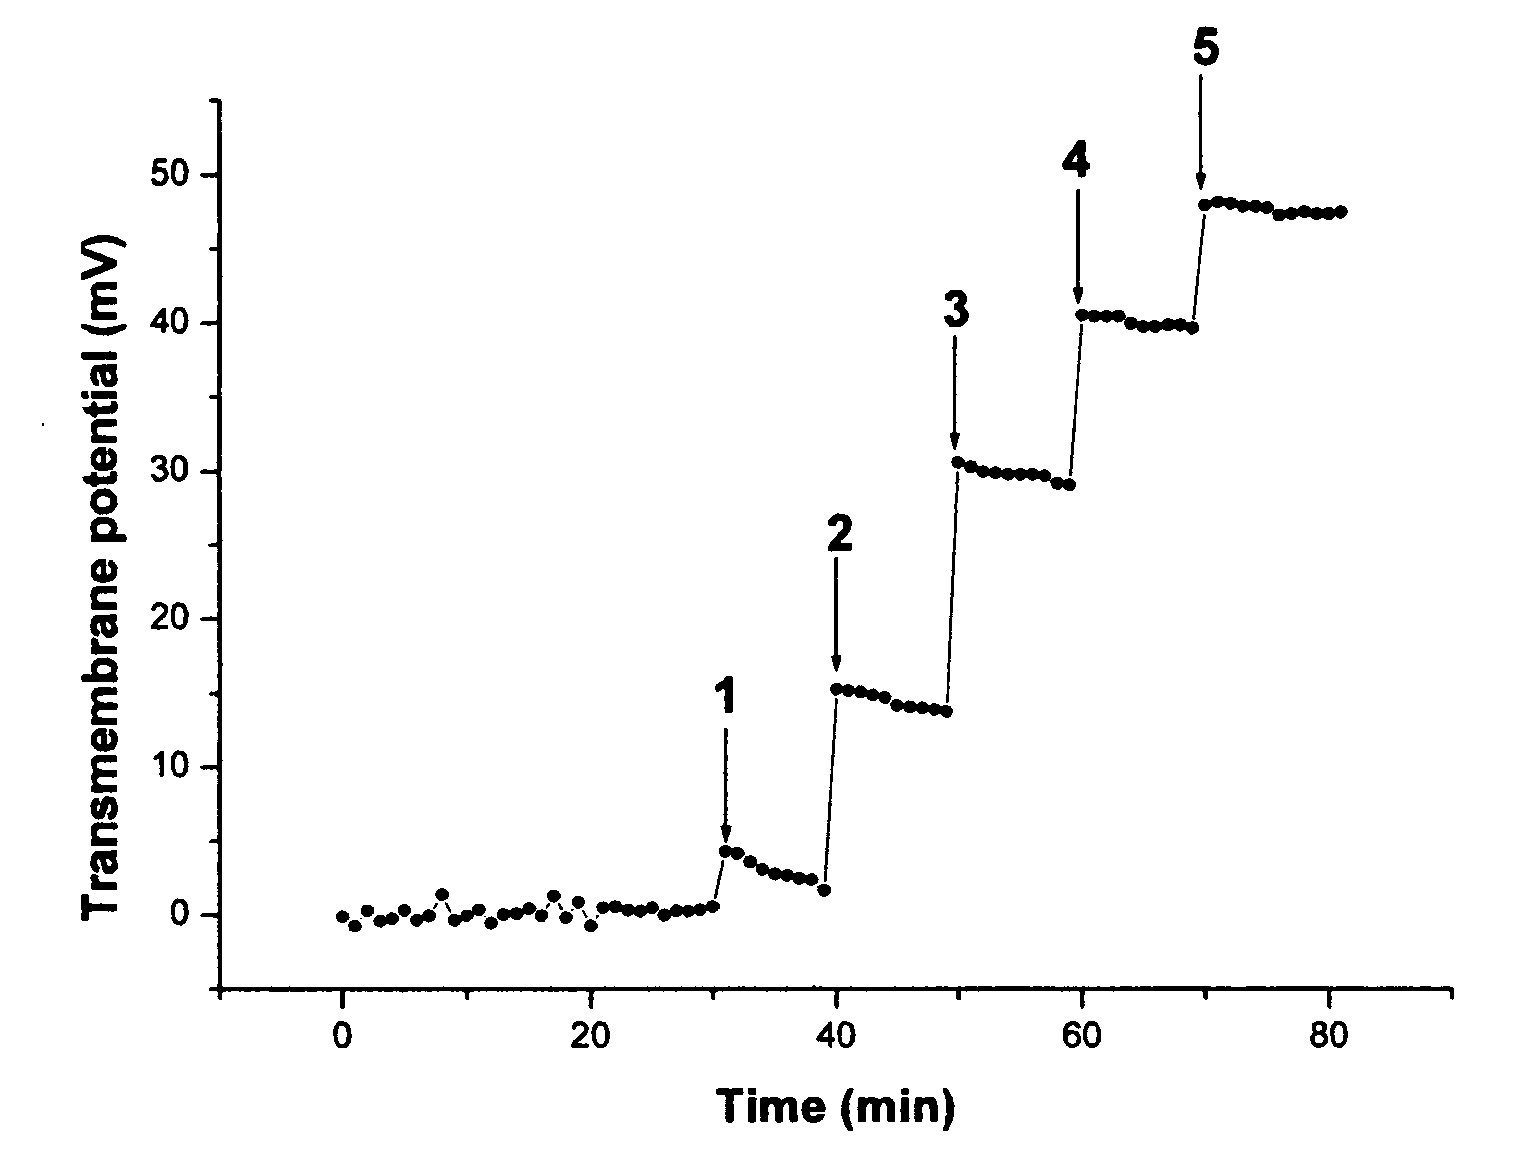
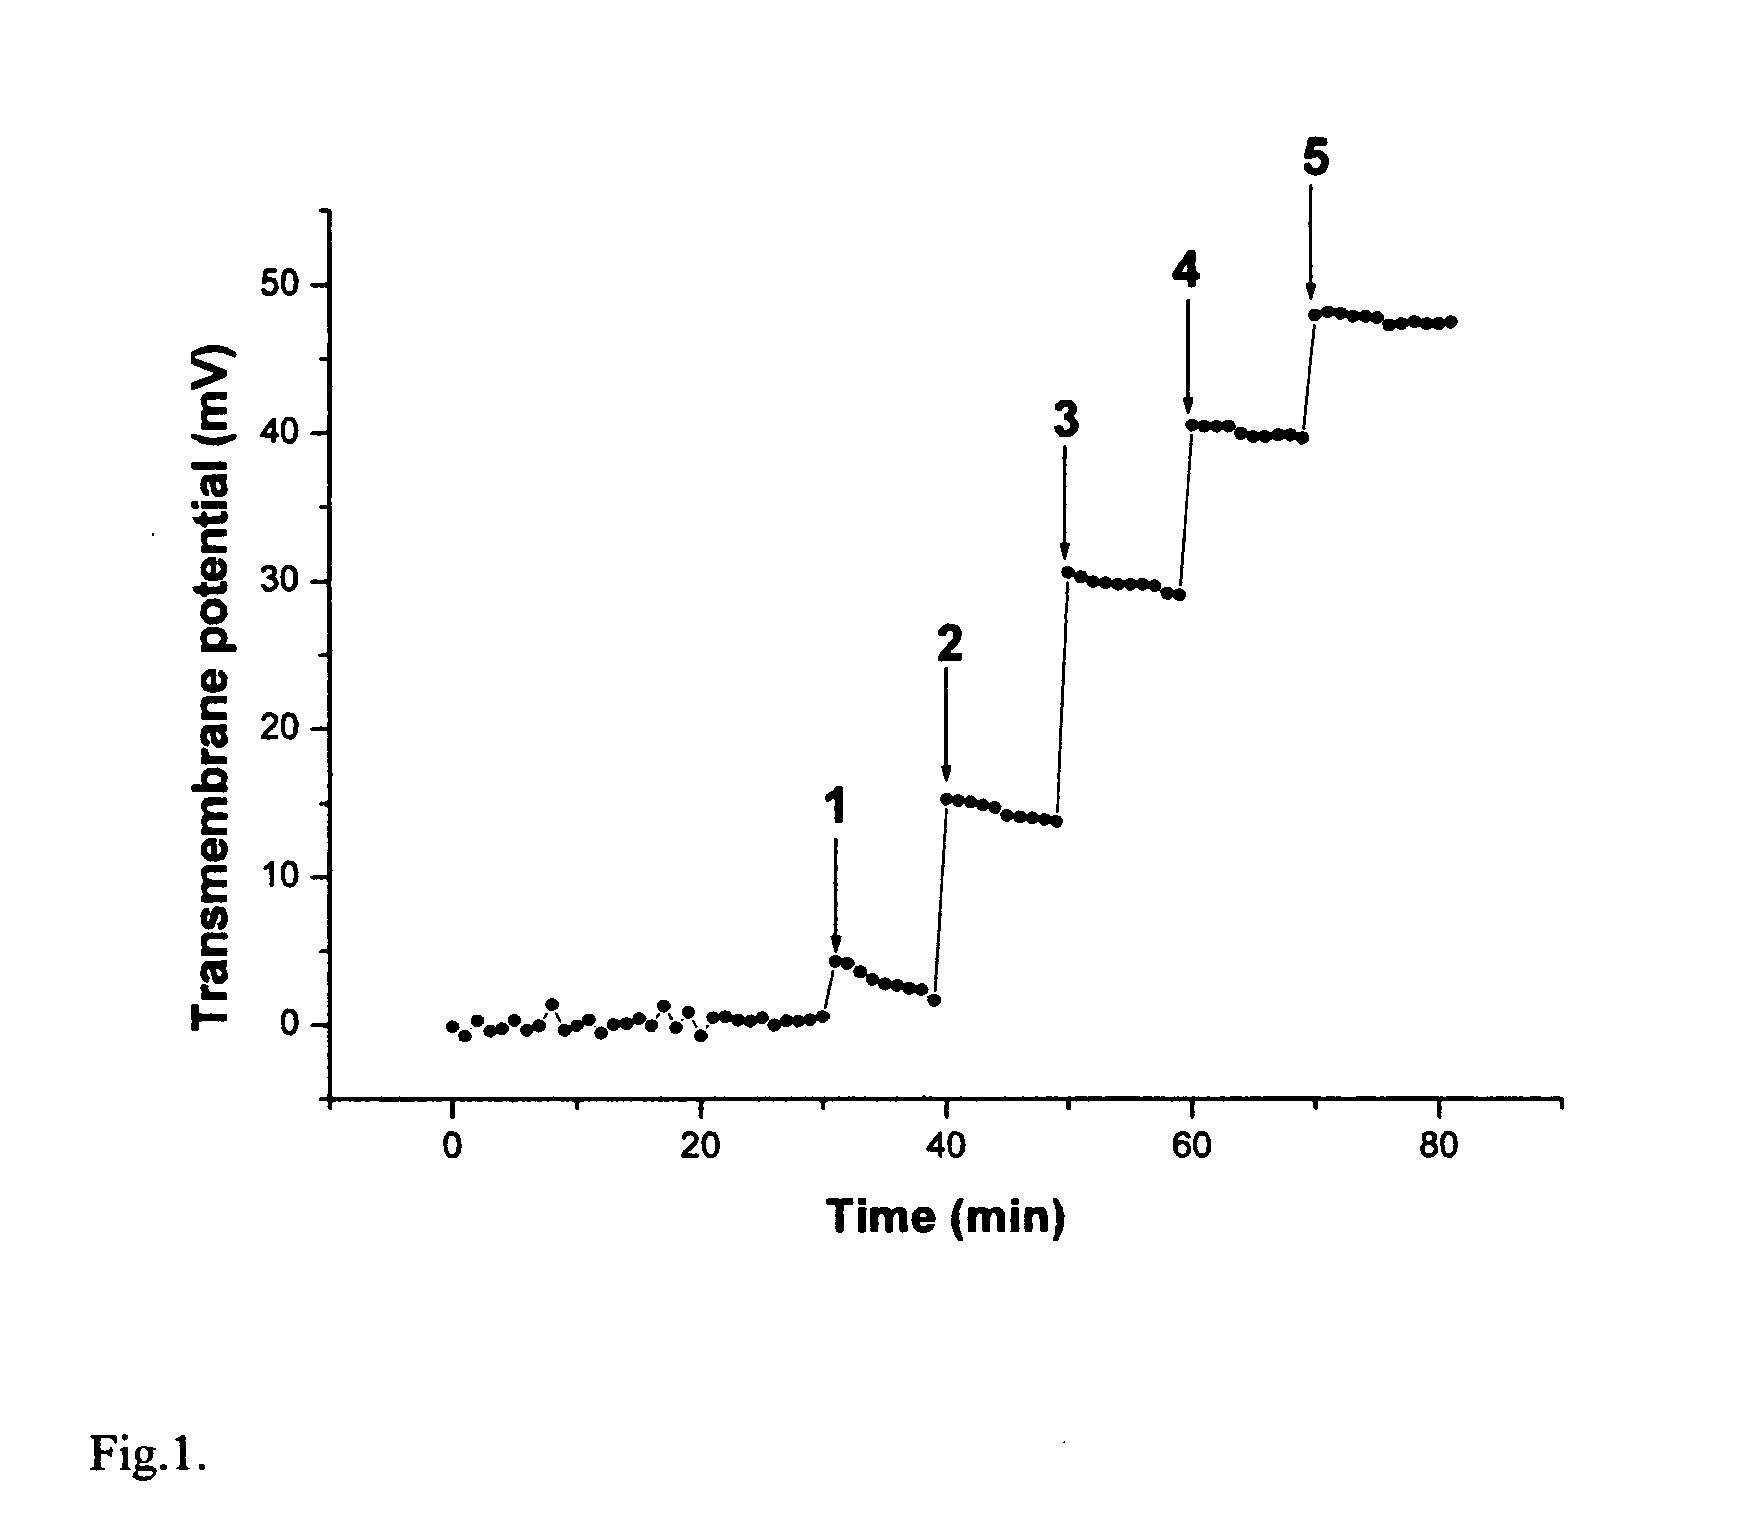
[0065]FIG. 1 shows a typical kinetics of transmembrane electric potential formation after several additions of K3Fe(CN)6. The opposite solution was 0.01M K4Fe(CN)6 in the same buffer. It takes less than couple of minutes to reach maximum potential after each addition. The positive sign of the transmembrane potential corresponds to the direction of electron flow from the reducing to the oxidizing solution, where the reference electrode was inserted. If only ferricyanide was present in both solutions and its concentration in one of the solutions was changed, the effect was not observed.
example 2
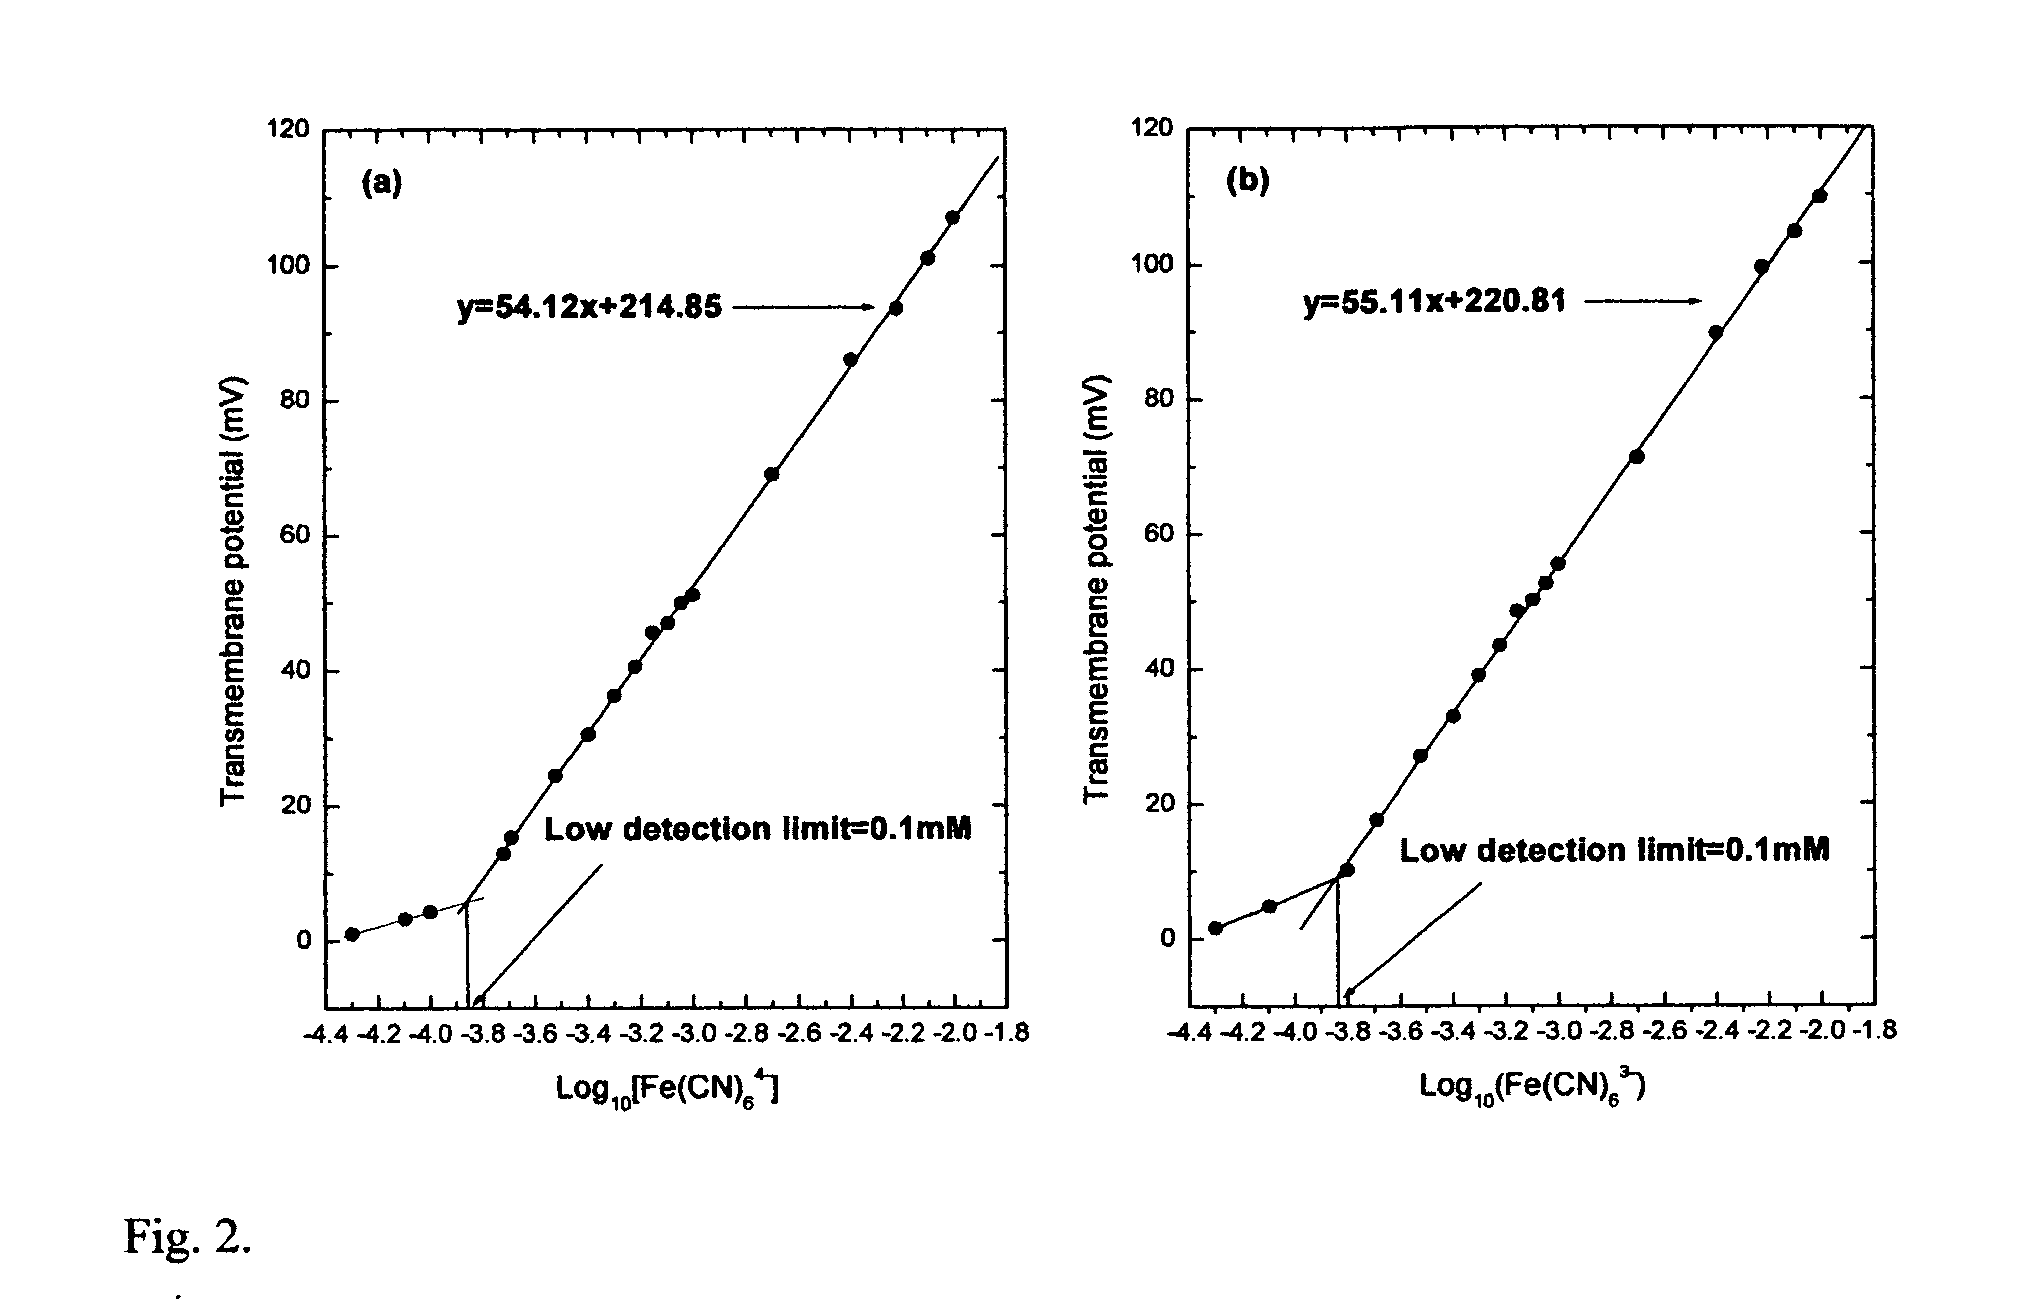
[0066]FIG. 2(a, b) presents the calibrations for Fe(CN)64− and Fe(CN)63− based on the maximum potential after each addition. Reducing and oxidizing species were added to the opposite sides of the membrane.
example 3
[0067]FIG. 3(a, b) demonstrates similar changes for Fe2+ and Fe3+, respectively. In all cases the initial potential was approximately zero, but it changed after addition of redox active components. The sign of potential in all cases corresponds to electron transport trough the membrane from the reducing to the oxidizing agent.
[0068]The slopes of calibration curves in all four cases were close to the ideal Nemstian slope of 59 mV per decade but decreased at low concentrations of the species. The lower detection limits estimated from the interception of the linear regressions for higher and lower concentration ranges for Fe(CN)64− / Fe(CN)63− and Fe2+ / Fe3+ were 0.1 mM and 0.2 mM, respectively.
PUM
 Abstract
Description
Claims
Application Information
 - R&D
- Intellectual Property
- Life Sciences
- Materials
- Tech Scout
- Unparalleled Data Quality
- Higher Quality Content
- 60% Fewer Hallucinations
Browse by: Latest US Patents, China's latest patents, Technical Efficacy Thesaurus, Application Domain, Technology Topic, Popular Technical Reports.
© 2025 PatSnap. All rights reserved.Legal|Privacy policy|Modern Slavery Act Transparency Statement|Sitemap|About US| Contact US: help@patsnap.com


