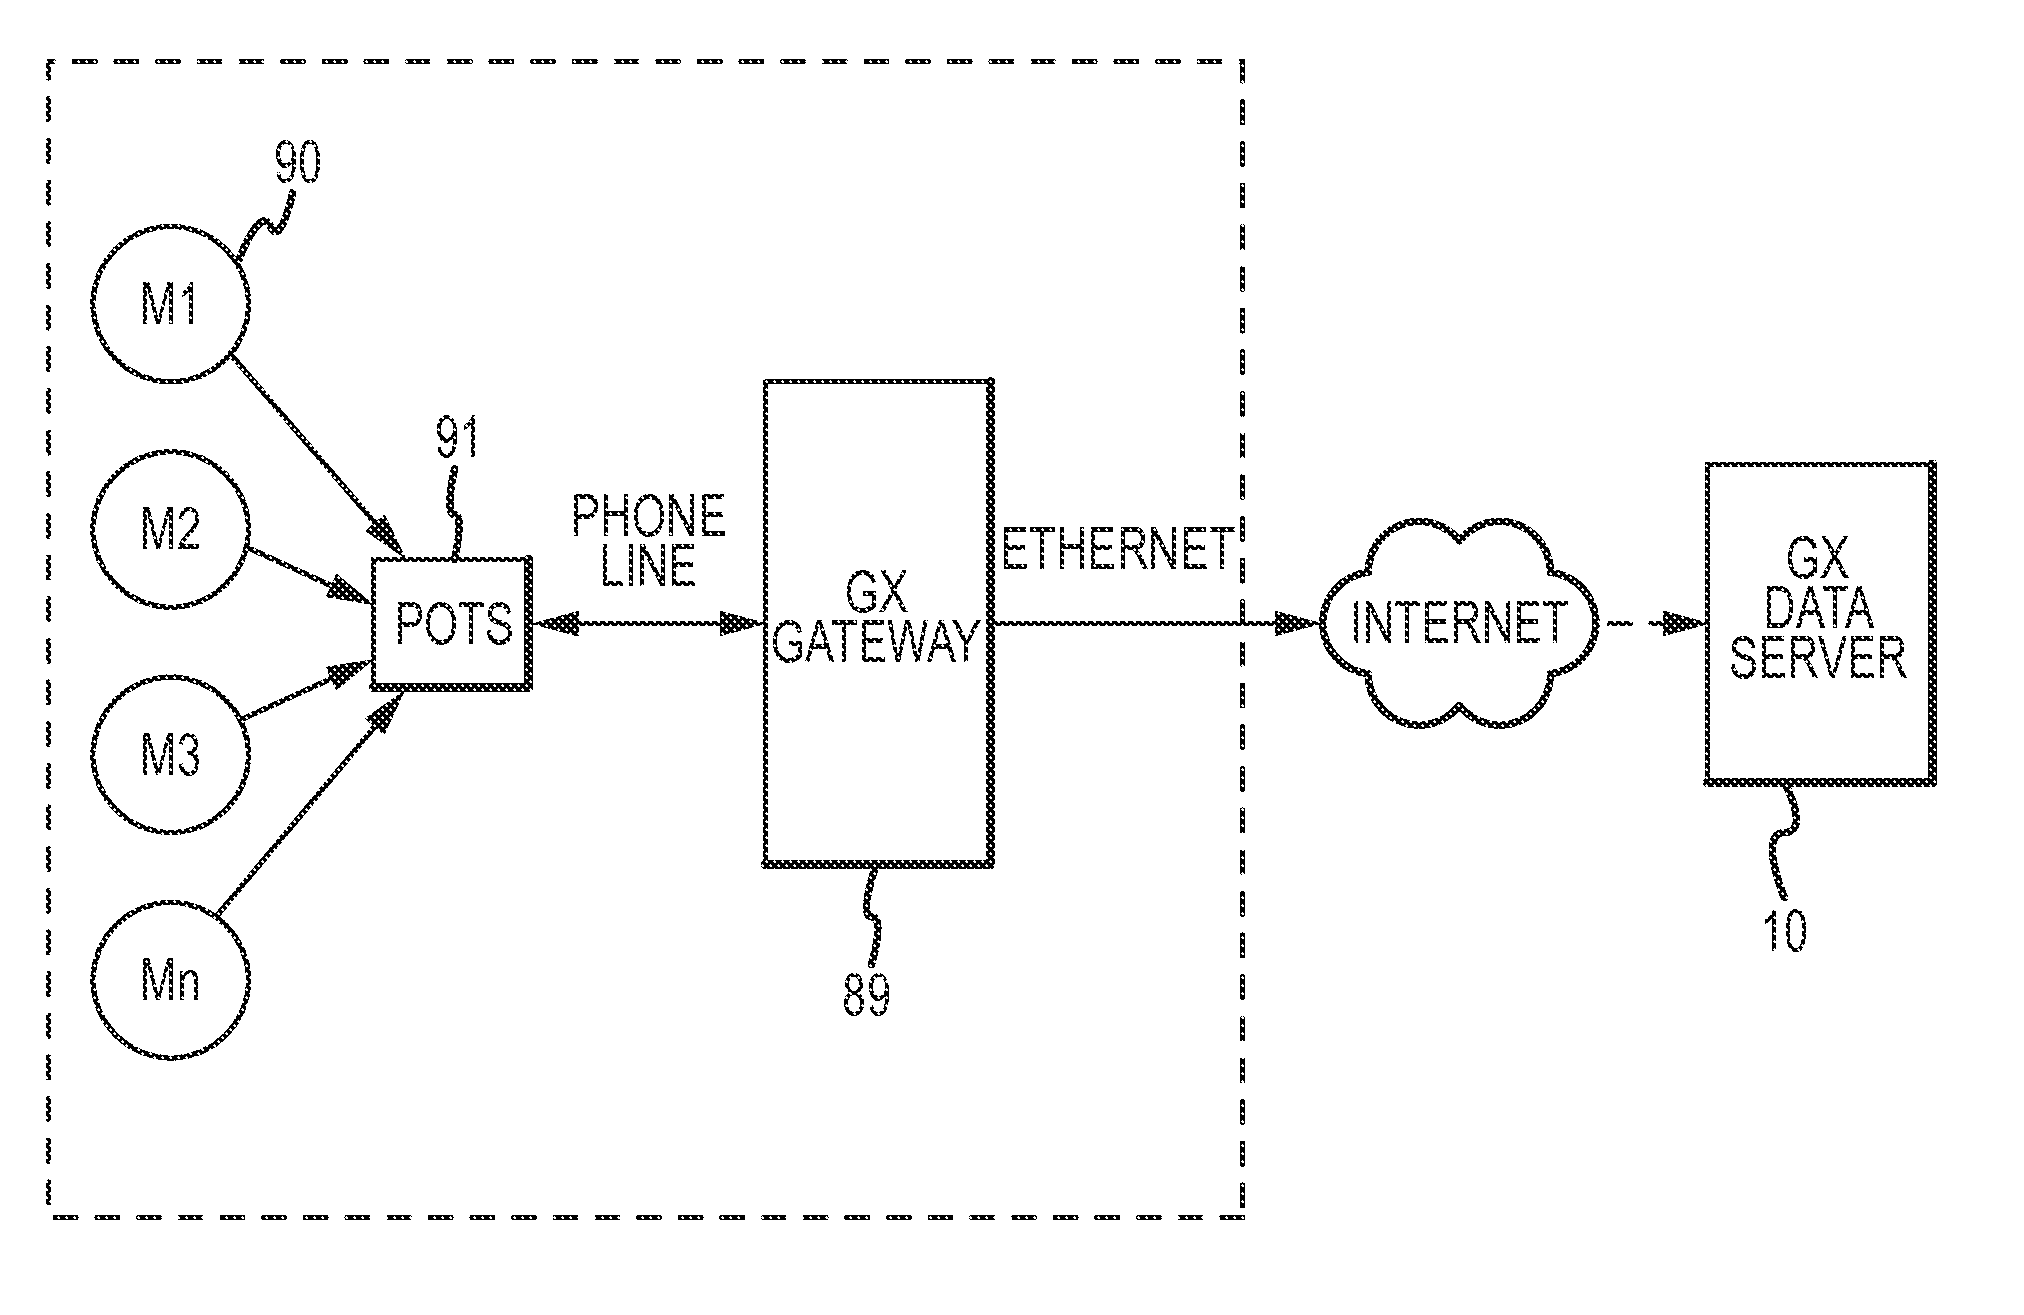
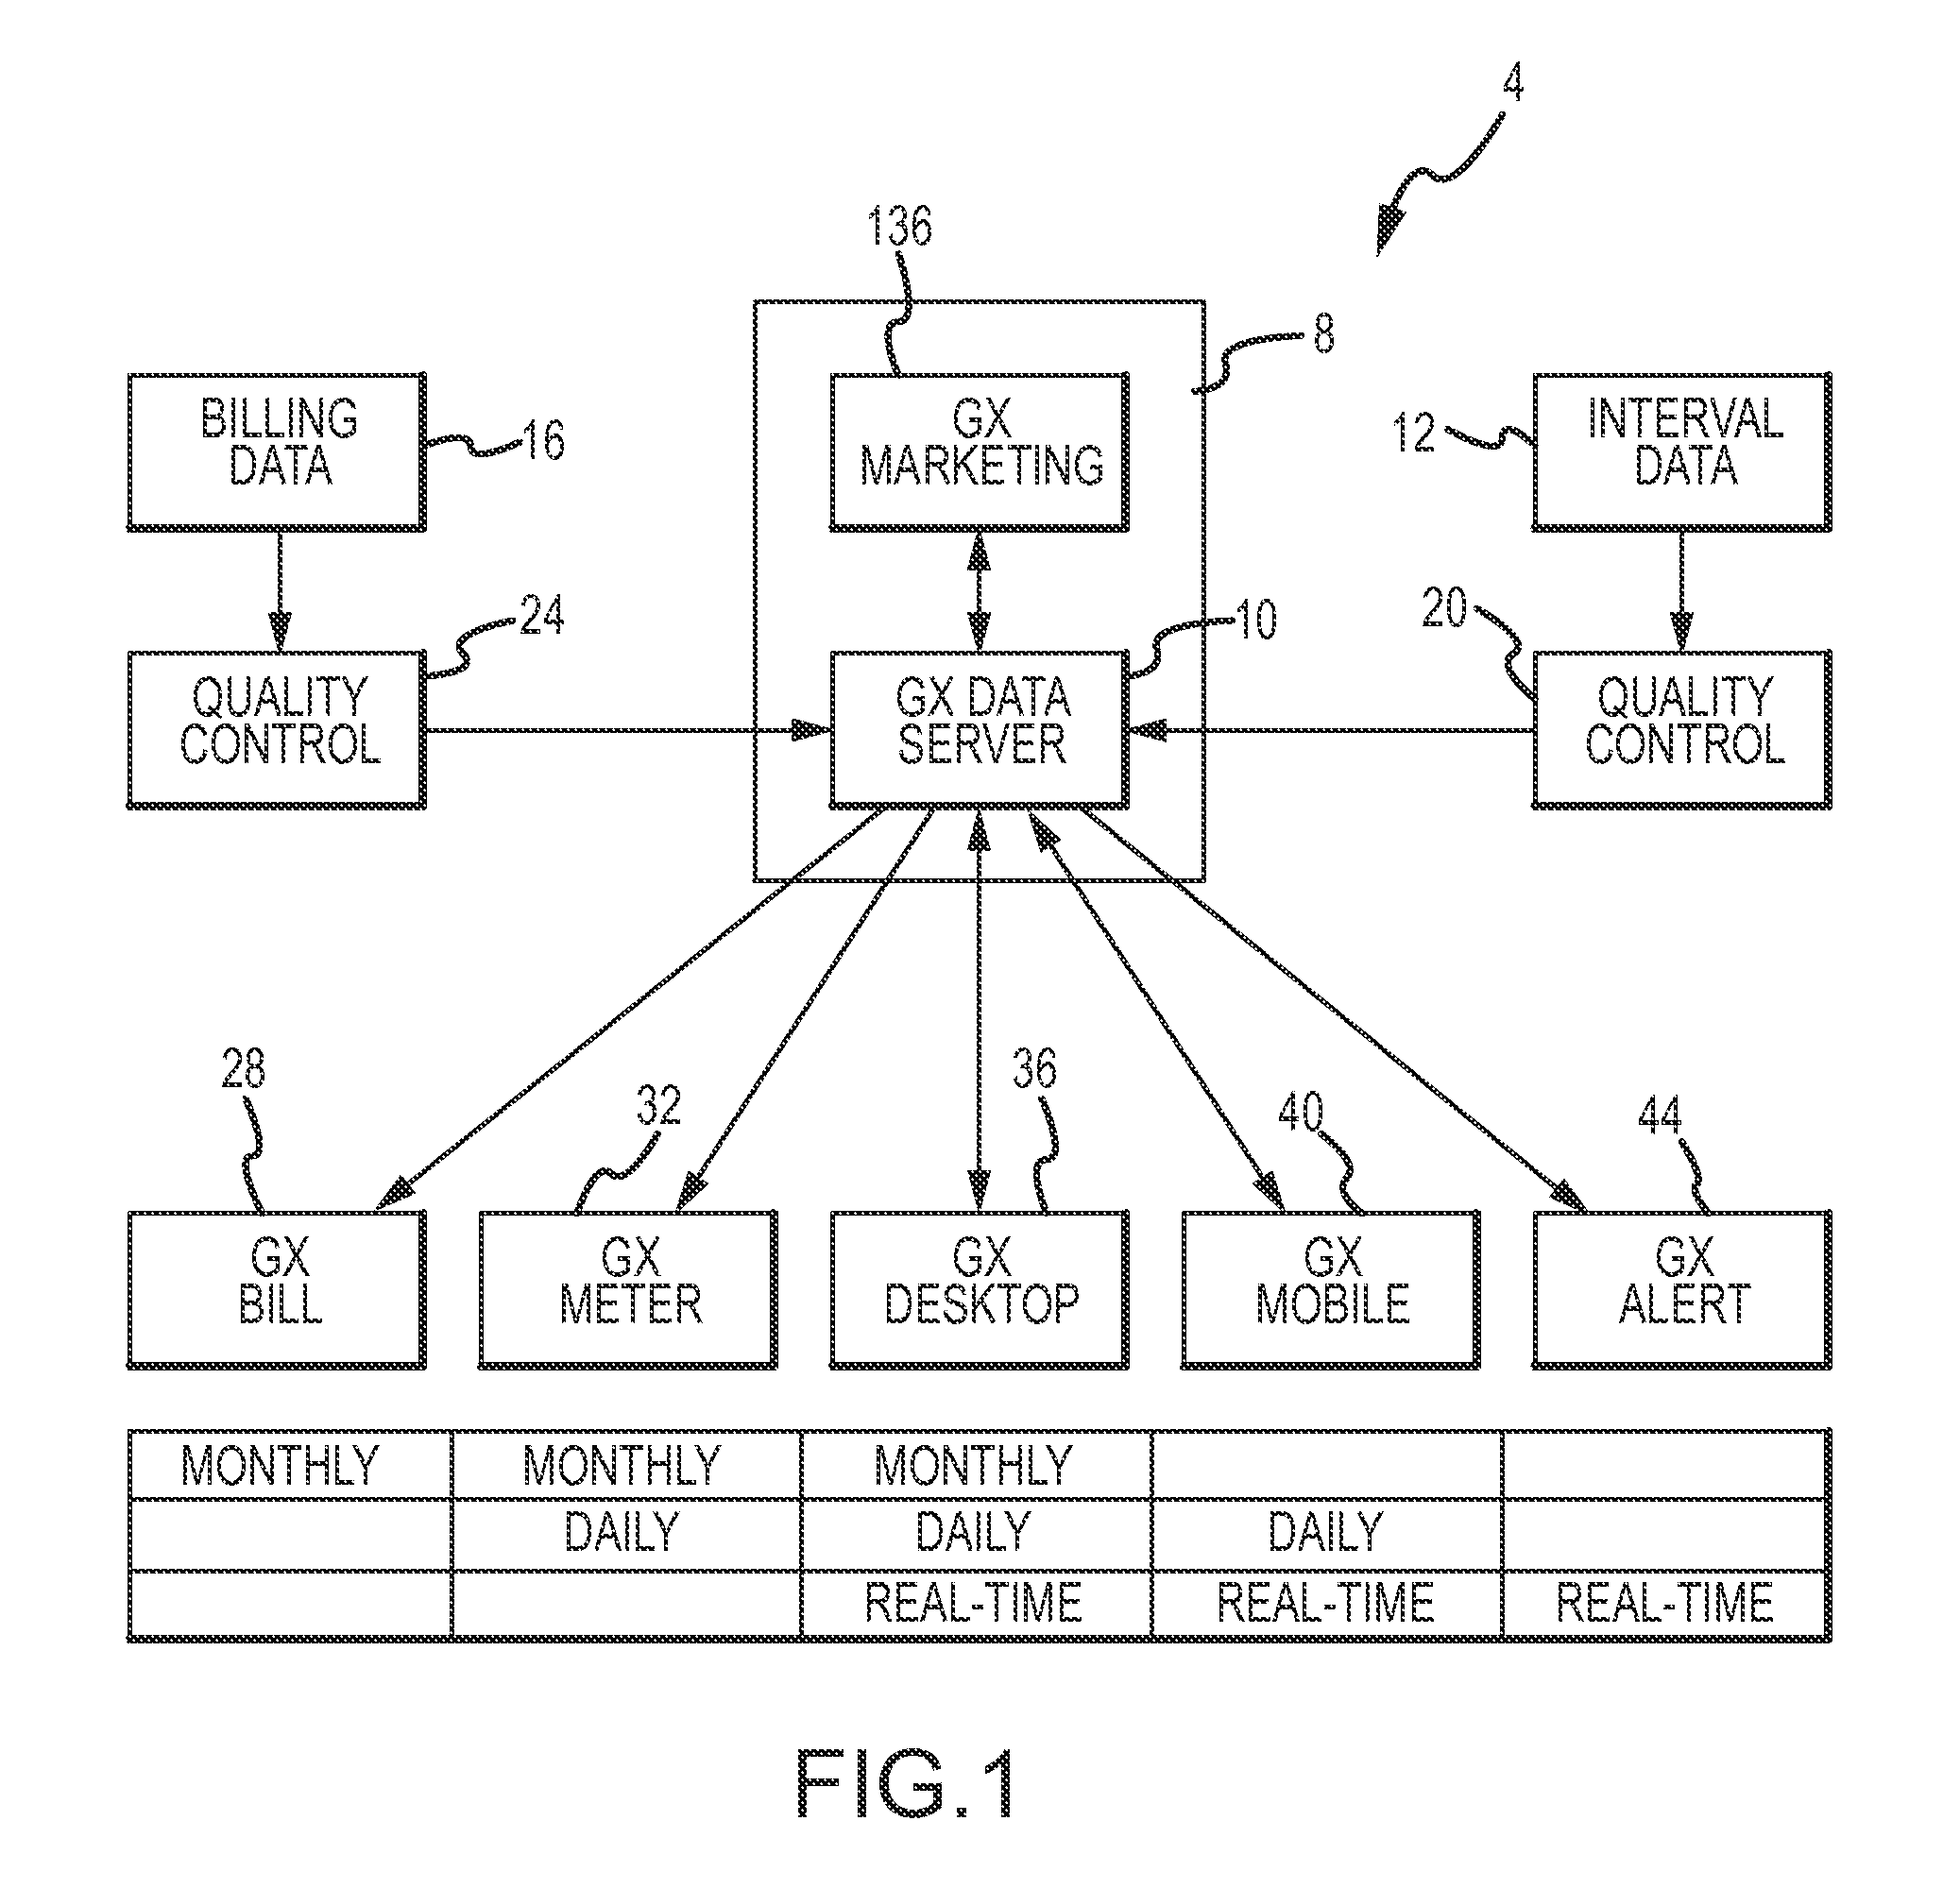
[0007]The inventor has discovered that utility consumers from smaller entities such as families and individuals to large entities such as manufacturing plants, government agencies and even utility providers themselves would benefit from methods and systems for delivering utility usage information (e.g., utility consumption and demand information) to such consumers with little effort on the part of the consumers in easy to utilize formats. Businesses of all sizes can benefit from such utility usage information to manage their energy costs and improve their environmental performance. The financial benefits of such utility usage information knowledge may be most important to businesses in which a larger percentage of their operating expenses are energy related. In all business sectors, there may be a significant marketing value for improved environmental performance. Utilities and regulatory agencies can benefit as they are typically mandated to reduce
energy demand (e.g., state and federal laws requiring more
energy conservation) and increase
alternative energy supply (e.g., solar, wind). Moreover, consultants, contractors and vendors may also benefit as they could increase revenue by designing, implementing and monitoring energy related projects.
[0009]According to a first aspect, a method for providing an analysis of utility
usage data (e.g., interval and billing data related to
electricity, gas, water) to an
end user is provided. Broadly, the method includes receiving utility
usage data related to the
end user at a
server system that includes at least one
memory module and at least one processor module, storing the utility usage data in the at least one
memory module of the
server system, and sending (e.g., pushing), using the at least one processor module, a first message to the user, the first message including an attachment (e.g., spreadsheet) that is operable to access the utility usage data. In this regard, the user or recipient of the message may receive a message (via the processor module) regarding updated or current utility usage data as soon as new data is available in the
server system (e.g., real-time, substantially real-time, daily, monthly). The method may allow users to analyze the utility usage information in numerous useful manners to more appropriately
exploit utilities while at the same time reducing costs for such exploitation. For instance, after
receipt of the spreadsheet and access of the utility usage data, the user can appropriately store the data on a local computing device (e.g., desktop,
laptop) and then run the spreadsheet on the same or a different computing device. As such, the user obtains the benefits of both desktop environments (e.g., fast and
secure computing) and web-based environments (e.g., ready access to data and no
software to download).
[0012]The spreadsheet attachment may be in the form of Microsoft Excel® which may utilize
Visual Basic for Applications (VBA) to improve the user experience and minimize the size of the spreadsheets along with the web query function to facilitate retrieval of the utility usage information from the
HTML webpage or other location. The user may opt to receive messages with attached spreadsheets in any desired increments such as daily, monthly, etc. The daily spreadsheet attachments generally may only be operable to incorporate current month data while monthly spreadsheet attachments may be operable to incorporate additional billing periods (e.g., up to 18 or more billing periods).
[0014]As another example, manipulation of another of the navigation buttons may be operable to display an
estimation of how the customer's total cost in one of the billing periods is calculated in the second region. For instance, the second region may display energy and power rates,
energy consumption and
power demand for the billing period, taxes and fees, etc, in
flowchart form. In this regard, the customer or other user may quickly and efficiently see exactly how a current bill is calculated to reduce
confusion and locate possible errors. Moreover, in some embodiments the display may include a toggle, drop-down menu or slide bar to allow the user to provide bill
estimation for other billing periods. As with the overview tool described above, manipulation of the
estimation navigation button may also be operable to display additional information regarding the estimation such as various multipliers used in the calculation, rates and credits. Other types of tools are contemplated for other types of utility usage
information analysis and can similarly include various types of graphical depictions, slide bars, drop-down menus and the like. Various
color coding can also be utilized to indicate
energy consumption versus
power demand or other aspects for instance.
[0019]According to another aspect, a method of providing an analysis of utility usage data to an
end user is disclosed. The utility usage data may be related to a plurality of previous utility billing periods before at least one previous utility billing period. The method includes providing a computing device having a
memory module and a processor, the processor operable to provide an analysis of utility usage data from at least one previous billing period of the plurality of previous billing periods, creating an email message to be pushed to an inbox of an end user, and pushing the email message to an email inbox of the end user. The pushed email message may include various sections related to utility usage such as at least one
customer identification record (e.g., customer description, facility name and address, account number, billing period), at least one analysis of utility usage data from the at least one previous billing period, and at least one marketing message with at least one indication of utility usage data based at least in part on at least one billing period of the plurality of previous billing periods. The marketing message may be related to external (e.g., customizable by the email report sponsor) or internal (e.g., related to the announcement or cross selling of complementary products) marketing. Among other advantageous attributes, the method delivers relevant utility usage
information analysis in a straightforward and efficient manner without requiring the user or customer to remember passwords or login names required for a website.
[0039]In some arrangements, the
data synchronization module may allow the customer or applications being operated by the customer to function as an occasionally connected internet
client or to otherwise engage in occasionally connected computing (OCC). In this regard, data (e.g., utility usage information) retrieved by the
data synchronization module may be utilized by the utility
usage analysis tool even when the user is not connected to a network or
the internet. The
data synchronization module may retrieve the utility usage data at any appropriate time (e.g., according to a predetermined schedule, in response to transmission
initiation by a user). In other arrangements, the utility usage information may be “sliced and diced” (e.g., parsed) either as part of the retrieval of the utility usage information from the
server system by the data synchronization module or else after such retrieval. For instance, thirty days of energy and gas usage information may be allocated proportionately across a number of intervals. Such allocation may create a more accurate financial depiction of utility changes as operational demands may vary on various facilities based on weekends, holidays,
special events, production schedules, and the like.


