Self-contained multivariate optical computing and analysis systems

a multi-variate, self-contained technology, applied in the field of spectroscopy analysis systems, can solve the problems of inability to accurately measure the data relating to one, unacceptably inaccurate estimates, and difficult conversion of simple light intensity measurement to information, so as to improve measurement accuracy, reduce measurement noise, and improve information. the effect of measurement accuracy

Active Publication Date: 2010-07-22
HALLIBURTON ENERGY SERVICES INC
View PDF5 Cites 62 Cited by
  • Summary
  • Abstract
  • Description
  • Claims
  • Application Information

AI Technical Summary

Benefits of technology

[0027]Since multivariate optical element (MOE)-based MOC uses detectors that see all wavelengths emanating from an illumination source simultaneously—including wavelengths that carry no information—measurement noise is reduced and measurement precision is increased in the system of the present disclosure by making the system sensitive primarily to wavelengths carrying information. Additionally, the present disclosure controls a spectral range of the illumination source by using bandpass filters or spectral elements having predetermined transmission characteristics. Further, in some aspect of the present disclosure, the system shines a light signal directly onto a sample and eliminates the use of, for instance, of a fiber optic probe; therefore, the component parts of the disclosure are simple and economical to manufacture, assemble and use, with improved signal when the attenuation typical of a fiber optic probe is removed. These and other aspects and advantages of the present disclosure will be apparent from the following description and the attached drawings, or can be learned through practice of the disclosure.
[0028]According to one embodiment of the present disclosure, an optical analysis system generally includes an illumination source for shining light or other radiative energy through a set of lenses. Light levels are maximized through the optical system to enhance transmission (reduce loss) of the light. The illumination source subsequently shines the light through a multi-window (e.g., 10-window) chopper wheel. The chopper wheel rotates, for instance, at 40 Hertz (Hz), which produces a light beam modulated at 400 Hz. A modulated light signal is beneficial for reliable performance of the photodetectors in the system. The light beam passes through one or more spectral elements or filters, which control the spectral region of the light, which passes through them (and onto a sample). The light is reflected by a turning mirror down the center of the sampling tube and focused by a lens on the sample. Light is reflected back by the sample through the lens and back down the sampling tube, past the turning mirror. The light passes through a beam splitter with reflects part of the light (“signal A”) through a multivariate optical element (MOE) and lens and onto a photodetector. Another part of the light (“signal B”) passes through a lens onto another photodetector and acts as a reference signal. The system measures signal A and signal B, and a ratio of the two signals can be used to measure a concentration of the sample, e.g., a chemical of interest. Additionally, monitoring of signal A and / or signal B independently, or in some combination, can provide other information, such as powder segregation, packing of materials, effect of particle size. More specifically, any algebraic combination of signals A and B can be used according to the disclosure; e.g., A and / or B independently; A divided by B; A plus B; A minus B; B divided by A; B minus A, etcetera. For example, a ratio of signal A to signal B can provide a chemical measurement; individually, A signal and / or B signal can provide other homogeneity measures including physical make-up of the sample, packing, particle size, and / or separate physical and chemical properties.

Problems solved by technology

In general, a simple measurement of light intensity is difficult to convert to information because it likely contains interfering data.
It is often impossible to adequately measure the data relating to one of these factors since the contribution of the other factors is unknown.
Depending on the circumstances, however, the estimate may be unacceptably inaccurate since factors other than ethylene may affect the intensity of the wavelength bands.
Unfortunately, however, charge couple devices and their required operational instrumentation are very expensive.
Furthermore, the devices are sensitive to environmental conditions.
The power requirements, cooling requirements, cost, complexity and maintenance requirements of these systems have made them impractical in many applications.
While various methodologies have been developed to enhance measurement accuracy in Optical Analysis Systems, no design has emerged that generally encompasses all of the desired characteristics as hereafter presented in accordance with the subject technology.

Method used


Image

  • Self-contained multivariate optical computing and analysis systems
  • Self-contained multivariate optical computing and analysis systems
  • Self-contained multivariate optical computing and analysis systems

Examples


example i

System I

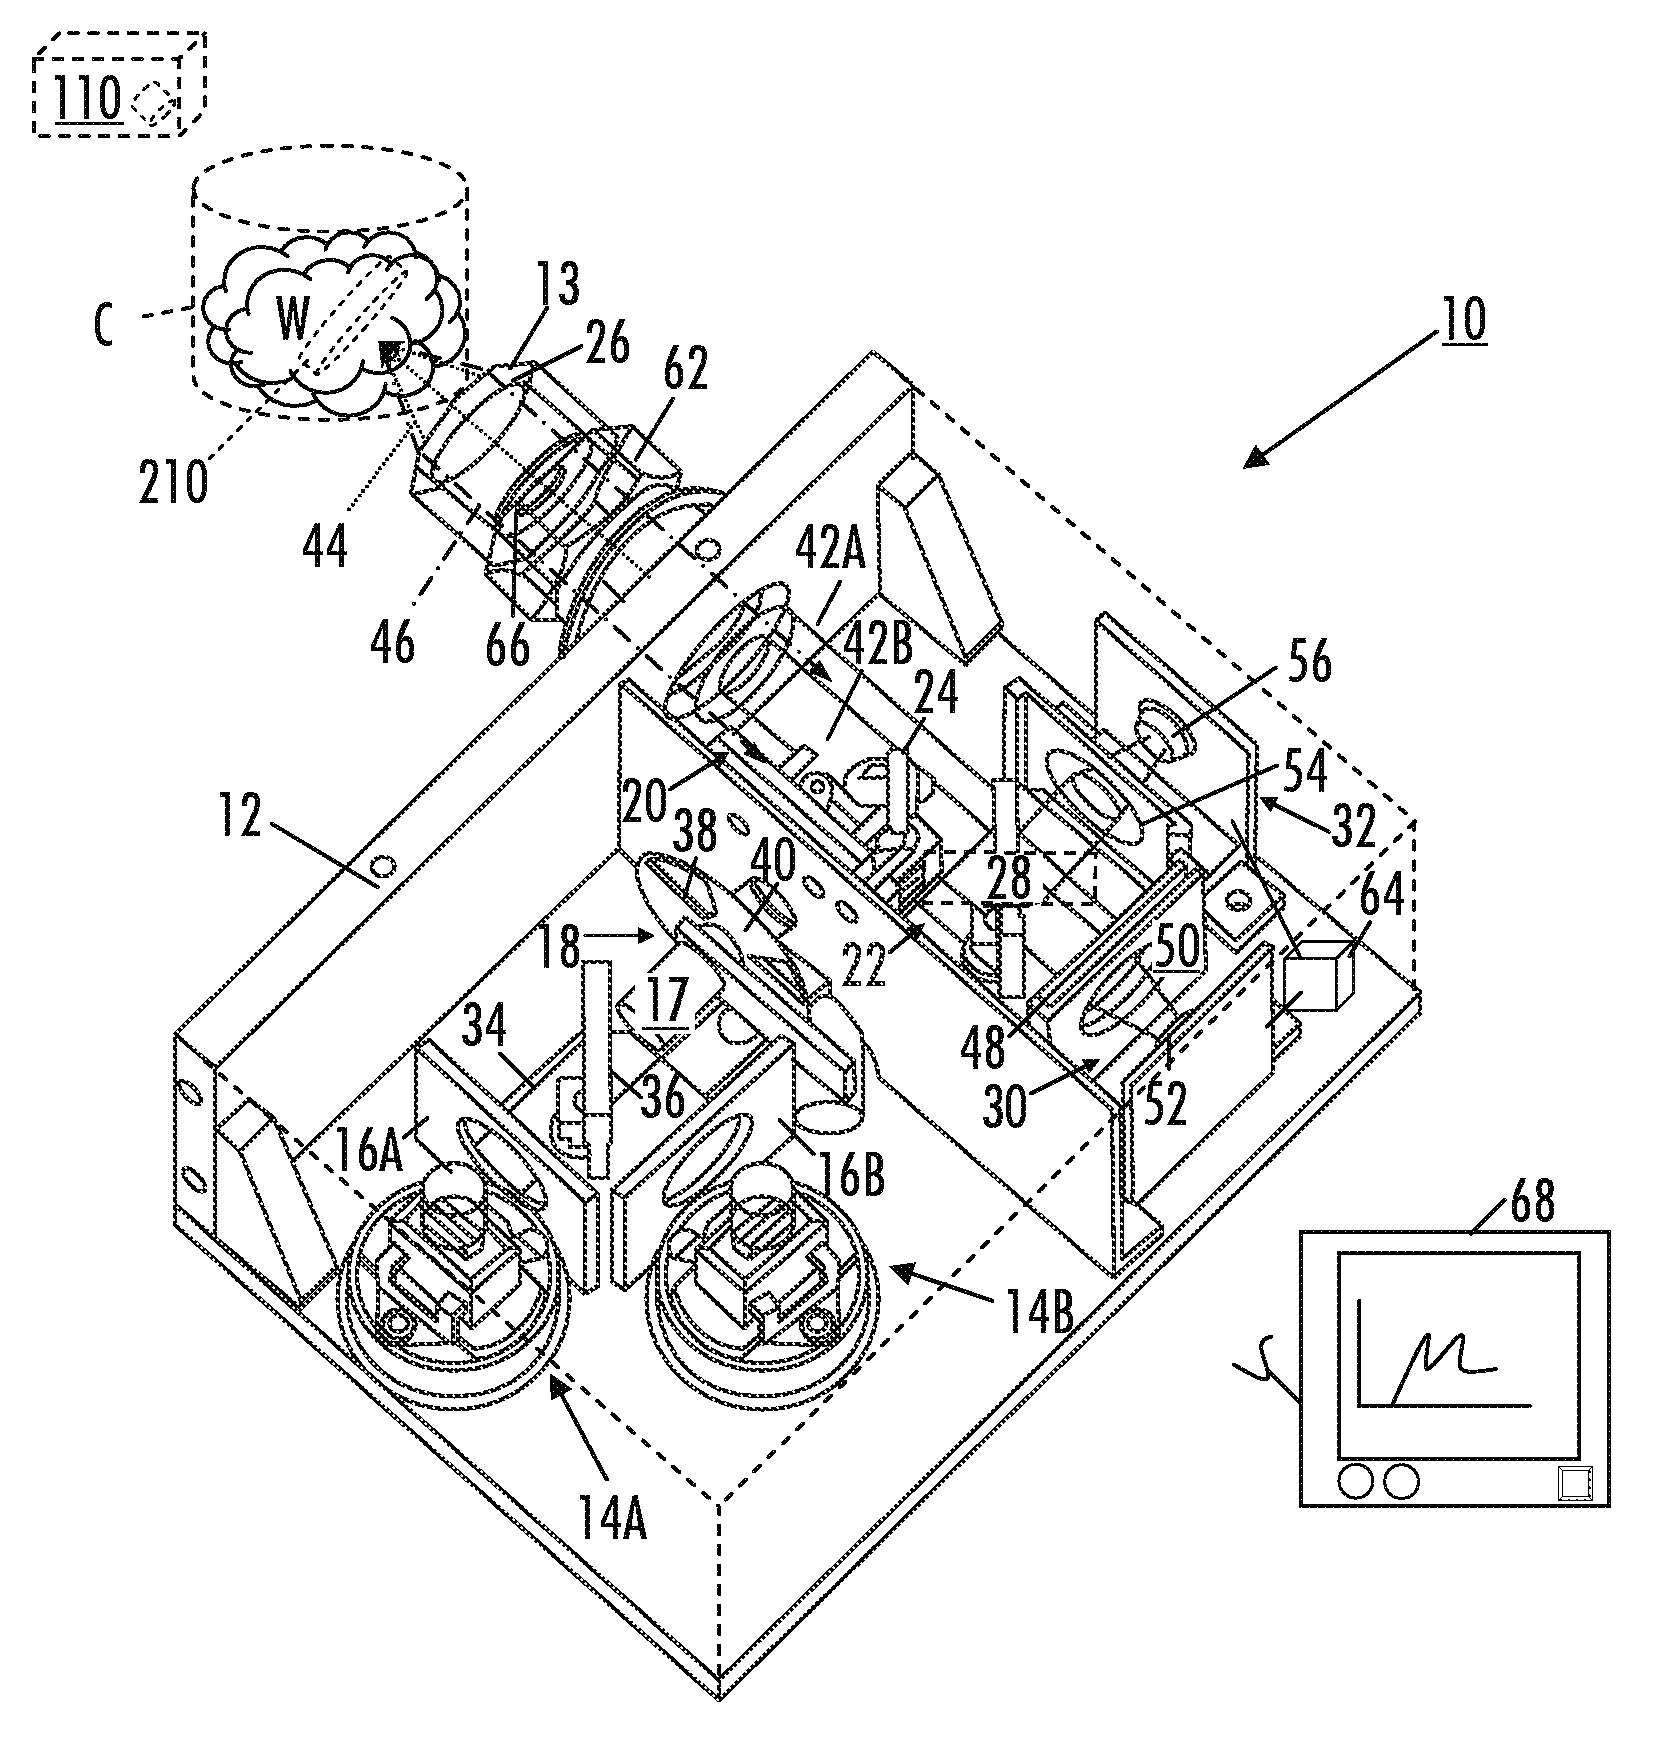
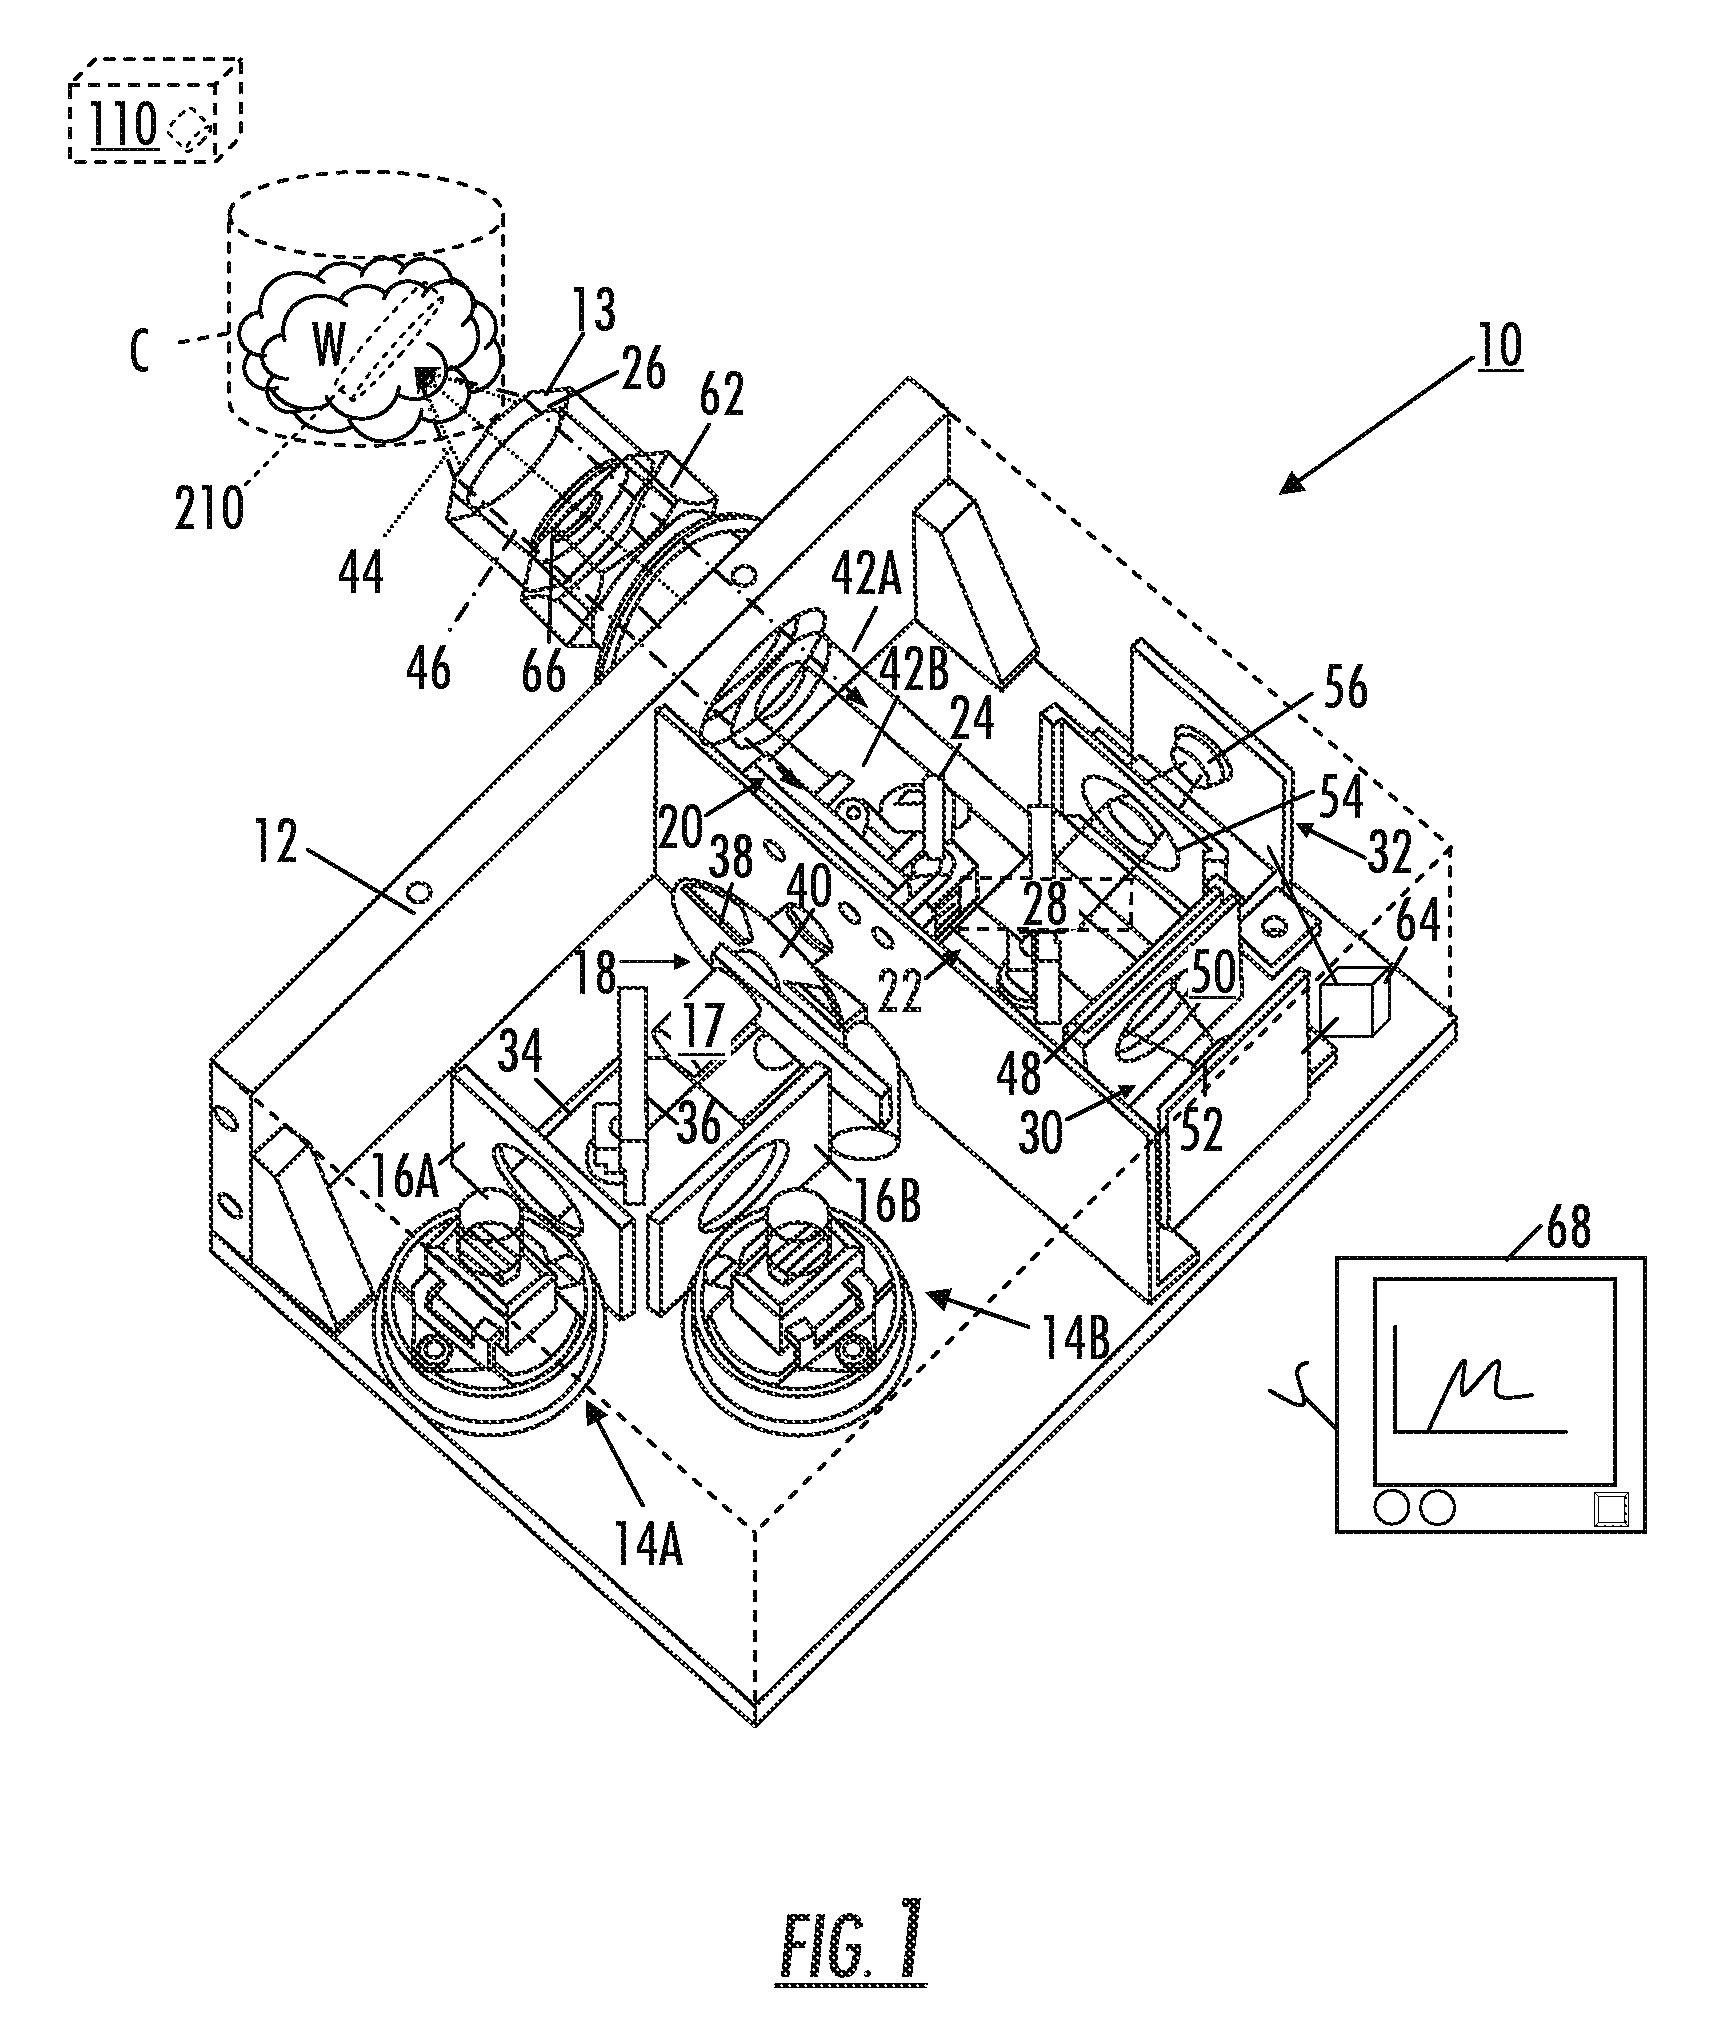
[0102]A system similar to the optical analysis system 10 shown in the figures was constructed and used to make static measurements on aspirin / lactose.

[0103]System I Components:

Illumination: 20 W Gilway lamp

Spectral elements: 5 mm D20, 5 mm Germanium

Optical window: none

Detector: PbS detector from New England Photoconductor

MOE: specific to test conditions.

[0104]Procedure and Results of Static Testing Using System I:

[0105]A powdered sample with a known composition was placed in a dish and the system light beam was focused on the powder. The output of the detectors was monitored and recorded. Aspirin / lactose samples covering the range of 100% aspirin to 100% lactose were tested.

example ii

System II

[0106]A system similar to the optical analysis system 10 shown in the figures was constructed and used to make dynamic measurements on aspirin / lactose.

[0107]System II Components:

Illumination: 20 W Gilway lamp

Spectral elements: 5 mm D20, 5 mm Germanium

Optical window: sapphire window

Detector: PbS detector from New England Photoconductor MOE: specific to test conditions.

[0108]Procedure and Results of Dynamic Testing Using System II:

[0109]The Aspirin / Lactose testing was made on a mixer bowl containing lactose and the system measured as aspirin was added to the system and mixed. Specifically, lactose powder was placed in the bowl of a mixer and the measurement system was attached the bowl using a Swagelok® brand fitting. A sapphire window was used to contain the powder in the bowl and allow the system to interrogate the powder. With the mixer turning, known amounts of aspirin were added and the system output signal was monitored and recorded. Aspirin was added in several allotme...

example iii

System III

[0110]A system similar to the optical analysis system 10 shown in the figures was constructed and used to make static measurements on aspirin / lactose.

[0111]System III Components:

Illumination: 5 W Gilway lamp

Spectral elements: 5 mm D20, 5 mm Germanium

Optical window: none

Detector: PbS detector from New England Photoconductor

MOE: specific to test conditions.

[0112]Procedure and Results of Dynamic Testing Using System III:


PUM


Abstract

An optical analysis system includes a light source configured to radiate a first light along a first ray path; a modulator disposed in the first ray path, the modulator configured to modulate the first light to a desired frequency; a spectral element disposed proximate the modulator, the spectral element configured to filter the first light for a spectral range of interest of a sample; a cavity in communication with the spectral element, the cavity configured to direct the first light in a direction of the sample; a conical mirror configured to convert the first light reflecting from the sample into a second light, the cavity being further configured to direct the second light; a beamsplitter configured to split the second light into a first beam and a second beam; an optical filter mechanism disposed to receive the first beam, the optical filter mechanism configured to optically filter data carried by the first beam into at least one orthogonal component of the first beam; a first detector mechanism in communication with the optical filter mechanism to measure a property of the orthogonal component to measure the data; a second detector mechanism configured to receive the second beam for comparison of the property of the orthogonal component to the second beam; an accelerometer configured to control the data acquisition such that only detector signals during the period of time when the system is in the proper orientation such that the material sample (e.g., aspirin) is in proximity to the interrogation window are used for calculation; a computer having a data acquisition and conversion card, the computer disposed in the system in communication with the first and second detector mechanisms for signal processing; and a battery and charging system disposed in the system in electrical communication with the system to provide stand-alone operation capability.

Description

CROSS-REFERENCE TO RELATED APPLICATIONS[0001]This application claims benefit of U.S. Provisional Application Ser. No. 60 / 864,047, filed on Nov. 2, 2006, and U.S. Provisional Application Ser. No. 60 / 891,826, filed on Feb. 27, 2007.FIELD OF THE DISCLOSURE[0002]The present disclosure relates to spectroscopy analysis systems. More particularly, the disclosure relates to a multivariate optical computing and analysis system, which is self-contained and capable of remote operation and control.BACKGROUND OF THE DISCLOSURE[0003]Light conveys information through data. When light interacts with matter, for example, it carries away information about the physical and chemical properties of the matter. A property of the light, for example, its intensity, may be measured and interpreted to provide information about the matter with which it interacted. That is, the data carried by the light through its intensity may be measured to derive information about the matter. Similarly, in optical communica...

Claims


Application Information

Patent Timeline
Patent Type & Authority Applications(United States)
IPC IPC(8): G01J3/28
CPCG01J3/02G01J3/0205G01J3/021G01J3/0264G01J3/4338G01N21/255G01N21/3563G01N21/35G01N21/4738G01N2021/1793G01N2201/0691G01N2201/0693G01N2201/1293G01N21/31
Inventor FREESE, ROBERT P.TEAGUE, TERRELL K.PERKINS, DAVID L.SOLTMANN, WILLIAM J.
Owner HALLIBURTON ENERGY SERVICES INC
Why Eureka
Try Eureka