Tablet analysis and measurement system

a technology of tabletops and measurement systems, applied in the field of optical analysis systems, can solve the problems of inability to accurately measure the data relating to one, unacceptably inaccurate estimates, and difficult conversion of simple light intensity measurement to information, and achieve the effects of reducing measurement noise, improving measurement accuracy, and being simple and economical to manufacture, assemble and us

Active Publication Date: 2012-05-22
HALLIBURTON ENERGY SERVICES INC
View PDF214 Cites 3 Cited by
  • Summary
  • Abstract
  • Description
  • Claims
  • Application Information

AI Technical Summary

Benefits of technology

[0025]Since multivariate optical element (MOE)-based MOC uses detectors that see all wavelengths emanating from an illumination source simultaneously—including wavelengths that carry no information—measurement noise is reduced and measurement precision is increased in a system of the present disclosure by making the system sensitive primarily to wavelengths carrying information. Additionally, the exemplary system controls a spectral range of the illumination source by using bandpass filters or spectral elements having predetermined transmission characteristics. Further, in some aspects of the present disclosure, the system shines a light signal directly onto a sample and eliminates the use of, for instance, a fiber optic probe; therefore, the component parts of the disclosure are simple and economical to manufacture, assemble and use, with improved signals when the attenuation typical of a fiber optic probe is removed. These and other aspects and advantages of the present disclosure will be apparent from the following description and the attached drawings, or can be learned through practice of the exemplary systems and methods according to the disclosure.
[0026]According to a particular embodiment of the present disclosure, an optical analysis system generally includes an illumination source for shining light or other radiative energy through a set of lenses. Light levels are maximized through the optical system to enhance transmission (reduce loss) of the light. The illumination source subsequently shines the light through a multi-window (e.g., 10-window) chopper wheel. The chopper wheel rotates, for instance, at 40 Hertz (Hz), which produces a light beam modulated at 400 Hz. A modulated light signal is beneficial for reliable performance of the photodetectors in the system.
[0033]In another aspect of the disclosure, an optical analysis system operating in a transmission configuration may be designed to improve a signal of interest. The light diversion path is designed to illuminate a sample, minimizing the amount of light going around the sample. This may be accomplished by focusing the light on the sample. By minimizing the light going around or past the sample, the associated noise in the signal is reduced. For a sample that is not round, a more elaborate lens or other focusing device may be utilized to produce a shaped beam to illuminate a larger portion of the sample than achievable from a round beam that does not exceed any dimension of the sample.

Problems solved by technology

In general, a simple measurement of light intensity is difficult to convert to information because it likely contains interfering data.
It is often impossible to adequately measure the data relating to one of these factors since the contribution of the other factors is unknown.
Depending on the circumstances, however, the estimate may be unacceptably inaccurate since factors other than ethylene may affect the intensity of the wavelength bands.
Unfortunately, however, charge couple devices and their required operational instrumentation are very expensive.
Furthermore, the devices are sensitive to environmental conditions.
The power requirements, cooling requirements, cost, complexity and maintenance requirements of these systems have made them impractical in many applications.

Method used


Image

  • Tablet analysis and measurement system
  • Tablet analysis and measurement system
  • Tablet analysis and measurement system

Examples


example ii

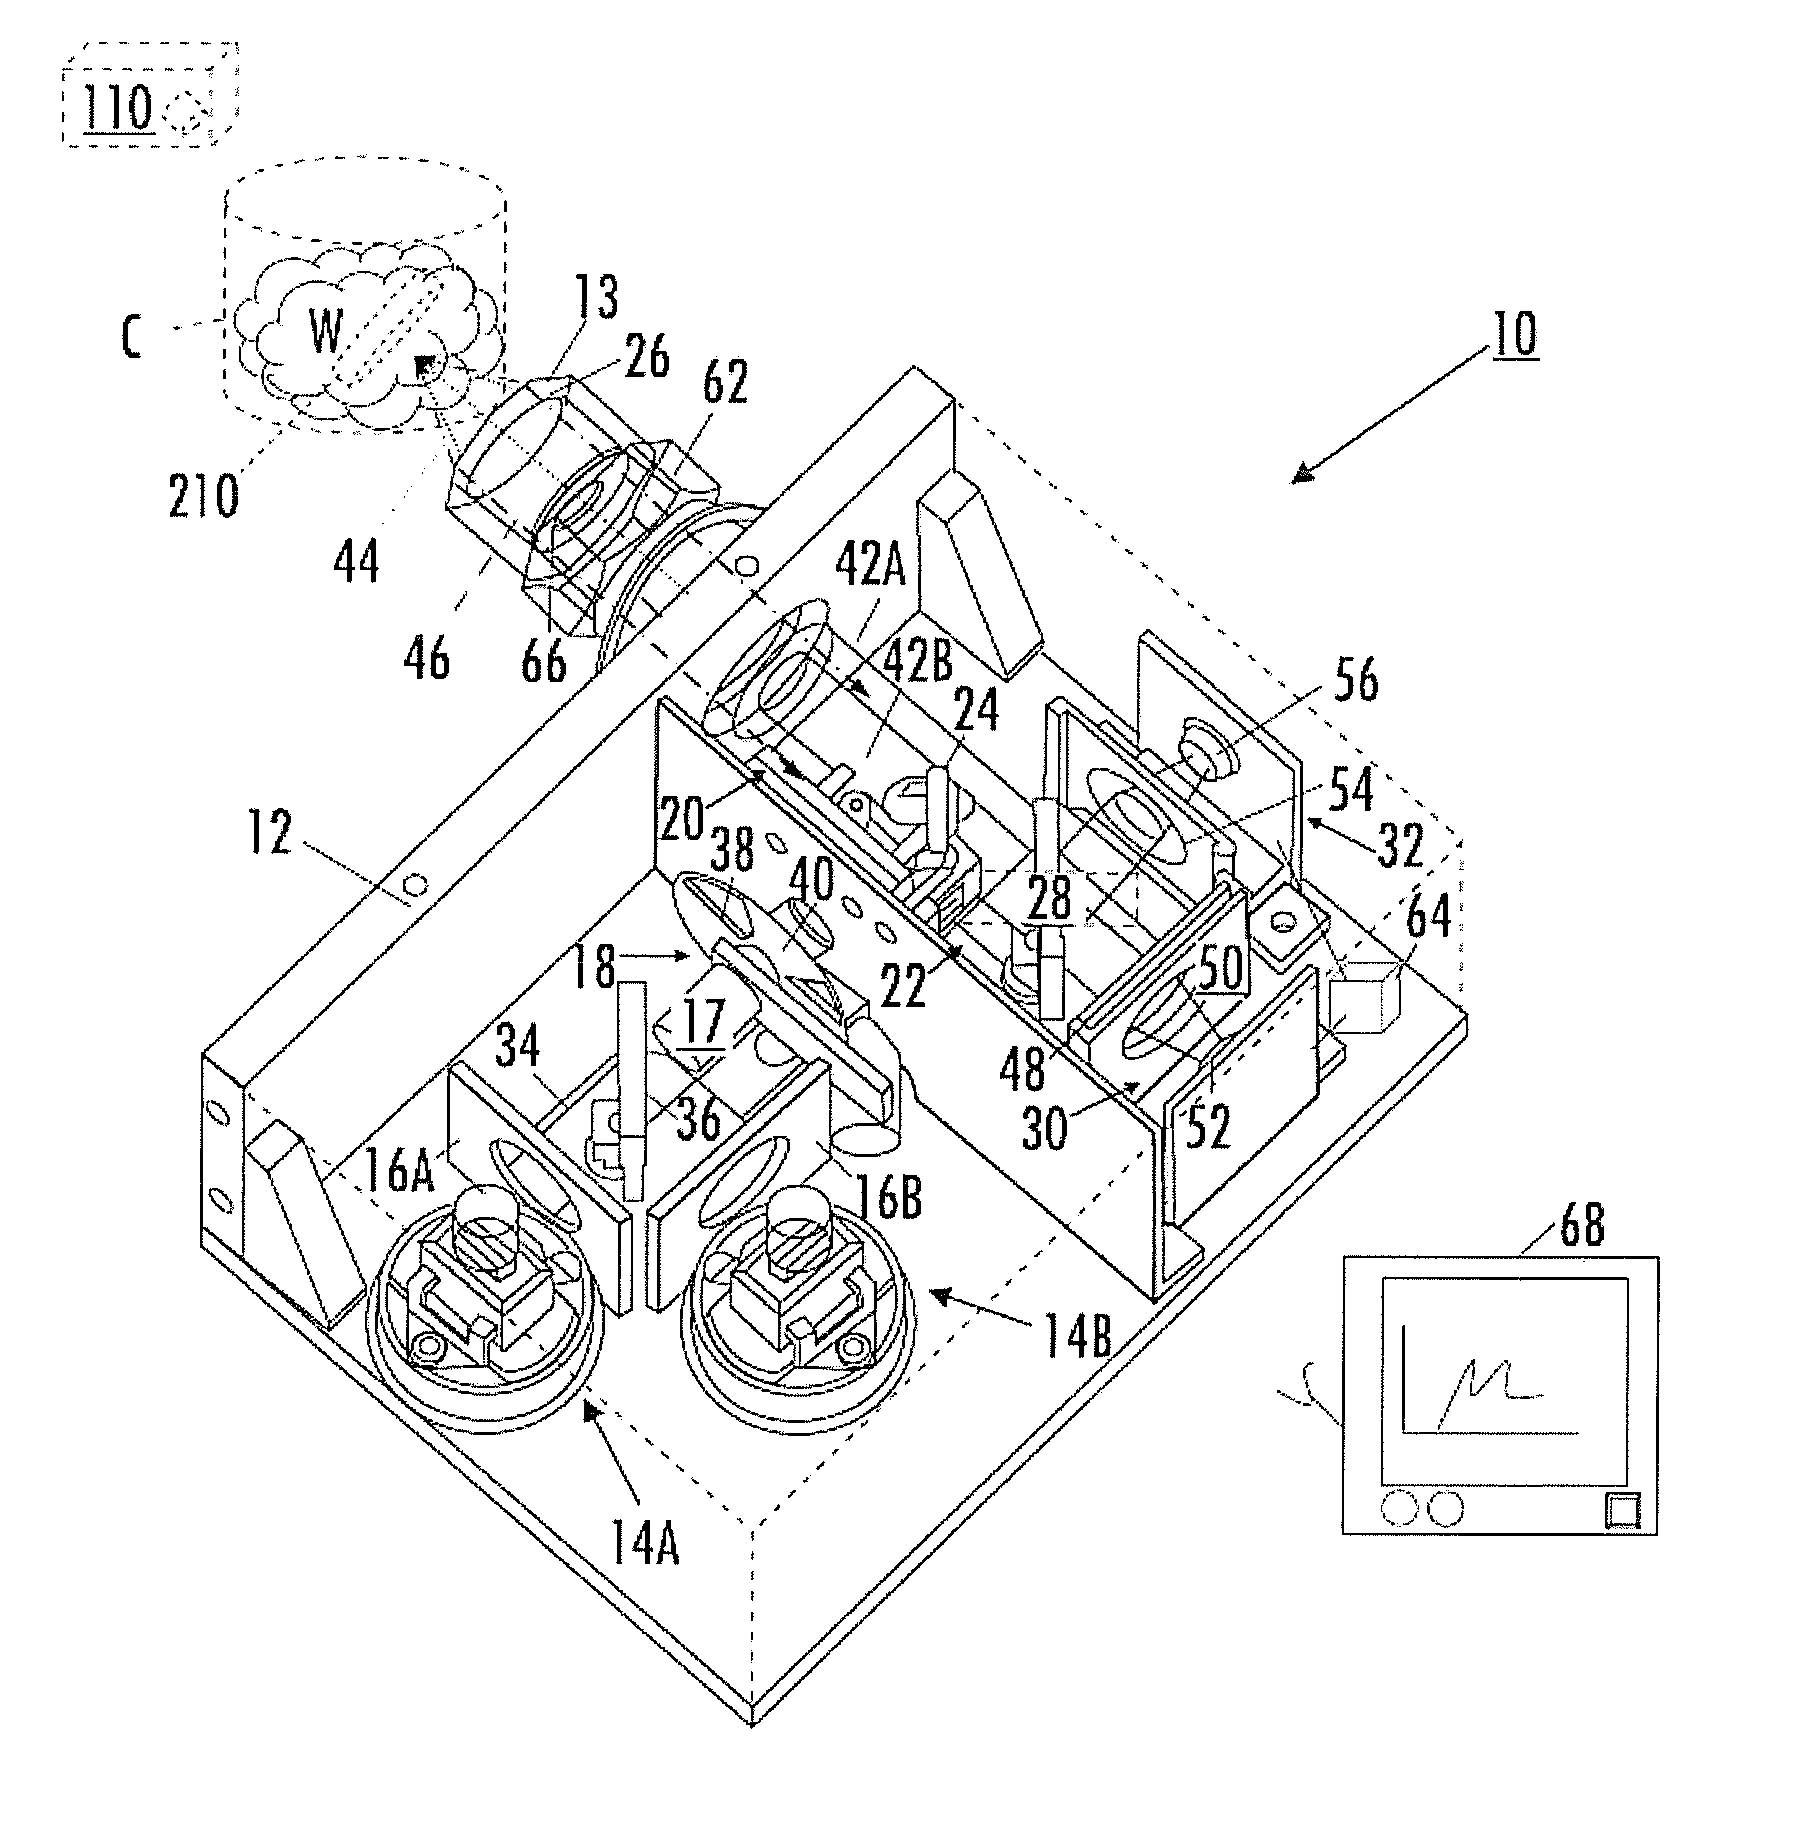
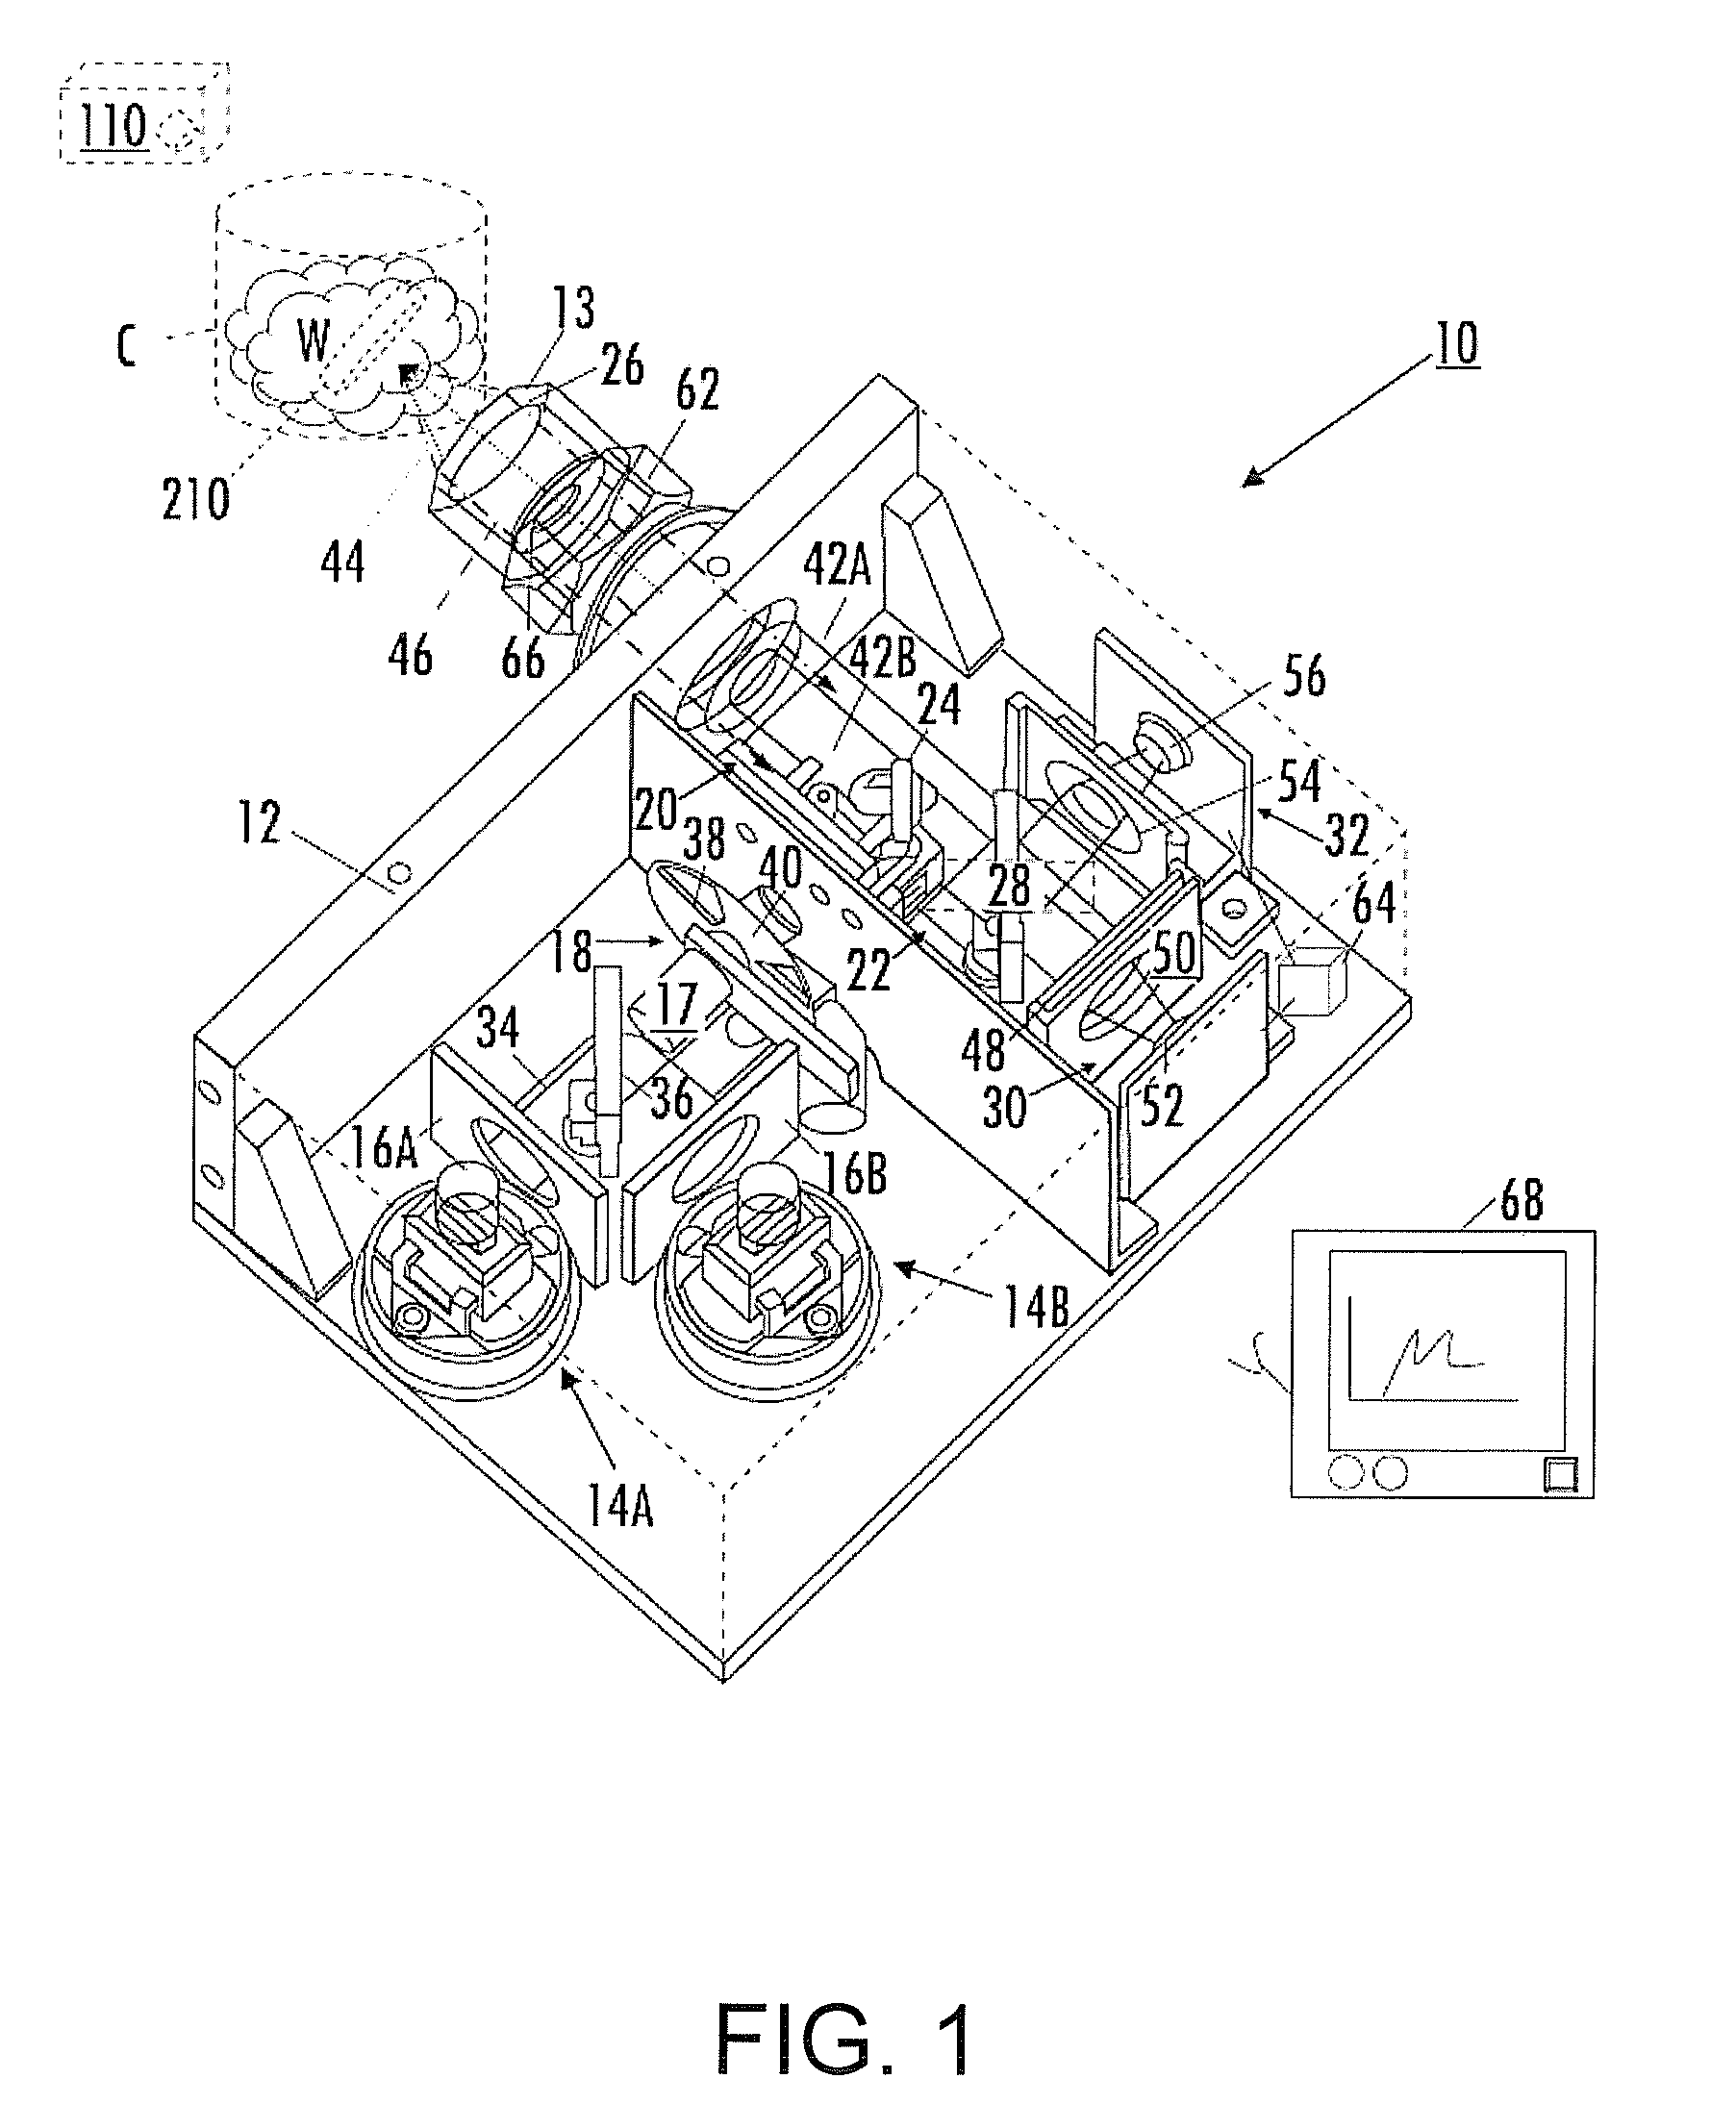
[0156 / System II corresponded to a system similar to the optical analysis system 10 shown in the figures was constructed and used to make static measurements on aspirin / lactose and included components as follows:[0157]Illumination: 20 W Gilway lamp[0158]Spectral elements: 5 mm D2O, 5 mm Germanium[0159]Optical window: none[0160]Detector: PbS detector from New England Photoconductor[0161]MOE: specific to test conditions.

[0162]Procedure and Results of static testing using System II: A powdered sample with a known composition was placed in a dish and the system light beam was focused on the powder. The output of the detectors was monitored and recorded. Aspirin / lactose samples covering the range of 100% aspirin to 100% lactose were tested.

[0163]Example III / System III corresponded to a system similar to the optical analysis system 10 shown in the figures was constructed and used to make dynamic measurements on aspirin / lactose and included components as follows:[0164]Illumination: 20 W Gil...

example iv

[0170 / System IV corresponded to a system similar to the optical analysis system 10 shown in the figures was constructed and used to make static measurements on aspirin / lactose and included components as follows:[0171]Illumination: 5 W Gilway lamp[0172]Spectral elements: 5 mm D2O, 5 mm Germanium[0173]Optical window: none[0174]Detector: PbS detector from New England Photoconductor[0175]MOE: specific to test conditions.

[0176]Procedure and Results of dynamic testing using System IV were similar to the examples above.

example v

[0177 / System V corresponded to a system similar to the optical analysis system shown FIG. 3 was constructed and used to make dynamic measurements of water / hydraulic fluid mixtures. System V components included:[0178]Illumination: 20 W Gilway lamp[0179]Spectral elements: 5 mm Germanium[0180]Optical window: sapphire window[0181]Detector: PbS detector from New England Photoconductor[0182]MOE: specific to test conditions.

[0183]Procedure and Results of testing using System V: Samples of automobile brake fluid were prepared with various levels of water; e.g., between 0% and 3% water. The liquid samples in quartz cuvettes with a 2 mm path length were analyzed using the system. The cuvettes were placed horizontally on a moving platter; the system was located above the platter; and the conical mirror was located below the platter.


PUM

PropertyMeasurementUnit
real timeaaaaaaaaaa
frequencyaaaaaaaaaa
frequencyaaaaaaaaaa

Abstract

The present subject matter relates to multivariate optical analysis systems employ multivariate optical elements and utilize multivariate optical computing methods to determine information about a product carried by light reflected from or transmitted through the product. An exemplary method of processing and monitoring the product includes introducing the product at an inspection point; illuminating the product with a spectral-specific light though an optic lens; directing the light that has passed through at least a section of the product through at least one multivariate optical element to produce a first signal, the directed light carrying information about the product; detecting the signal at a detector; and determining at least one property of the product based upon the detector output.

Description

CROSS-REFERENCE TO RELATED APPLICATION[0001]This application claims benefit of U.S. Provisional Patent Application, Ser. No. 60 / 921,018 filed Mar. 30, 2007.FIELD OF THE INVENTION[0002]The present subject matter relates to optical analysis systems using real-time multivariate optical computing. Multivariate optical computing (MOC) is a predictive spectroscopy technique that incorporates a multi-wavelength spectral weighting directly into analytical instrumentation. More particularly, the present subject matter relates to methodologies of using multivariate optical computing systems to illuminate a sample in which information about the sample can be analyzed from reflected or transmitted light in real time or near real time.BACKGROUND OF THE DISCLOSURE[0003]Light conveys information through data. When light interacts with matter, for example, it carries away information about the physical and chemical properties of the matter. A property of the light, such as its intensity, may be mea...

Claims


Application Information

Patent Timeline
Patent Type & Authority Patents(United States)
IPC IPC(8): G01N21/00
CPCG01N21/25G01N2201/1293G01N21/31G01N21/9508
Inventor MYRICK, MICHAEL L.FREESE, ROBERT P.BLACKBURN, JOHNPERKINS, DAVID L.ZHELEZNYAK, LEONARDPRIORE, RYAN
Owner HALLIBURTON ENERGY SERVICES INC
Why Eureka
Try Eureka