Methods for mapping data into lower dimensions

Active Publication Date: 2010-10-28
VIRKAR HEMANT V
View PDF8 Cites 34 Cited by
  • Summary
  • Abstract
  • Description
  • Claims
  • Application Information

AI Technical Summary

Benefits of technology

[0017]It is desirable to create projections of high dimensional date into lower dimensions, not only for more accurate visualization and display, but also to enhance discovery from high dimensional data. Describing data in a lower dimensional subspace would allow th

Problems solved by technology

Accessing such data in a meaningful way is posing an increasing challenge both in the presentation of information to an end user and in the rapid summary of database content.
Historically, the first computer accessing methods were limited to sequential views and storage of the data.
Computational tools and mathematical models have made progress in providing methods for data mining, but the details of using these tools remain largely the province of separate groups of specialists, and are not always effectively utilized in the broader community.
Complex datasets with high dimensionality pose particular challenges for analysis and accurate representation in two-dimensional graphics.
Computational resources required for analysis can be prohibitive, and grasping complex mathematical solutions can be difficult for experts in the data field who are not mathematicians.
One approach to presentation of large-scale data has been the use of pseudo-three dimensional representations, but distortions are easily introduced when reducing the representation of high dimensional data to such a small number of dimensions.
Inaccurate representations are a barrier to understanding and to data discovery.
Methods in common use to display lar

Method used


Image

  • Methods for mapping data into lower dimensions
  • Methods for mapping data into lower dimensions
  • Methods for mapping data into lower dimensions

Examples


example 1

AML / ALL Data Model that Visualizes the Svm Solution and Combines Supervised and Unsupervised Methods into a Single Visual Data Model

[0144]Training data was obtained from a gene expression dataset for AML vs ALL leukemia types publicly available from the Broad Institute. This data was originally published by Golub et al, Science 286:531-537. (1999). The data contained 38 examples, 11 AML samples and 27 ALL samples, all from bone marrow of patients with the respective diseases. Training was conducted using an svm. Upon completion of training, the vector normal to the solution hyperplane was used as the x-axis. Principal components analysis was then used on the original full-featured data set. The first principal component was then ortho-normalized to the x-axis and the resulting vector used as the y-axis. The second principal component was then ortho-normalized to the first two axes and used as the z-axis.

[0145]Each example used in the training data was then represented as a point in ...

example 2

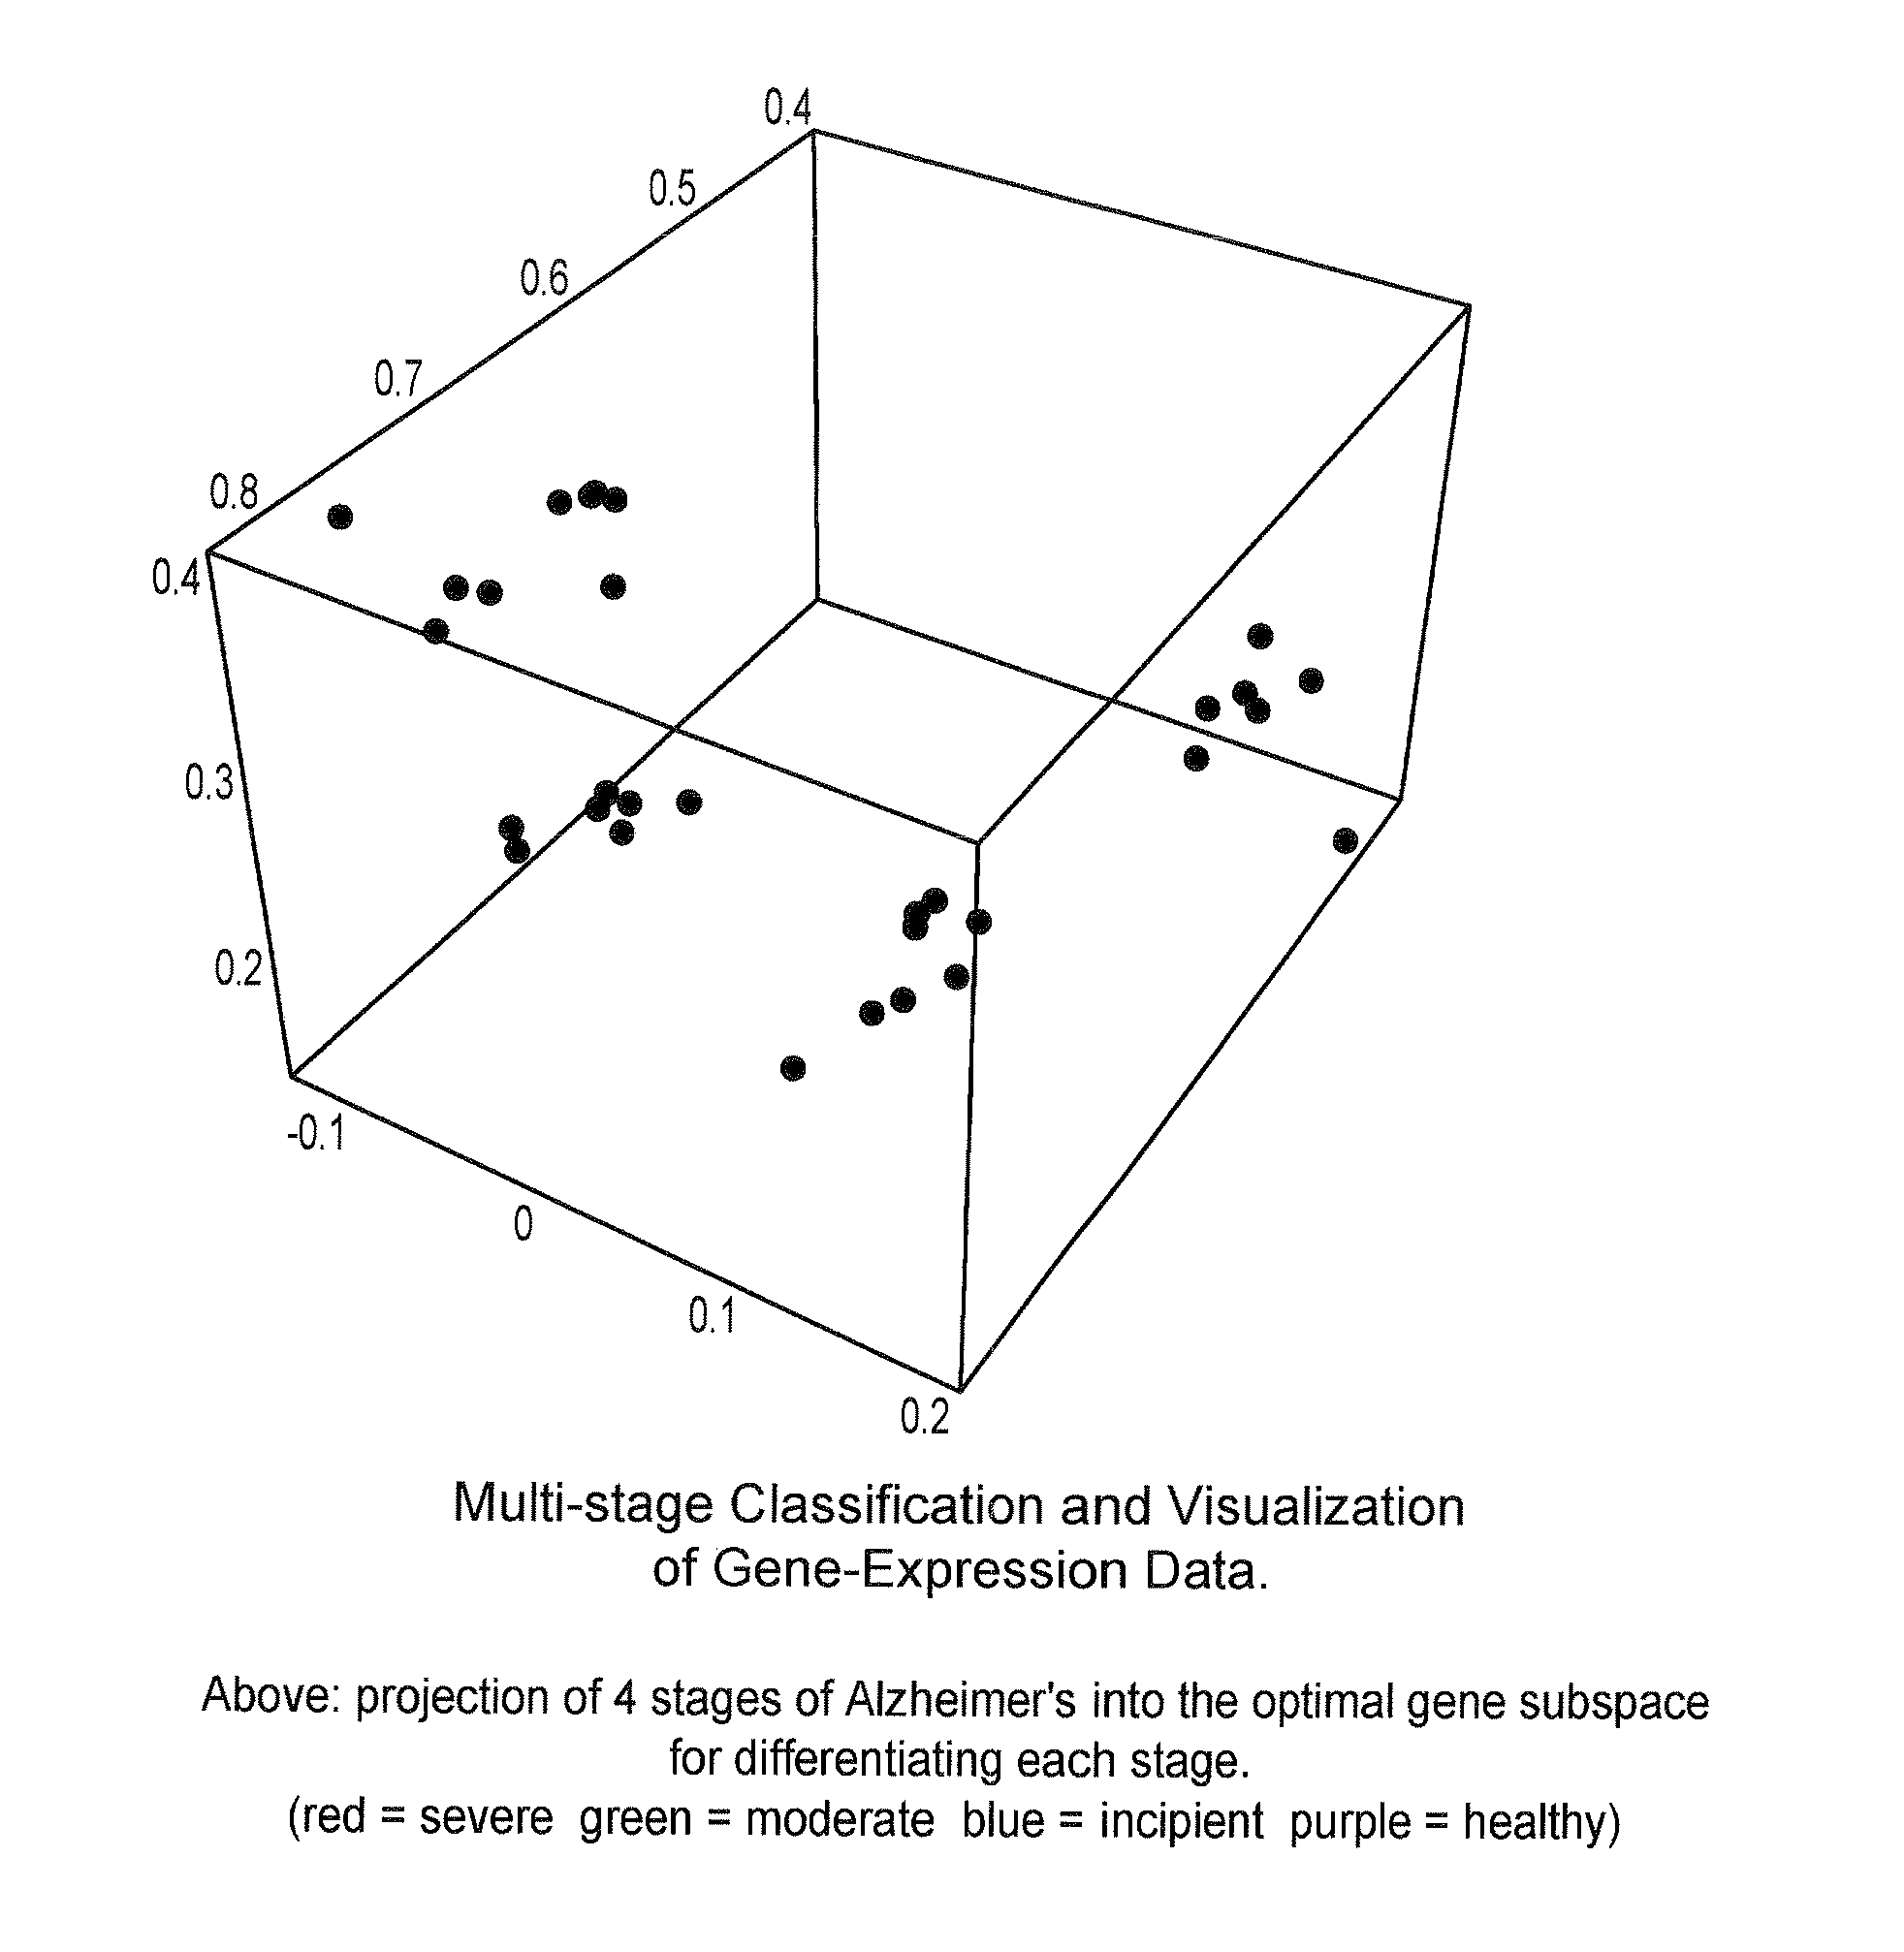
A Multiclass Alzheimer's Data Set with Visualization of Multiple Machine Learning Solutions and a Purely Supervised Model

[0150]To illustrate the use of the display method with multiple trained machines without resorting to the incorporation of any unsupervised methods to obtain visualization axes, a multi-class data set was used. Training data was obtained from the public data repository, GEO. A gene expression data set derived from postmortem brain tissue for Alzheimer's patients and patients with normal brains was used. The set consisted of 31 samples of post-mortem brain tissue in 4 classes: 9 healthy, 7 with incipient disease, 8 moderately diseased and 7 severely diseases samples. This gene expression data had been collected using Affymetrix chips containing probes for 22,215 genes as described in the journal article by Blalock et al (2004) PNAS 101 2173-2178. Each sample therefore contained levels for more than 22,000 genes.

[0151]To solve this classification problem, three clas...

example 3

Comparison of Visualization Obtained with the Current Invention to the Visualization of Unsupervised Methods Alone on a Sarcopenia Data Set

[0156]A publicly available data set was obtained from the GEO database.

[0157]Using methods available in the current state of the art, the data was analyzed using principle components analysis, and the first three principle components used to create axes. A java applet was created to visualize the results. The results presented graphically in FIG. 9. Each data example is shown as a single sphere, colored according to which of the two classes it belongs.

[0158]Next, using an svm, a separating hyperplane was found between the classes and the vector normal to it was selected as the x-axis. Principal component analysis was then used to create the second and third axes from the first and second principal components respectively. A java applet was created to visualize the results. The results are presented in FIG. 10, where each data example is shown as ...


PUM


Abstract

Methods and systems for creating ensembles of hypersurfaces in high-dimensional feature spaces, and to machines and systems relating thereto. More specifically, exemplary aspects of the invention relate to methods and systems for generating supervised hypersurfaces based on user domain expertise, machine learning techniques, or other supervised learning techniques. These supervised hypersurfaces may optionally be combined with unsupervised hypersurfaces derived from unsupervised learning techniques. Lower-dimensional subspaces may be determined by the methods and systems for creating ensembles of hypersurfaces in high-dimensional feature spaces. Data may then be projected onto the lower-dimensional subspaces for use, e.g., in further data discovery, visualization for display, or database access. Also provided are tools, systems, devices, and software implementing the methods, and computers embodying the methods and/or running the software, where the methods, software, and computers utilize various aspects of the present invention relating to analyzing data.

Description

RELATED APPLICATION DATA[0001]This application claims priority under 35 U.S.C. §119 to U.S. Provisional Application No. 61 / 172,380 filed on Apr. 24, 2009, the contents of which are incorporated herein by reference in their entirety.BACKGROUND OF THE INVENTION[0002]1. Field of the Invention[0003]Aspects of present invention generally relate to methods and systems for creating ensembles of hypersurfaces in high-dimensional feature spaces, and to machines and systems relating thereto. More specifically, exemplary aspects of the invention relate to methods and systems for generating supervised hypersurfaces based on user domain expertise, machine learning techniques, or other supervised learning techniques. These supervised hypersurfaces may optionally be combined with unsupervised hypersurfaces derived from unsupervised learning techniques. Additional exemplary aspects of the invention relate to methods and systems for generating supervised hypersurfaces based on user domain expertise,...

Claims


Application Information

Patent Timeline
IPC IPC(8): G06F17/10G06N3/08G06N20/10
CPCG06K9/6232G06N99/005G06K9/6254G06N20/00G06N20/10G06F18/41G06F18/213
Inventor VIRKAR, HEMANTSTARK, KARENBORGMAN, JACOB
Owner VIRKAR HEMANT V
Why Eureka
Try Eureka