Biomarkers for trichogenicity
a biomarker and cell technology, applied in biochemistry equipment and processes, instruments, material analysis, etc., can solve the problems of hair loss or alopecia, major limitation, and temporary effect of the treatment, and achieve the effect of enhancing the ability of cultured cells to induce hair loss
- Summary
- Abstract
- Description
- Claims
- Application Information
AI Technical Summary
Benefits of technology
Problems solved by technology
Method used
Image
Examples
example 1
Bioassay for Trichogenicity Evaluation
[0101]Aderans Hair Patch Assay™
[0102]Trichogenic activity of populations of dermal cells was determined by the Aderans Hair Patch Assay™ (Zheng, Y., J Invest Dermatol, 124: 867-876 (2005)). In this assay dissociated dermal and epidermal cells are implanted into the dermis or the subcutis of an immunoincompetent mouse. Using mouse newborn skin cells, new hair follicles typically form in this assay within 8 to 10 days. The newly formed follicle manifests normal hair shafts, mature sebaceous glands, and a natural hair cycle. Although normal cycling hair follicles are formed in this assay, the assay primarily measures the ability of cells or combinations of cells to form new follicles. Mouse dermal cells were assayed in conjunction with mouse neonatal epidermal cells as described (Zheng et al. 2005).
[0103]Results
[0104]Cultured human dermal cells or epidermal cells derived from scalp were assayed for their trichogenicity (hair inducing ability) by Ad...
example 2
MicroRNA Biomarkers of Trichogenicity
[0105]RNA Isolation
[0106]Total RNA or microRNA (miRNA) enriched small RNA fraction were isolated from human scalp derived dermal cells or epidermal cells cultured in serum-free growth media at culture passage P-1 using commercially available kits (Ambion) for RNA isolation. RNA samples were used for DNA microarrays to identify candidate markers for trichogenicity (hair-inducing capability) that were further evaluated by Quantitative Real-Time PCR (qRT-PCR).
[0107]Gene Profiling
[0108]Gene profiles were obtained using total RNA from trichogenic (bioassay positive) or non-trichogenic (bioassay negative) cultured human cells using Affymetrix gene arrays (Human U133Plus 2.0—Whole Genome). RNA from mouse cells were gene profiled for differentially regulated genes between trichogenic and non-trichogenic samples using Affymetrix arrays MOE 430A and MOE 430B. MicroRNA gene candidates were identified by microRNA profiling using mirVana™ miRNA Bioarray 1566 ...
example 4
Variation of Biomarker Expression
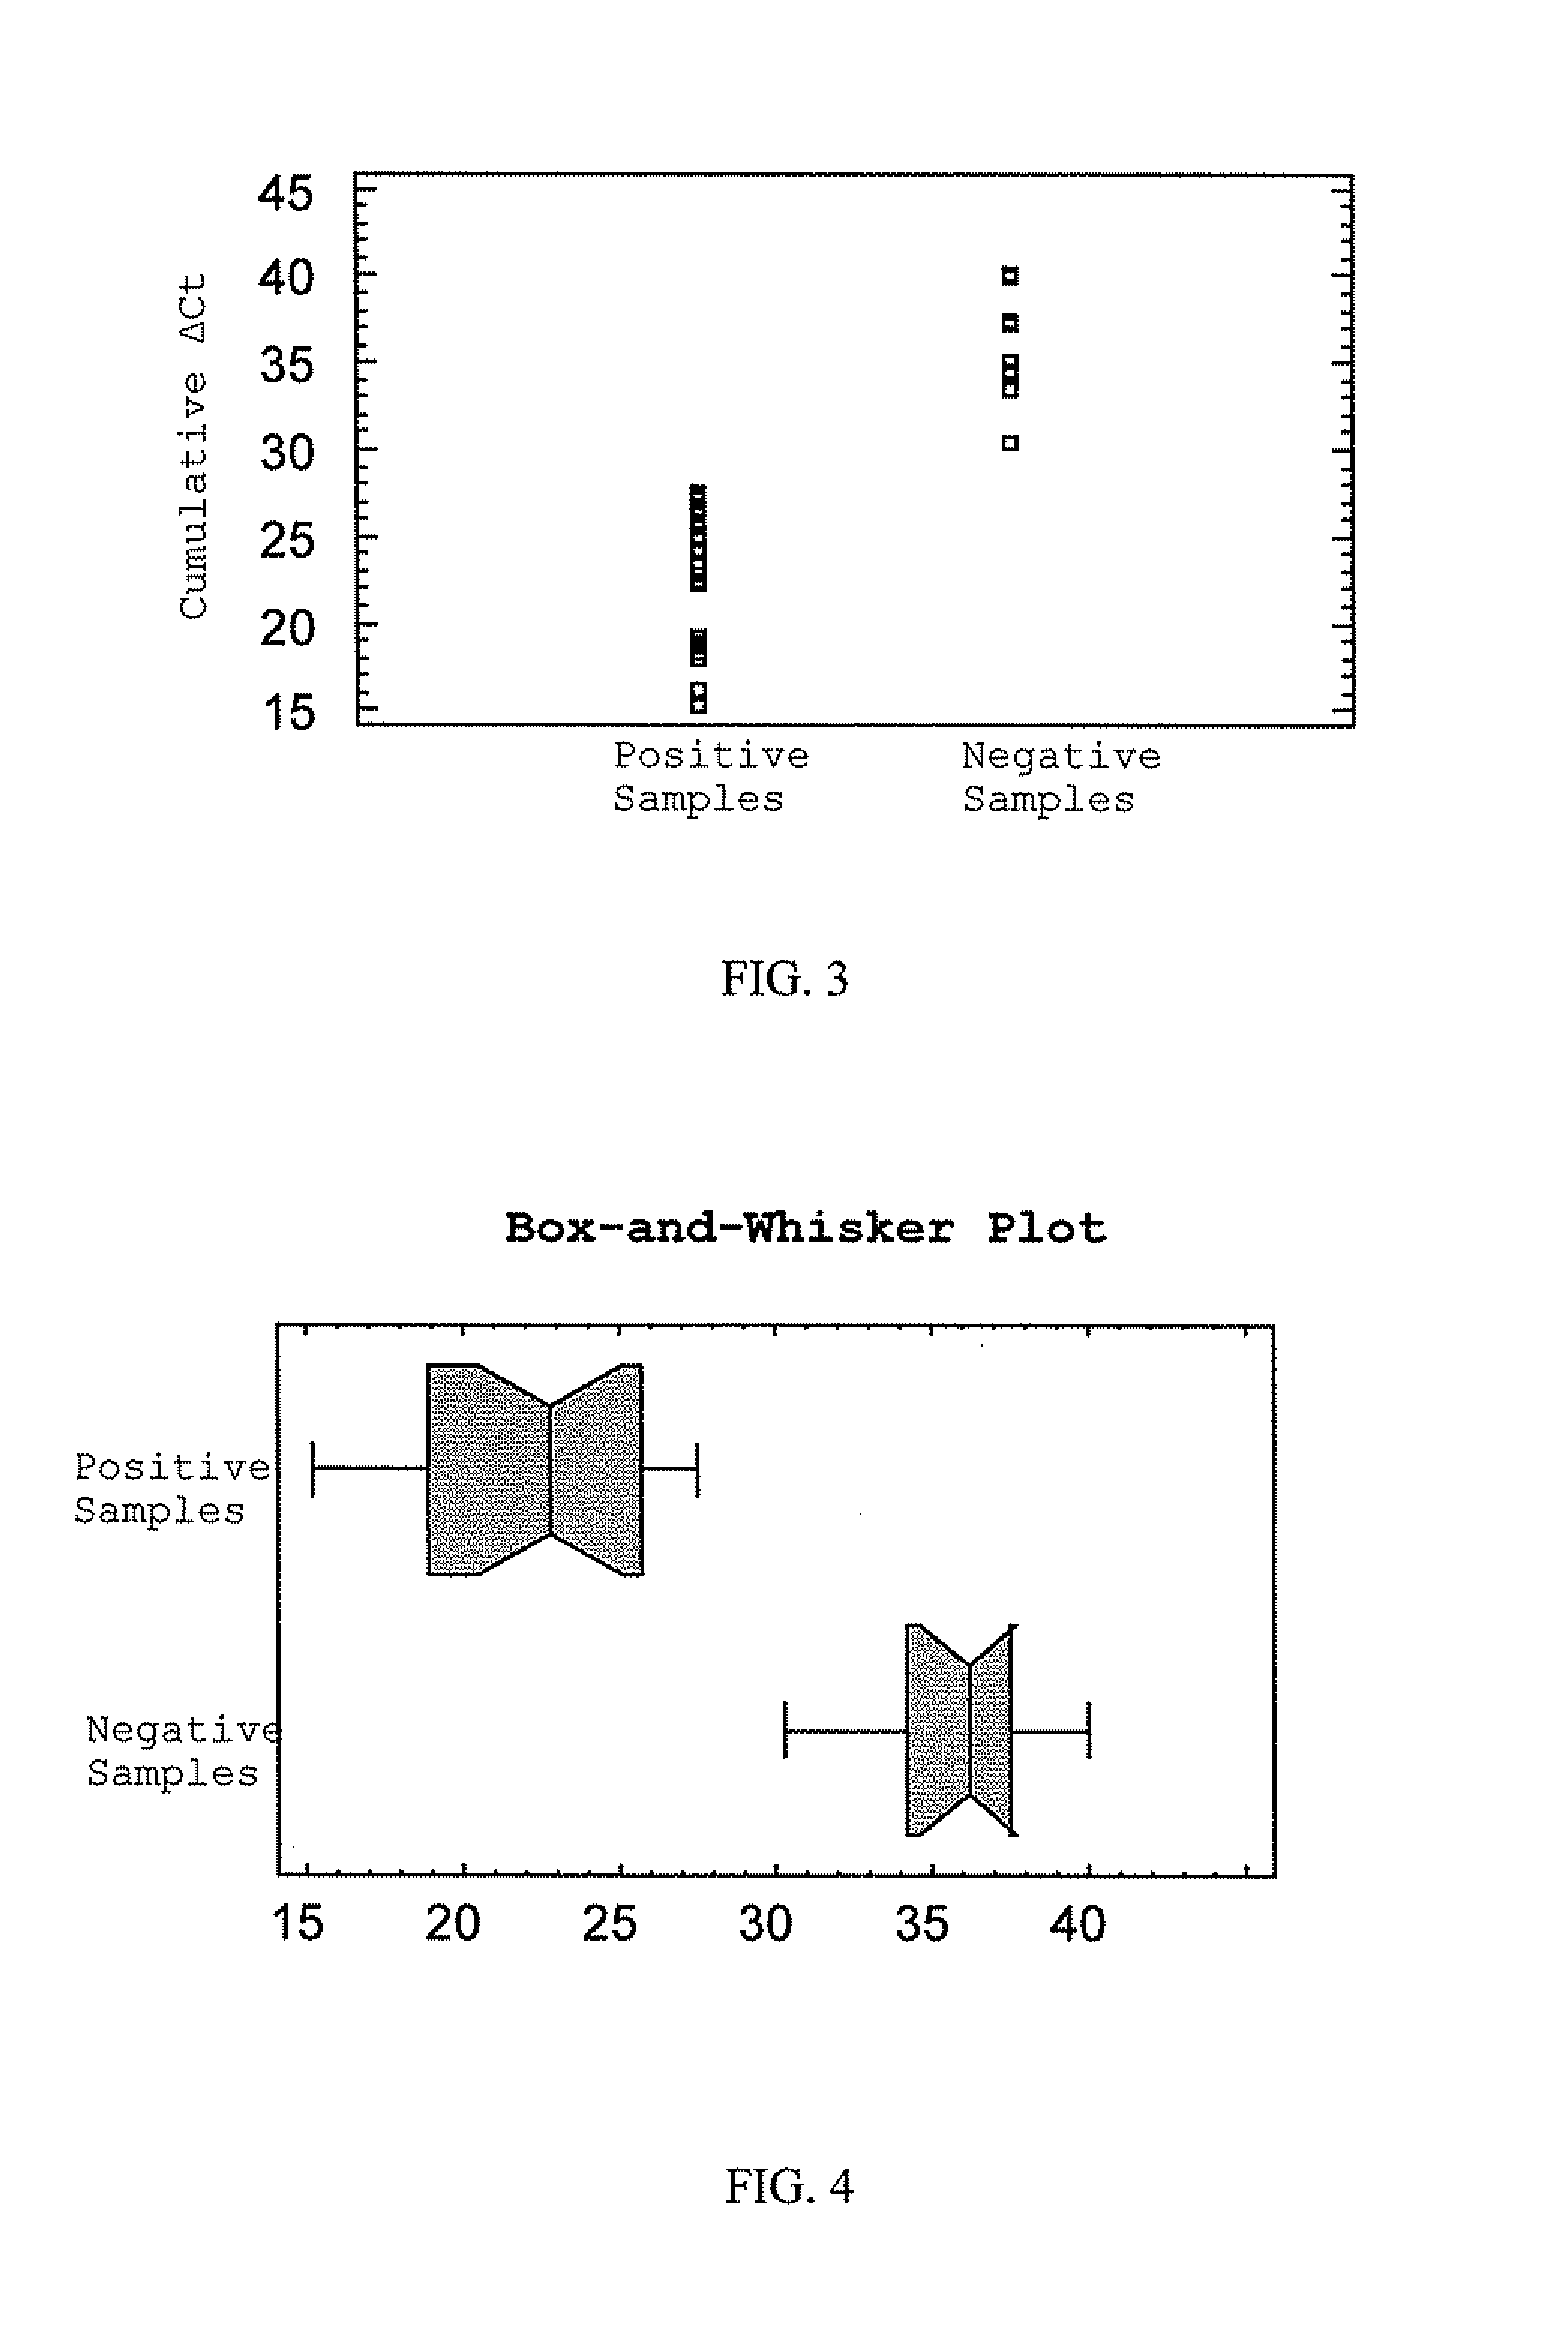
[0117]Variation of biomarker expression among bioassay positive and negative samples for hsa-miR-205 is shown in FIG. 2. FIG. 2 shows the graphical representation of individual ΔCt values for hsa-miR-205 marker alone from trichogenic (+) and non-trichogenic (−) dermal cell samples. The average ΔCt±SD of (+) and (−) samples are (4.80±1.9) and (10.98±1.2) respectively. Hence the average fold difference in expression of the marker between bioassay (+) and (−) samples is 70 based on the difference in their average ΔCt values. The data are statistically significantly different between bioassay positive and negative samples as determined by Kruskal-Wallis test and ANOVA. All bioassay positive samples had higher expression (lower ΔCt values) in contrast to bioassay negative samples.
Example 5
Combined Biomarker Analysis
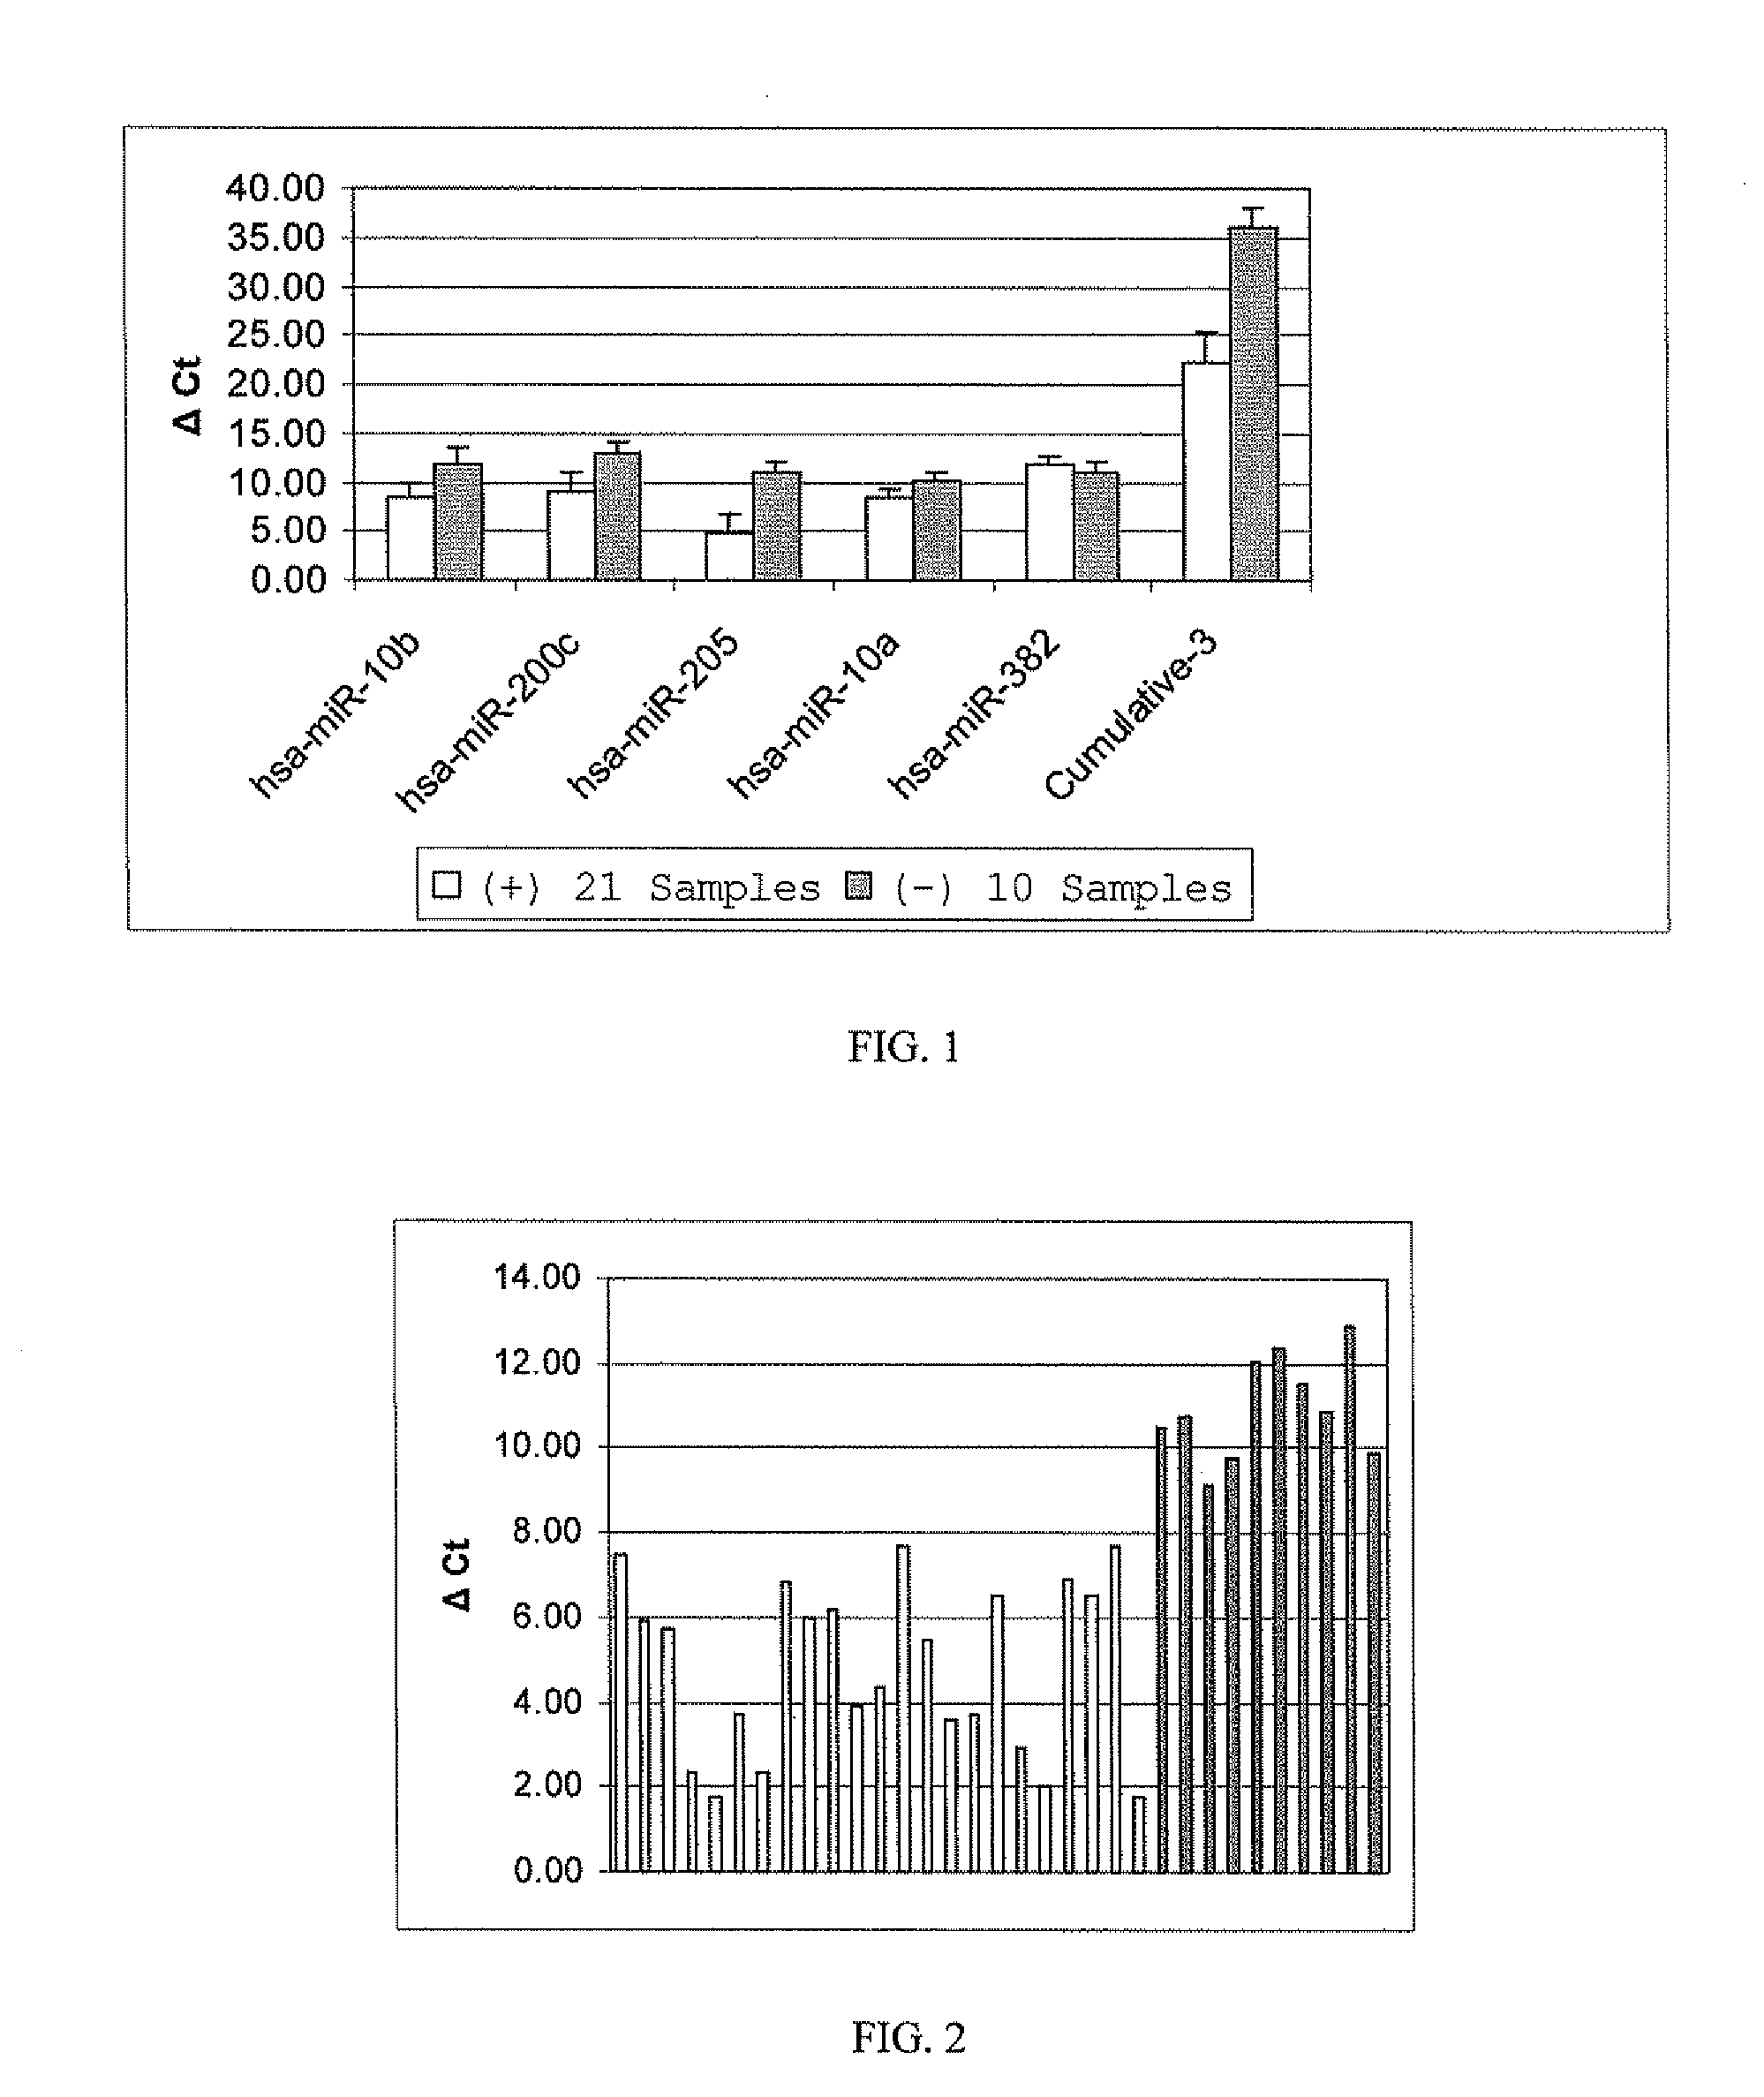
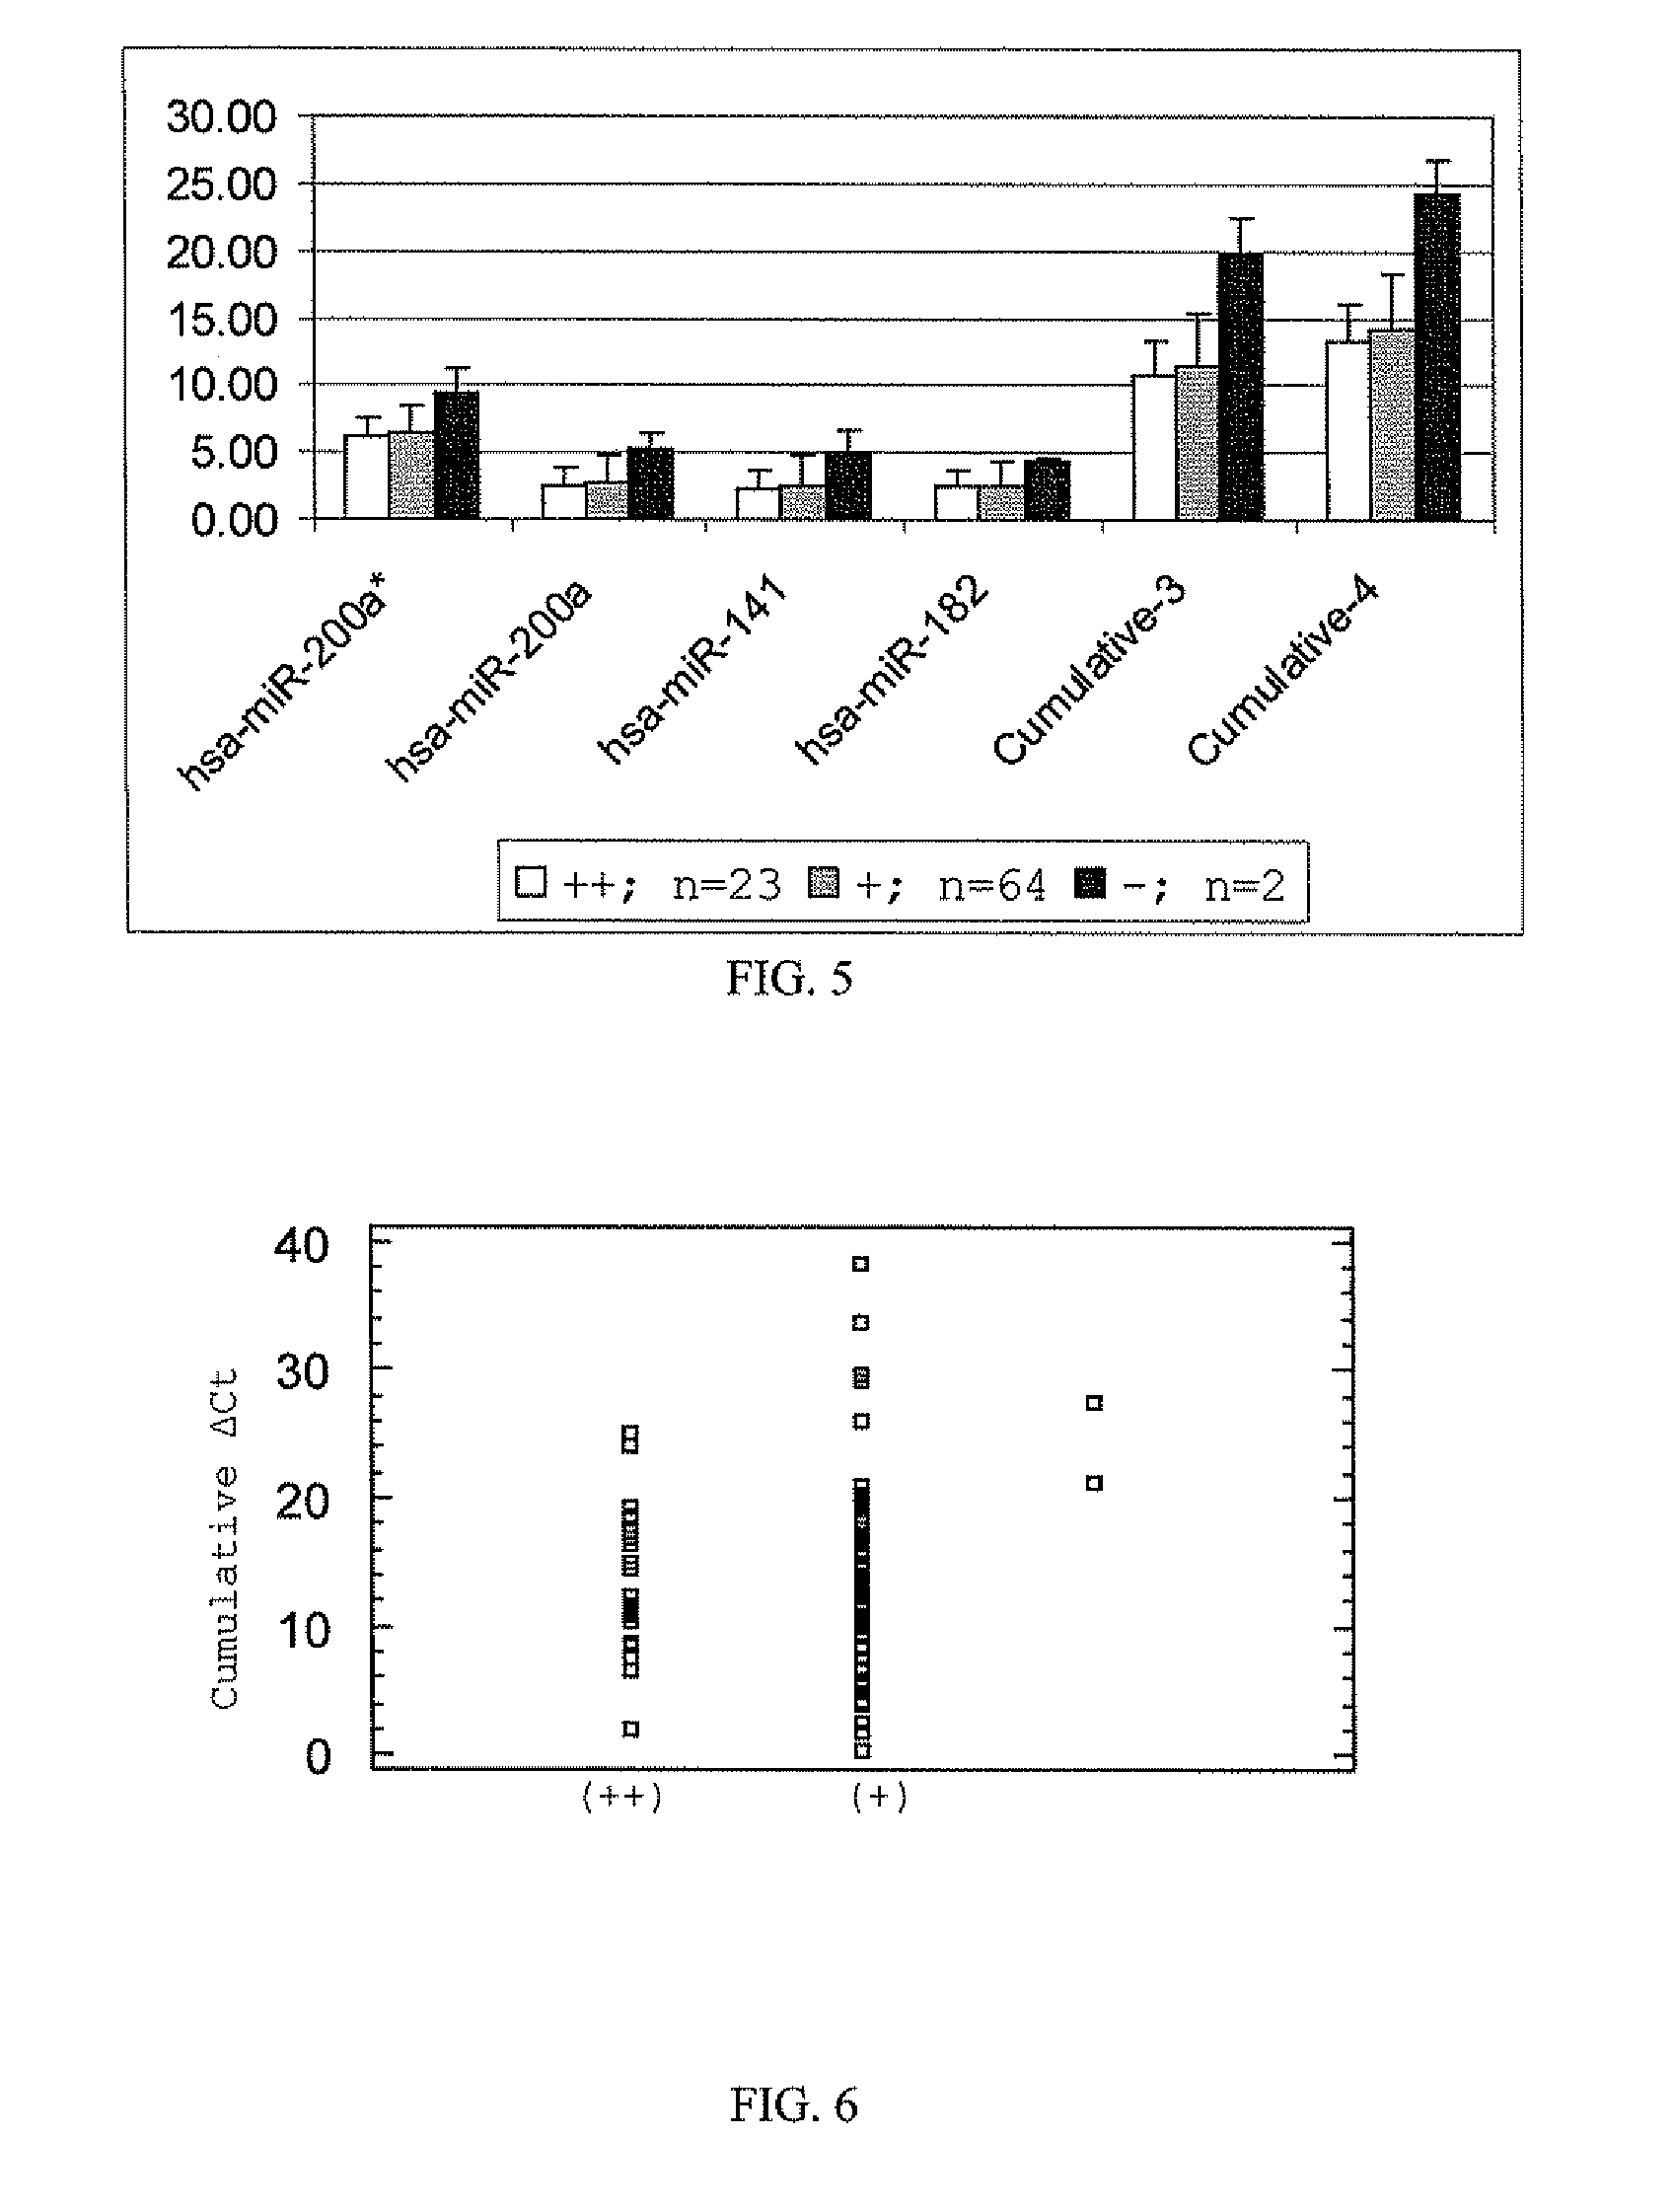
[0118]Cumulative normalized Ct values of hsa-miR-10b, hsa-miR-200c and hsa-miR-205 were used to analyze bioassay positive and negative samples...
PUM
 Abstract
Description
Claims
Application Information
 - R&D
- Intellectual Property
- Life Sciences
- Materials
- Tech Scout
- Unparalleled Data Quality
- Higher Quality Content
- 60% Fewer Hallucinations
Browse by: Latest US Patents, China's latest patents, Technical Efficacy Thesaurus, Application Domain, Technology Topic, Popular Technical Reports.
© 2025 PatSnap. All rights reserved.Legal|Privacy policy|Modern Slavery Act Transparency Statement|Sitemap|About US| Contact US: help@patsnap.com


