Monitoring Device and Method

a monitoring device and hemodynamic technology, applied in the field of apparatus and method for hemodynamic monitoring, can solve the problems of reducing the resistance of the affected vasculature to blood flow, severely limited space available for any kind of display, and increasing the afterload of patients with no preload reserve, so as to facilitate the detection of simultaneous changes in consciousness and in one or more hemodynamic parameters. , the effect of reducing the risk of strok

Active Publication Date: 2011-11-03
LIDCO GROUP +1
View PDF7 Cites 17 Cited by
  • Summary
  • Abstract
  • Description
  • Claims
  • Application Information

AI Technical Summary

Benefits of technology

[0037]The displayed images may plot the level of consciousness or the above discussed hemodynamic parameters over time. The images may be displayed so as to be time synchronised with each other. A display of this nature enables the user to detect simultaneous changes in the level of consciousness and in one or more hemodynamic parameters more easily. An identification of any such simultaneous changes may help in identifying the cause for the changes and in determining an appropriate way of countering any undesired changes more reliably and quickly.
[0038]A display of the change in stroke volume may be a display of the percentage change of stroke volume over a period of time. Such a display can be in number format. The change in stroke volume can alternatively or additionally be displayed in the form of a curve plotting stroke volume one a per beat basis over time. A range of stroke volume values centred on the mean stroke volume and indicating upper and / or lower threshold beyond which a variation in stroke volume is indicative of a hypovolemic state of the patient may further be superimposed over any such curve for easy visualisation of excessive variations in stroke volume.

Problems solved by technology

Arterial vasodilation increases arterial capacity and consequently reduces the affected vasculature's resistance to blood flow.
However, increases in afterload are poorly tolerated in patients with no preload reserve (at the top of Frank Starling curve, that is patients that could be fluid overloaded) and / or those patients with left ventricular systolic dysfunction.
A major limitation in displaying parameters on screen in a clinical environment, in particular in operating theatres is that the space available for any kind of display is severely limited.

Method used


Image

  • Monitoring Device and Method
  • Monitoring Device and Method
  • Monitoring Device and Method

Examples


Embodiment Construction

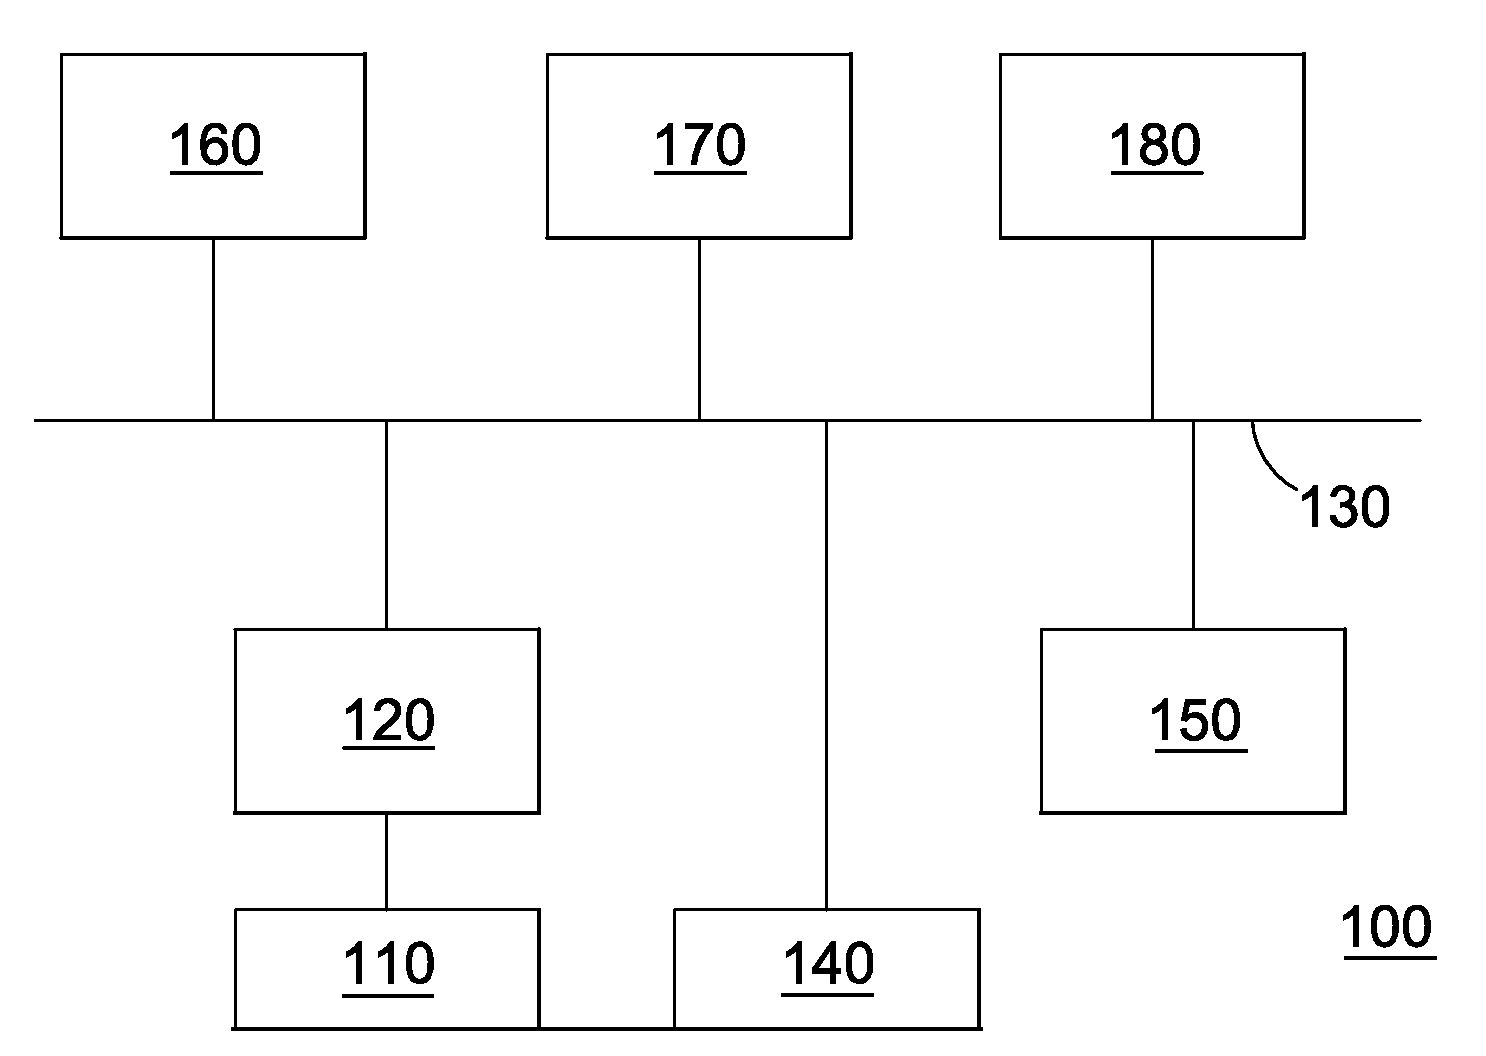
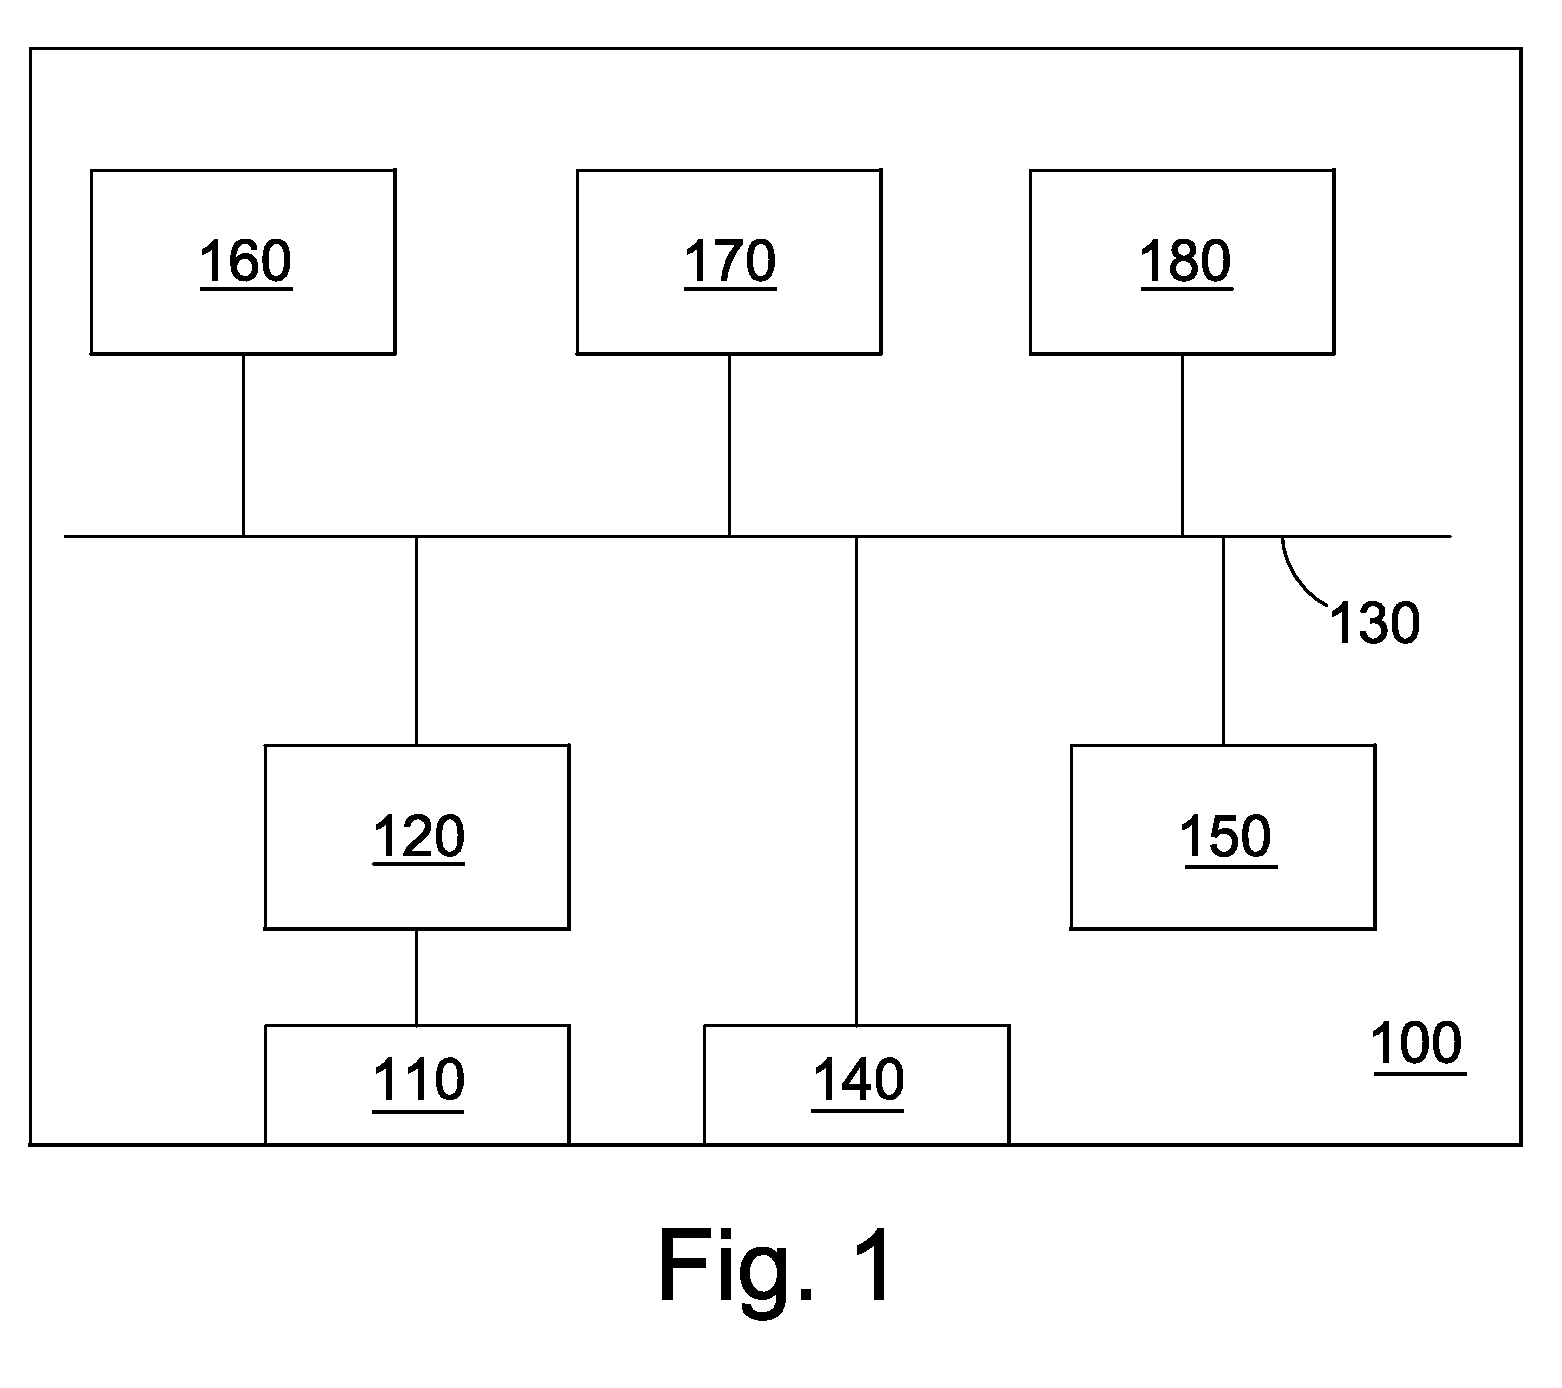
[0063]An embodiment of the present invention will be described in the following. FIG. 1 shows an overview of a monitor 100 of an embodiment of the present invention. The monitor 100 comprises an input port 110 to which a device providing an analogue pressure waveform can be connected and through which the analogue pressure waveform can be input into the monitor 100. An analogue to digital converter 120 is provided for converting any analogue pressure waveform received through the input port 110 into a digital signal. The digital signal can be placed on the bus 130 for further processing. The monitor 100 further comprises a second input port 140 to which a device providing a BIS signal can be connected and through which the BIS signal can be input into the monitor 100. In the present case the BIS signal is assumed to be a digital signal, so that it can be used directly by the monitor 100 without prior analogue to digital conversion. It will, however, be appreciated that other arrange...


PUM


Abstract

A monitoring device arranged to display a level of consciousness and hemodynamic parameters of a patient for simultaneous viewing. A dependence of changes in the hemodynamic parameters of the patient on the level of consciousness of the patient may be more easily observed using the monitoring device. Correlations between the patient's level of consciousness and the patient's hemodynamic parameters may further be determined and displayed to aid clinicians in estimating any improvement in hemodynamic parameters that may be achieved through manipulation of the patient's level of consciousness, fluid status and drugs.

Description

FIELD OF THE INVENTION[0001]The present invention relates to an apparatus and method for hemodynamic monitoring. The present invention in particular relates to an apparatus and method suitable for hemodynamic monitoring during surgery, sedation / anaesthesia and / or induction of sedation / anaesthesia.BACKGROUND[0002]It is known that the blood pressure of surgery patients falls from a pre-anaesthetic induction level to a lower level during induction of sedation / anaesthesia. This reduction in blood pressure has to be corrected by the anaesthetist to at least a level that is likely to reliably support the patient's vital functions.[0003]The drop in blood pressure through the anaesthetic induction phase is widely viewed as being the result of a fall in systemic vascular resistance (SVR; SVR=[((mean arterial pressure−central venous pressure)*80) / cardiac output)]; the unit normally used for expressing SVR is dynes*s*cm-5) due to the administered anaesthetic drug(s) causing a vasodilatory resp...

Claims


Application Information

Patent Timeline
Patent Type & Authority Applications(United States)
IPC IPC(8): A61B5/00A61M37/00G16Z99/00
CPCA61B5/0205A61B5/021A61B5/024A61B5/029G09B23/285A61B5/4821G06F19/3406G06F19/3437A61M5/1723A61B5/0476G16H40/63G16H50/50A61B5/369G16Z99/00
Inventor O'BRIEN, TERENCE KEVIN
Owner LIDCO GROUP
Why Eureka
Try Eureka