

Means for incorporating sustainability metrics and total cost benefit analysis in decision-making
a technology of sustainability metrics and total cost benefit analysis, applied in the field of management decision-making systems, methods and models in the computer industry, government and education, can solve the problems of reducing the attractiveness of the jurisdiction for future development, reduce the attractiveness of the jurisdiction, and simplify the understanding, standardization and application of tools.
- Summary
- Abstract
- Description
- Claims
- Application Information
AI Technical Summary
Benefits of technology
Problems solved by technology
Method used
Image

Examples
example 1
V. EXAMPLE 1
Calculating Sustainability Metrics for an Acetic Acid Process
[0048]Methanol is reacted with carbon monoxide in the presence of a homogenous rhodium catalyst and a methyl iodide promoter at temperatures in excess of 350° F. and pressures greater than 450 psig (pounds per square inch-gauge). The reaction takes place in the liquid phase. The methanol is almost completely converted (approximately 99% selectivity to acetic acid). The reactor effluent is flashed to separate the reaction products from the unvaporized rhodium catalyst. A small portion of the catalyst stream is sent to the catalyst preparation section of the plant for regeneration; the remainder is recycled to the reactor. The crude product vapor stream from the flash is distilled in a series of columns to recover purified acetic acid. Overall yield of acetic acid from methanol is 98%; and from carbon monoxide is 91%.
[0049]In 1992, this basic process accounted for greater than 50% of the world's acetic acid capac...
example 2
B. EXAMPLE 2
Automated Metrics
[0089]An automated metrics tool is a sustainability metrics management application which can be built, for example, using the Windows Forms classes of the Microsoft .NET Framework or similar system. Automating metrics allows users to view, modify, and add project-based metrics data that is stored within a centralized database or can use information on a public database; for example, the USDOE Industrial Assessment Database or the Carnegie Mellon EIO database. The application can generate reports and charts in different formats that effectively help users to understand sustainability performance of a given project. It can be used in any number of scenarios, from real time performance tracking to conceptual process design or limited lifecycle analysis.
[0090]The automated metrics tool can incorporate many technologies provided by the .NET Framework including authorization to control user access to application features, data encryption, accessibility support...
example 3
VIII. EXAMPLE 3
Total Cost Assessment
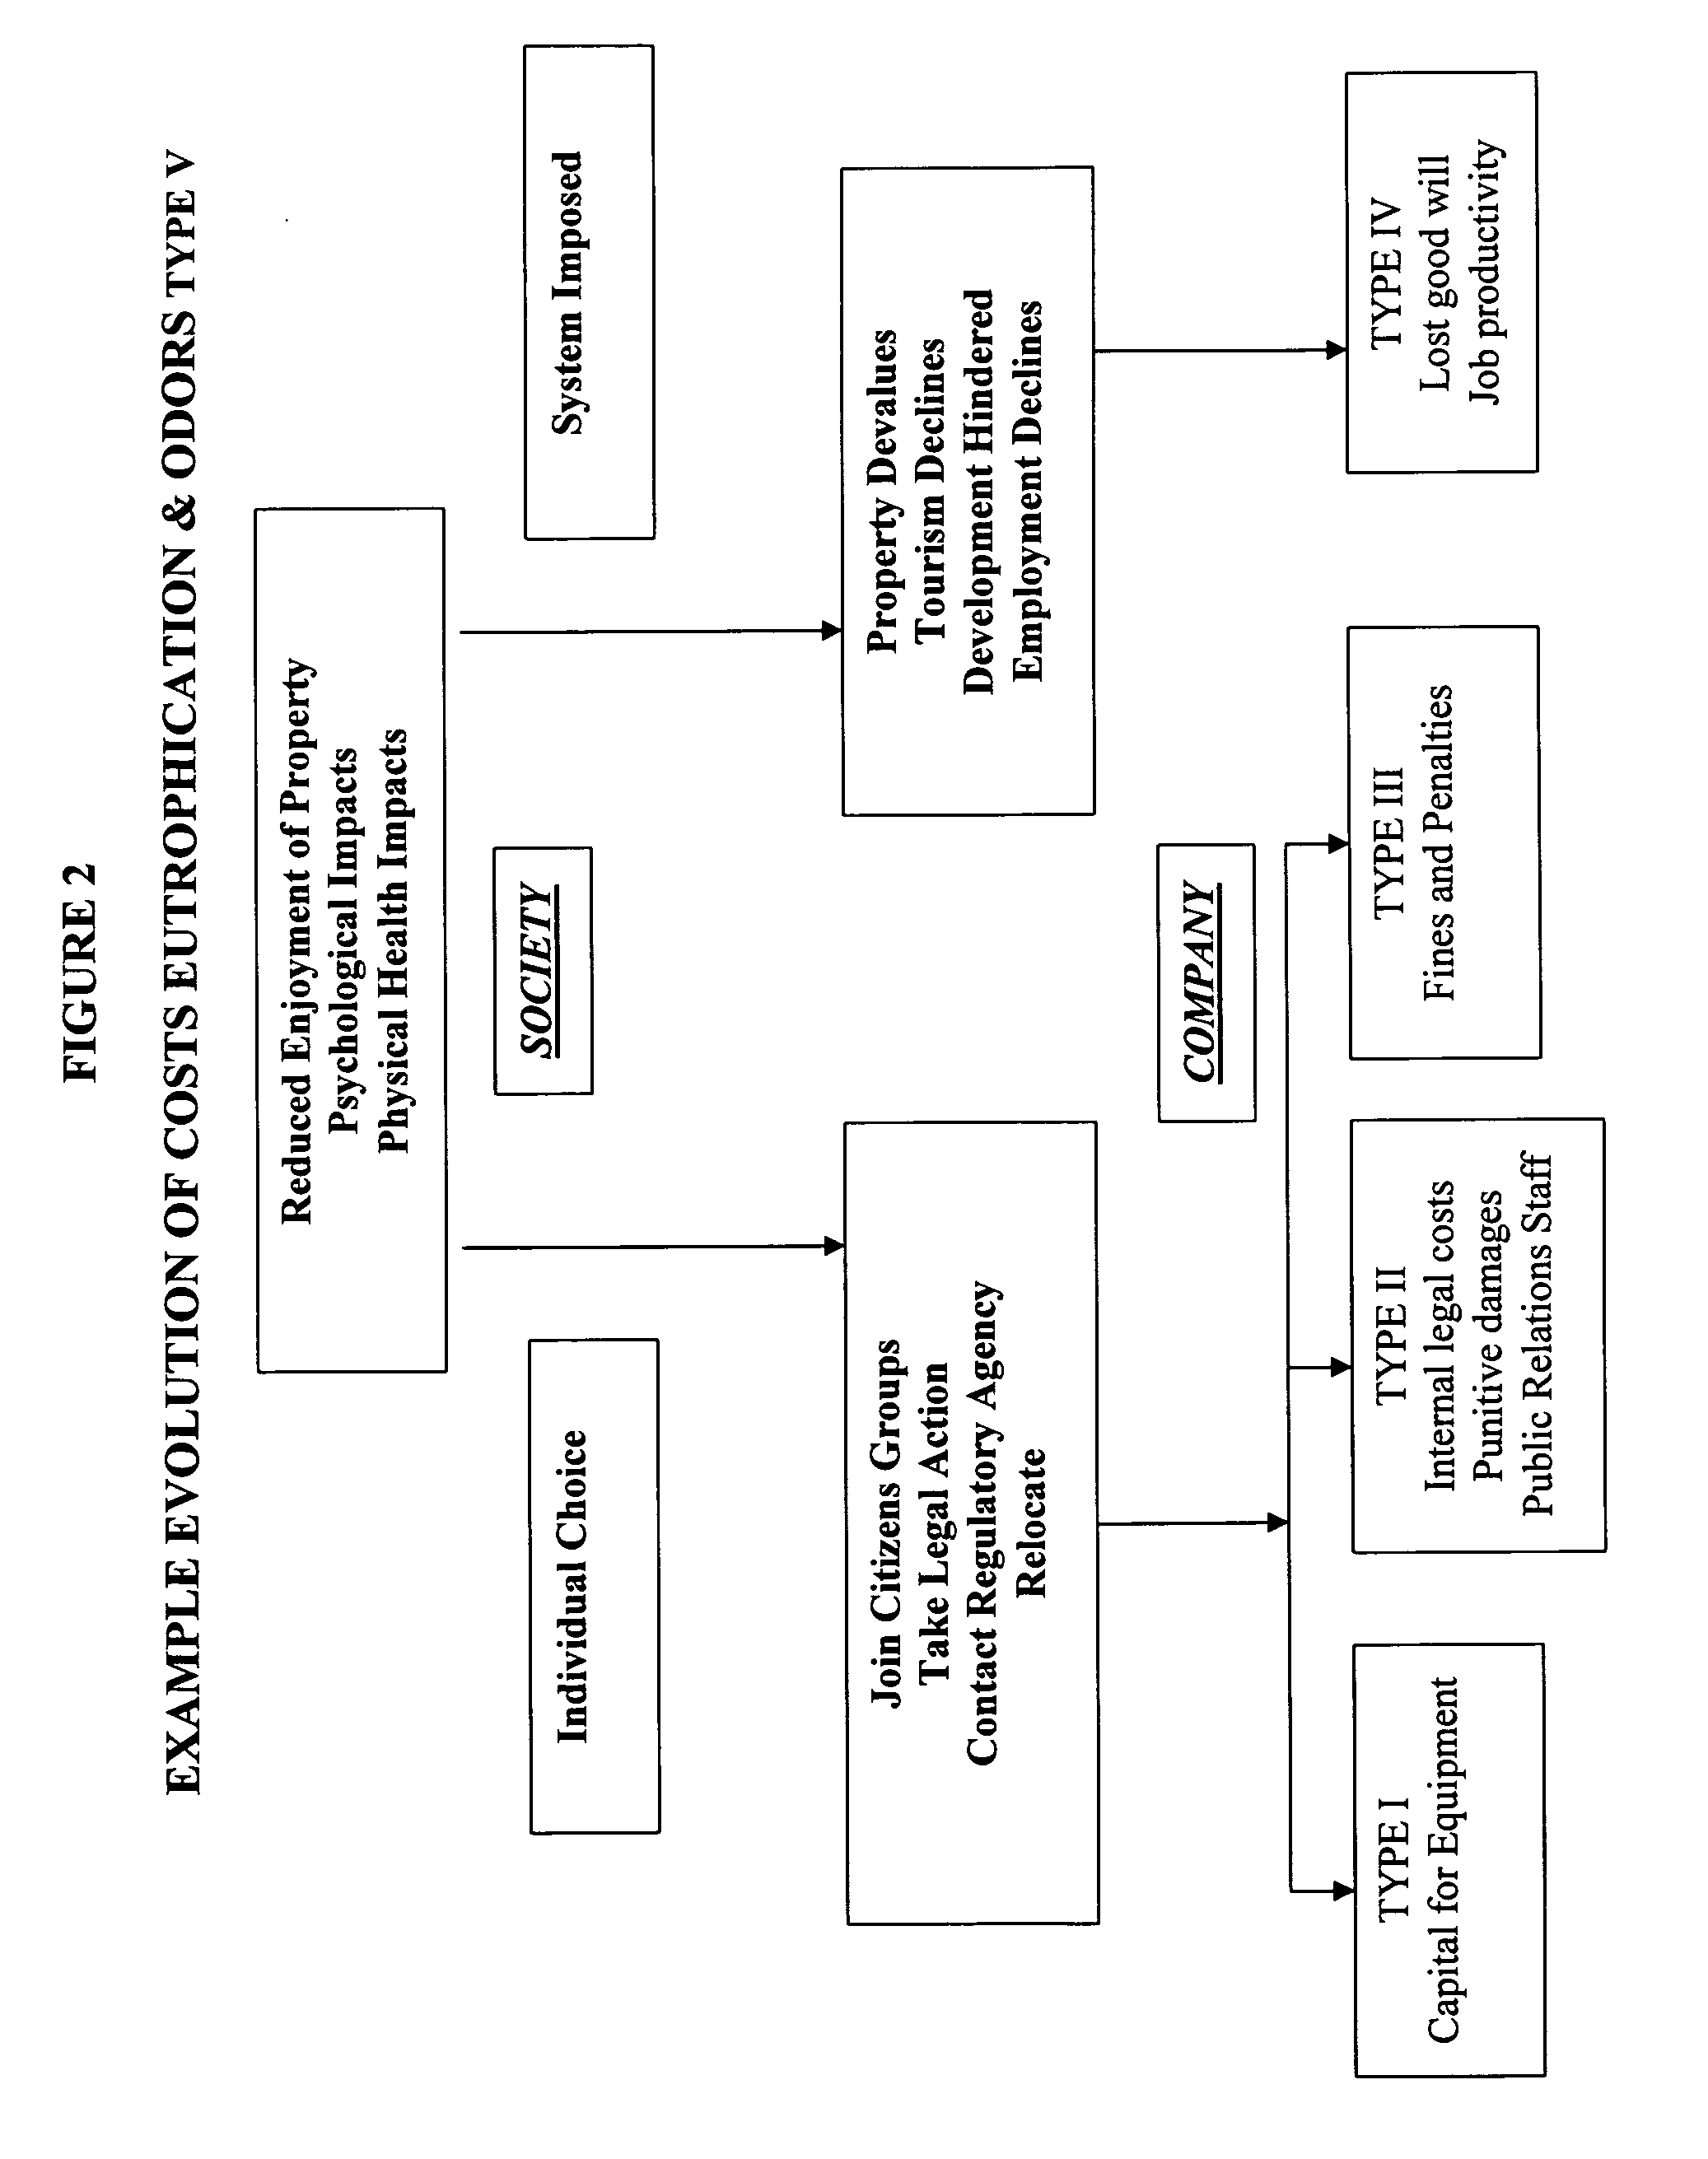
[0102]The presence of an odor in a residential area may lead to reduced enjoyment of the homeowner's property because of inability to use the exterior land of the facility and / or to have open ventilation in the home. Likewise, eutrophication may reduce the aesthetic beauty of waterfront or waterview property. “Eutrophication” is the unintentional enrichment of either fresh or salt water by chemical elements or compounds. The nutrients supplied promote algae growth. Eutrophication may also cause odors. Certainly, eutrophication can result in loss of enjoyment of swimming, fishing and water sports.
[0103]The presence of odors from a manufacturing location may cause uncertainties with regard to the nature of the compounds causing the odors. This concern, if severe enough, may have psychological impacts. Another impact area is physical health. Stress-related disorders CAN include sleep loss, gastro-intestinal symptoms, and hypertension. These disorders...
PUM
 Abstract
Description
Claims
Application Information