Eureka AIR delivers breakthrough ideas for toughest innovation challenges, trusted by R&D personnel around the world.

Method of Using Non-Rare Cells to Detect Rare Cells

a rare cell and non-rare cell technology, applied in the field of rare cell detection, can solve the problems of inability to fully understand the behavior of the tumor, research to fully, and lack of easily accessible and reliable experimental tools, so as to minimize bias, minimize background staining, and maximize signal/background

Inactive Publication Date: 2012-11-01
THE SCRIPPS RES INST +1
View PDF3 Cites 58 Cited by
  • Summary
  • Abstract
  • Description
  • Claims
  • Application Information

AI Technical Summary

Benefits of technology

[0065]One advantage of the present invention, which allows for tunable specificity / sensitivity and focuses on data reduction and analysis rather than enrichment, is that minimal processing is expected to minimize bias. In alternative techniques that require enrichment, rare cells are invariably lost in the process. Specifically, in the use of immunocapture or size filtration to distinguish between WBCs and CTCs, variation in the expression of the targeted antigen in the case of immunocapture or variation in the size differential between the WBC and CTC causes some CTCs to be lost during the enrichment phase. This can lead to (i) inaccurate counts of CTCs; (ii) too few CTCs for downstream characterization or content analysis; and (iii) the creation of a selection bias as some types of CTCs are preferentially lost based upon their type of variation.
[0066]The challenge with the minimal processing approach is that it is difficult to find the low frequency rare cells or CTCs in the background of the non-rare cells or non-CTCs. The low frequency may be 1 rare cell or CTC: 1,000 non-rare cells or non-CTCs, 1:10,000, 1:100,000, 1:1,000,000, and even 1:10,000,000, or anywhere between those ratios. Complicating the ability to find and characterize the rare cells is that the positive and negative markers, while very selective, are not perfect resulting in either false positives or false negatives. In other words, it is common to have some background staining of the negative markers on the rare cells and / or some background staining of the positive markers on the non-rare cells. While assay optimization is used to minimize this background staining, it is challenging to completely eliminate the phenomenon with assay optimization.
[0067]As mentioned previously, most other approaches for finding rare cells attempt to remove the non-rare cells. The present invention uses the non-rare cells or non-CTCs to aid in finding and characterizing the rare cells or CTCs. The numerous ways in which non-rare cells and non-CTCs may be analyzed are discussed throughout the disclosure. Throughout this disclosure, non-rare cells or non-CTCs are typically referred to as a single group and may be analyzed using the methods described herein as such. However, the invention also recognizes that non-rare cells may contain various discrete subgroups. For example, in the case of CTCs, the various discrete subgroups may include neutrophils, macrophages, lymphocytes, eosinophils and basophils, and cells in varying states such as various states of apoptosis or cell division, that may be distinguished using the methods described herein by size, shape, nuclear characteristics, and staining pattern. In some embodiments of the invention, it may be useful to use one of these subgroups to aid in finding rare cells or CTCs, rather than to use the entire group. The use of non-rare or non-CTCs in the present invention is not meant to limit the invention to using only the entire group when it may be appropriate in some of the embodiments to use just one or more of the subgroups.
[0068]An enabling aspect of this invention is that the low frequency of rare cells or CTCs to non rare cells or non-CTCs allows one to treat the majority of cells as non-rare cells or non-CTCs even if they have not been definitively identified as such. The low frequency of rare cells and CTCs allows one to ignore such cells and assume the cells are non-rare cells or non-CTCs to derive quality control, cut-off, normalization, and calibration metrics. Since the rare cells are in low abundance, if these metrics are to be refined taking into consideration the population of rare cells, outlier removal techniques may be utilized. The outlier removal techniques mathematically ensure that the population of rare cells does not factor into the metrics.
[0069]As discussed herein, the disclosed methodology allows detection, enumeration and characterization of populations of rare cells or subpopulations of rare cells. The methodology utilizes data from non-rare cells in the sample to identify and characterize rare cells by applying defined parameters pertaining to exposure limits, exposure settings, quality control, intensity cut-off limits, cell size and shape calibration, cell enumeration and content evaluation, each of which is further discussed in turn. In various aspects, the assay allows for simultaneous cytomorphologic review of fluorescent images with individual channel images, augmented with cell-by-cell annotation with ancillary semi-quantitative data regarding size and fluorescent intensity of objects both absolute and relative to the non-rare cells or non-rare cell candidates, e.g., non-CTCs or non-CTC candidates, from either the full experiment or the local environment.
[0071]While variation should be minimized through assay optimization and instrument standardization, variation in the staining of the markers is common, slide-to-slide, batch-to-batch, operator-to-operator, and day-to-day. Thus selecting the right exposure for a particular slide is non-trivial, as setting it too low or too high will cause one to miss information. While standard approaches work for those markers that are common on the majority of events on the slide, it is challenging for those that are specific to rare cells or CTCs. Within the dynamic range of the imaging system, the signal in rare cells or CTCs and background in non-rare cells or non-CTCs are proportional to the exposure time. But noise which is random variation in both signal and background caused by electronics in the imaging system decreases when exposure increases. Ideally, exposure should be set to maximize the signal without saturating the imaging system. But this is impractical due to the impact on data collection time. Because a rare cell or CTC is present in very low frequency, it is unlikely that a rare cell or CTC would be found in a small number of Sample Images, preventing one from using the Sample Images to set the exposure for the positive marker. Complicating this further, there is a natural variation in the expression of and staining of both positive and negative markers to their target cells. A small number of Sample Images to set exposure may not capture this natural variation on the target rare cells or CTCs.

Problems solved by technology

While progress has been made in understanding the primary and metastatic tumors in their respective microenvironments, a substantial barrier exists in understanding carcinoma behavior during the fluid phase, as it spreads within and occupies the bloodstream.
Research to fully characterize the clinical significance of this fluid phase of solid tumors has been hindered by the lack of easily accessible and reliable experimental tools for the identification of CTCs.
The unknown character and low and unknown frequency of CTCs in the blood, combined with the difficulty of distinguishing between cancerous versus normal epithelial cells, has significantly impeded research into how the fluid phase might be clinically important.
The shedding of CTCs by an existing tumor or metastasis often results in formation of secondary tumors.
Secondary tumors typically go undetected and lead to 90% of all cancer deaths.
While the detection of CTCs has important prognostic and potential therapeutic implications in the management and treatment of cancer, because of their occult nature in the bloodstream, these rare cells are not easily detected.
The challenge in the detection of circulating tumor cells is that they are present in relatively low frequency compared to other nucleated cells, commonly less than 1:100,000.
With this methodology, CTCs are found in virtually all metastatic cancer patients at a relatively high purity and not in healthy controls.
This system has uncovered the prognostic utility of enumerating and monitoring CTC counts in patients with metastatic breast, prostate, and colorectal cancers; however, the sensitivity of this system is low, finding no or few CTCs in most patients.
Most follow-on CTC technologies have reported higher sensitivity and are pursuing variations of the enrichment strategy, however this directly biases the detectable events towards those that have sufficient expression of the protein selected for the initial enrichment step.
Although many CTC detection approaches are currently in use, significant limitations have been identified with the current approaches.
For example, one significant limitation of positive selection methods to enumerate / characterize CTCs is that positive physical selection invariably leads to loss of CTCs and is less than 100% efficient.
Thus the number of CTCs detected per sample using current methods is often too low to provide robust interpretation or clinically meaningful content of a particular sample.
Additional limitations of current methods include low CTC detection due to CTC heterogeneity.
For example, differences in individual CTC features within the CTC population of interest further hinder the number of CTCs detected using current methodologies.
A further limitation of existing methodologies includes limitations in purity levels and variable purity.

Method used


Image

  • Method of Using Non-Rare Cells to Detect Rare Cells
  • Method of Using Non-Rare Cells to Detect Rare Cells
  • Method of Using Non-Rare Cells to Detect Rare Cells

Examples


example 1

CTC Assay and Identification of CTC Subpopulation

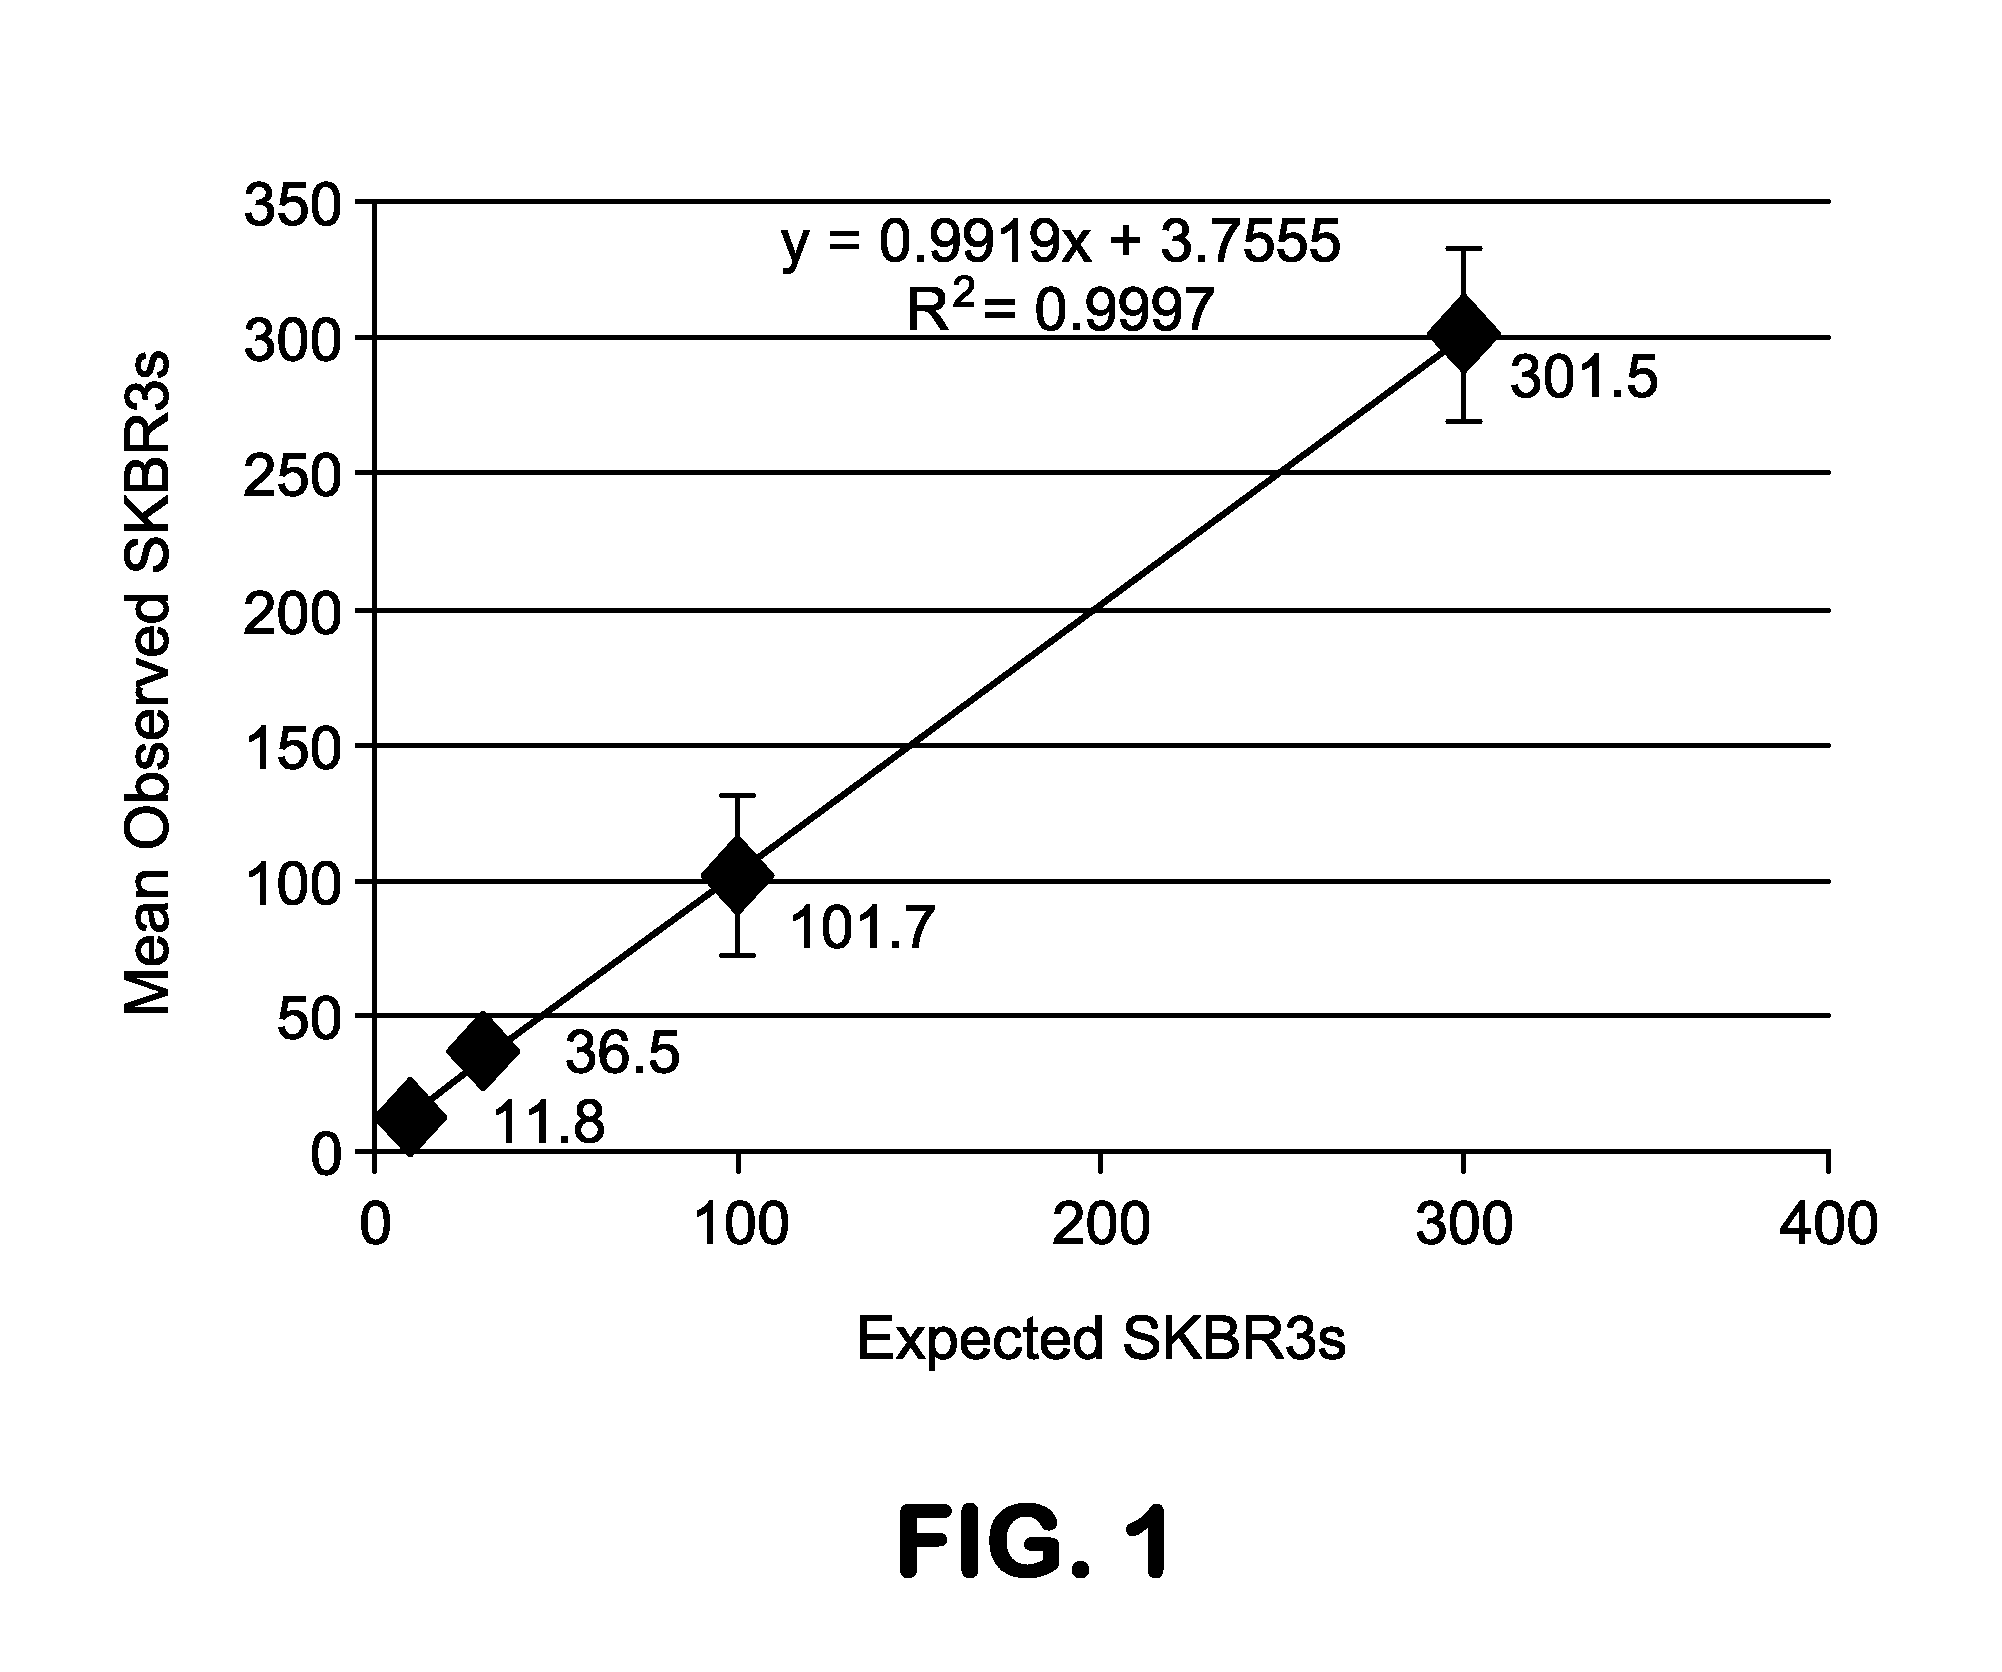
[0117]The data presented here demonstrate the methodology of the present invention as applied to CTCs and subpopulations of CTCs, such as HD-CTCs as defined herein. The assay is performed via a controlled prospective protocol to address the reliability and robustness of the assay as well as a split sample comparison with the Cellsearch®. After this technical validation, the assay was used to investigate the incidence and prevalence of CTCs and specific CTC subpopulations in patients with metastatic breast, prostate, and pancreatic cancers as well as normal controls. The specific subpopulation of CTCs targeted by the assay requires that the cell(s) have an intact nucleus, express cytokeratin and not CD45, are morphologically distinct from surrounding white blood cells (WBCs) and have cytologic features consistent with intact malignant epithelial cells suitable for downstream analysis.

[0118]The following methods and protocols were utili...

example 2

[0152]CTC Assay and Identification of Rare Cell Populations

[0153]The data presented here demonstrate identification of putative rare cell populations. Using the methodology described herein, a putative rare cell population was identified. Sample processing and imaging was performed as disclosed in Example 1. Additionally, HD-CTCs were identified and defined as in Example 1.

[0154]In performing the assay, no CTCs were assumed to be cytokeratin positive. A putative rare cell population was identified having the following characteristics: a) cytokeratin dim or negative; b) CD45 negative; and c) intact non-apoptotic appearing nucleus by DAPI imaging. FIG. 5 displays the incidence rate of the putative rare cell population across patients relative to identified HD-CTCs.


PUM


Abstract

The invention provides seminal computational approaches utilizing data from non-rare cells to detect rare cells, such as circulating tumor cells (CTCs). The invention is applicable at two distinct stages of CTC detection; the first being to make decisions about data collection parameters and the second being to make decisions during data reduction and analysis. Additionally, the invention utilizes both one and multi-dimensional parameterized data in a decision making process.

Description

BACKGROUND OF THE INVENTION[0001]1. Field of the Invention[0002]The invention relates generally to medical diagnostics and more specifically to detection and categorization of rare cells, such as circulating tumor cells (CTCs).[0003]2. Background Information[0004]Significant unmet medical need exists for the longitudinal disease monitoring in patients with epithelial cancers at the cellular level. Predicting and monitoring therapy response and disease progression are particularly important in epithelial cancer patients due to the natural history of the disease and the selective selection process in response to the therapeutic pressure. While progress has been made in understanding the primary and metastatic tumors in their respective microenvironments, a substantial barrier exists in understanding carcinoma behavior during the fluid phase, as it spreads within and occupies the bloodstream. The circulating component of cancer contains within it the cells giving rise to future metasta...

Claims


Application Information

Patent Timeline
IPC IPC(8): G01N21/64
CPCG01N33/5076G01N33/5091G01N2800/56G01N33/6875G01N2800/52G01N33/574A61P35/00A61P35/02
Inventor KUHN, PETERKOLATKAR, ANANDKUNKEN, JOSHUAMARRINUCCI, DENAYANG, XINGSTUELPNAGEL, JOHN R.
Owner THE SCRIPPS RES INST
Why Eureka
Eureka Blog
Learn More