Method And Apparatus Of Tuning A Scanning Probe Microscope

a scanning probe and microscope technology, applied in the field of scanning probe microscopes, can solve the problems of difficult control of the normal force acting on the sample surface, the tip will not track the sample, and the afm of the scanning probe, so as to improve the automatic tuning of the conventional atomic force microscope, fast generate thermally induced displacement, and improve the effect of processing hardwar

Active Publication Date: 2013-05-16
BRUKER NANO INC
View PDF4 Cites 10 Cited by
  • Summary
  • Abstract
  • Description
  • Claims
  • Application Information

AI Technical Summary

Benefits of technology

[0025]In the present preferred embodiments, also known as the SmartTune algorithm and apparatus, conventional automatic tuning of an atomic force microscope has been improved without having to rely on a standard tuning curve (i.e., frequency swept amplitude response of an oscillating probe). Rather, the preferred embodiments take advantage of high speed processing hardware and software to rapidly generate a thermally induced displacement power spectrum (TIDPS) having a peak that substantially corresponds to the fundamental resonant frequency of the probe. In this way, the problems associated with conventional tuning curves (described above) can be substantially eliminated. In fact, contrary to accepted knowledge in the AFM field, generating a standard tuning curve is not necessary to identify an ideal operating frequency for the AFM at all, given that it has now been determined that the thermal peak provides a more reliable indication of the fundamental resonant frequency of the probe. Moreover, collecting thermal data for AFM tuning has been made commercially practical with the present design.
[0026]The SmartTune algorithm and apparatus collects thermal data, fits the data with a simple harmonic oscillator, and determines the resonant frequency of the cantilever from the fitted peak. In this way, the algorithm adjusts the drive frequency, amplitude, and phase values based on the thermal data and amplitude response data for robust operation. Preferably, the fitted curve of the thermal data is displayed to the user together with an auto-tune curve (frequency swept amplitude response). With the more reliable indication of fundamental resonant frequency of the probe, concerns regarding not operating at resonance are greatly lessened.

Problems solved by technology

That said, TappingMode AFM suffers from a drawback in that it is difficult to control the normal force acting on the sample surface.
The dilemma, especially for soft samples, is that if the imaging force is too low, the tip will not track the sample properly (i.e., maintain interaction with the sample during the scan), while if too high, damage / deformation of the sample may lead to an image that does not accurately reflect surface topography.
For operation in fluid, however, in which the Q is much lower due to fluid damping, the peak associated with the probe resonant frequency is wide and thus can be difficult to identify.
Though capable of providing stable operation, known automatic tuning methods also have drawbacks.
For instance, the user defined parameters for conducting the tune may create problems.
Moreover, the setup of the AFM instrument may create problems identifying the resonance of the probe.
For instance, the mechanical coupling between the probe holder and the probe substrate is often not ideal (even a small particle between the substrate and probe holder can compromise the system's ability to identify the probe resonance).
If so, the amplitude response may include multiple peaks that make it difficult for the auto-tune algorithm to distinguish the probe resonant frequency.
These peaks may also be caused by vibration of parts of the AFM other than the cantilever of the probe.
Operating at this latter frequency, which would be selected by a typical auto-tune algorithm, would most likely prevent stable operation of the AFM.
Moreover, when operating TappingMode in fluid, multiple peaks (and peaks which are more rounded and therefore less easily correlated to the fundamental resonant frequency of the probe) are often present in the swept amplitude response (tuning curve) due to fluid damping of the cantilever (i.e., cantilever Q is smaller).
In all these cases, the automatic tuning method is at risk of failing.
And if the probe is driven at a frequency other than the resonant frequency, poor probe response can lead to the acquisition of poor SPM images.
In addition, when operating significantly off resonance, probe tips and / or samples can be damaged due to poor force control.
Unfortunately, it is not always obvious to the user that the tune was not performed correctly.
Notably, generating a thermally induced displacement power spectrum curve related to an AFM probe is a computationally intense endeavor.

Method used


Image

  • Method And Apparatus Of Tuning A Scanning Probe Microscope
  • Method And Apparatus Of Tuning A Scanning Probe Microscope
  • Method And Apparatus Of Tuning A Scanning Probe Microscope

Examples


Embodiment Construction

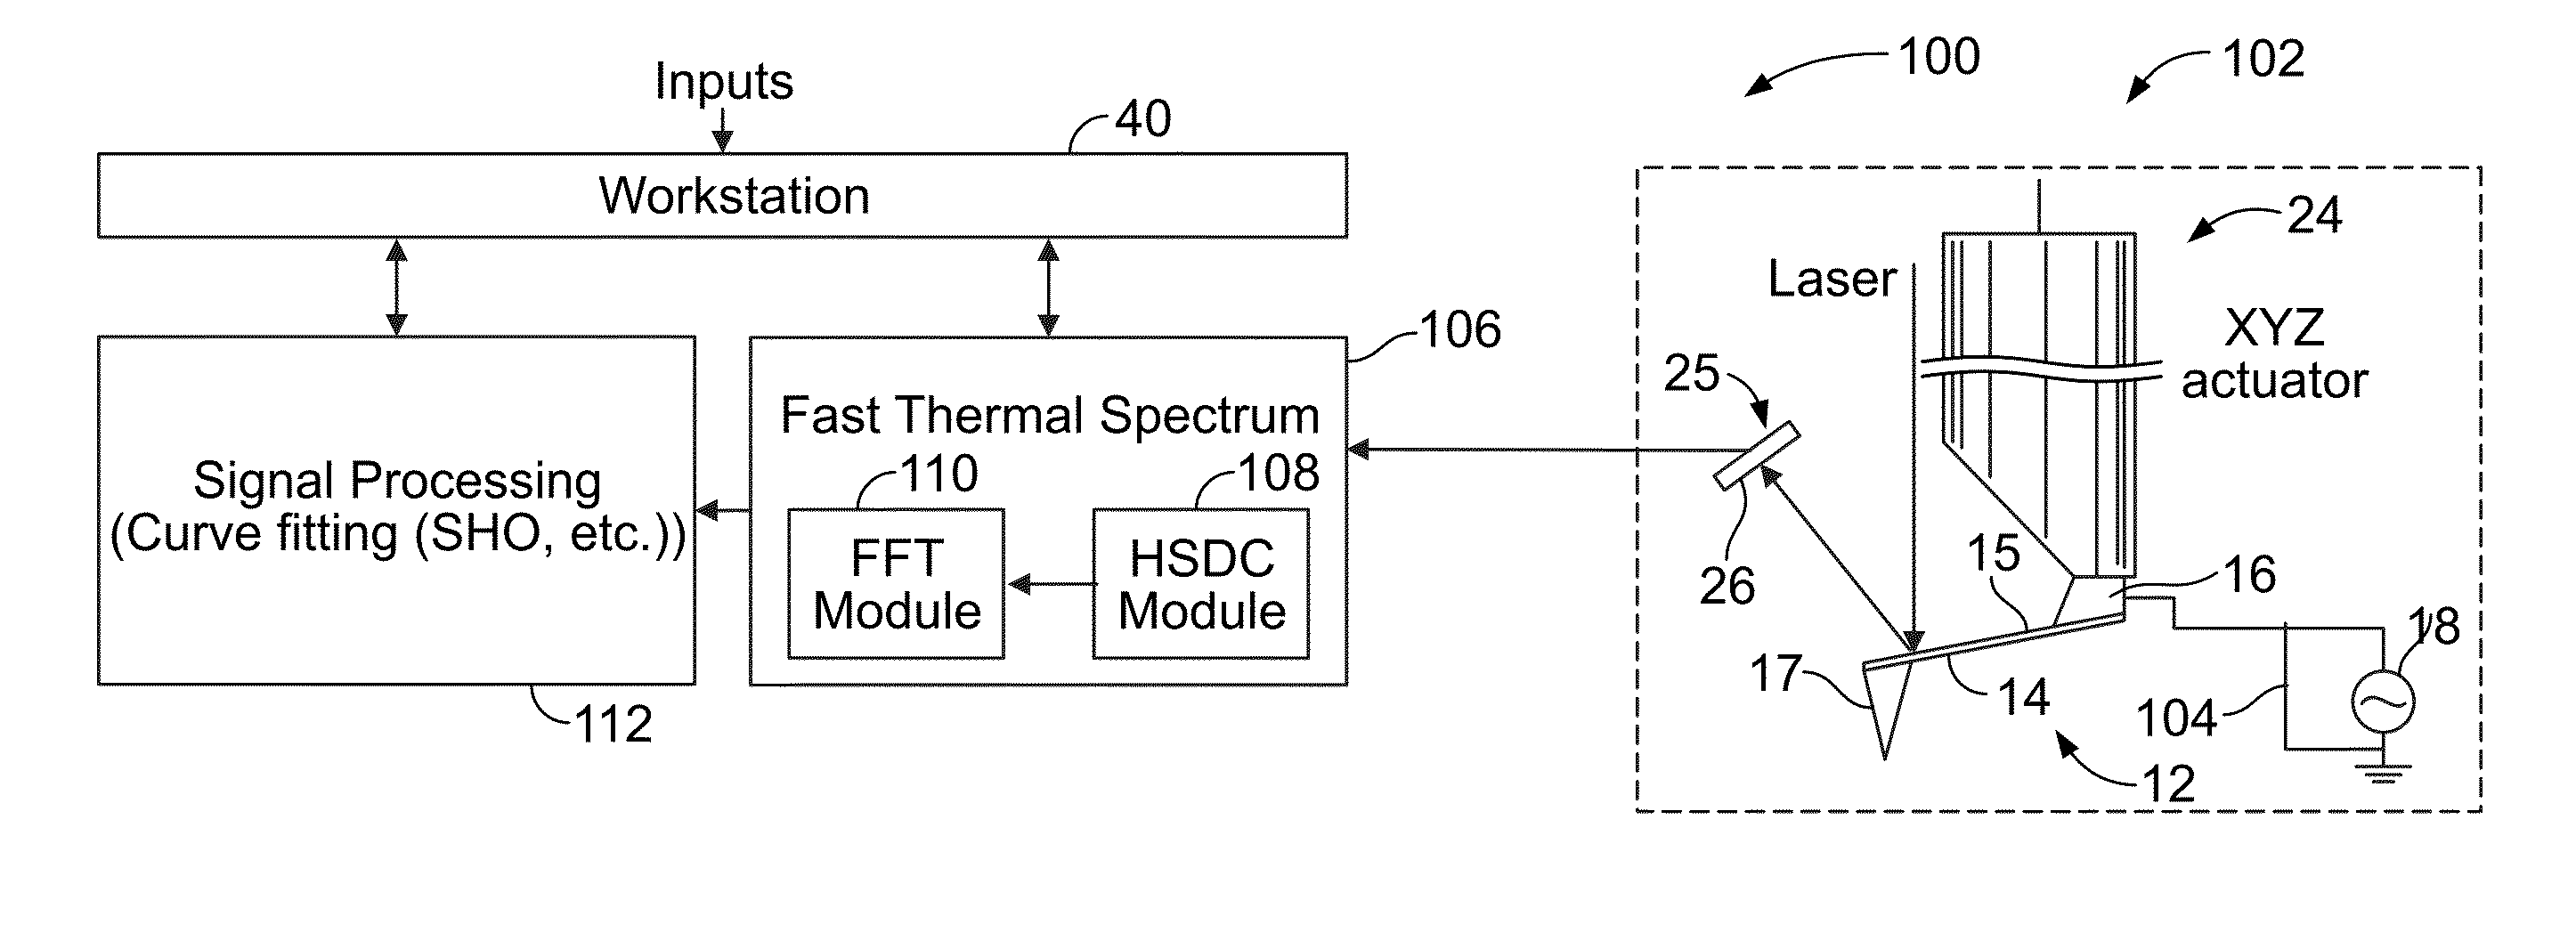
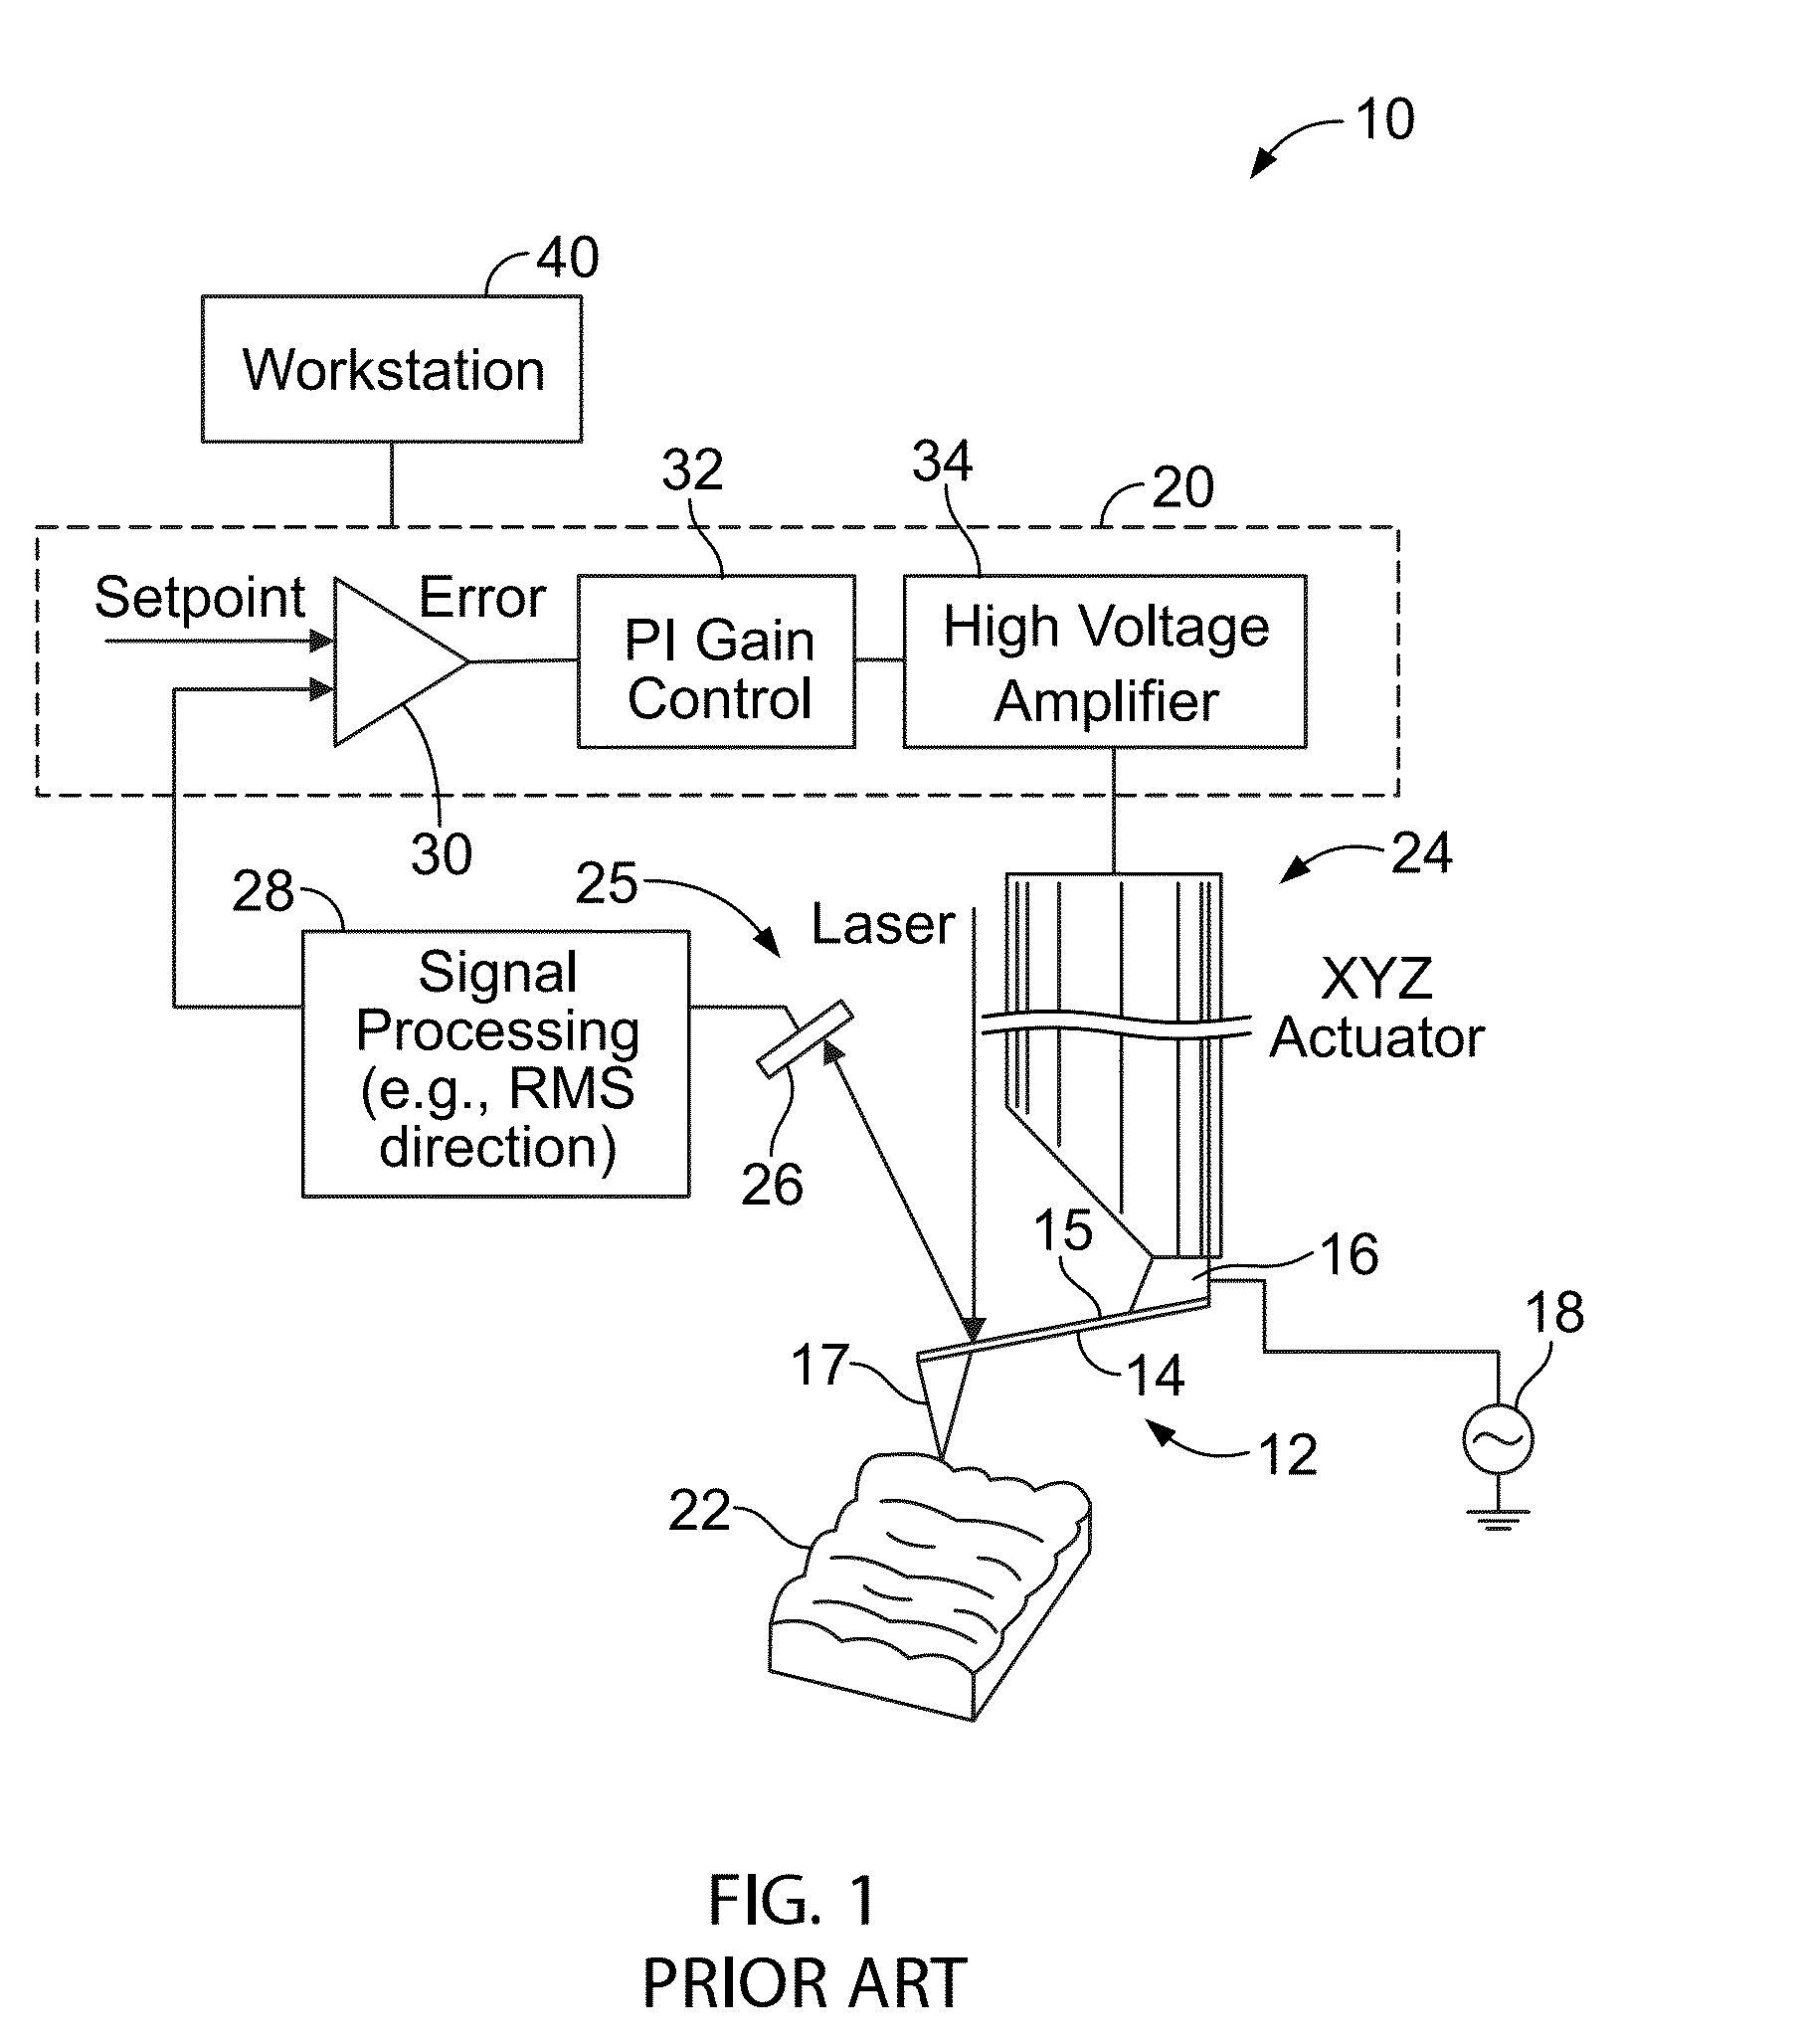
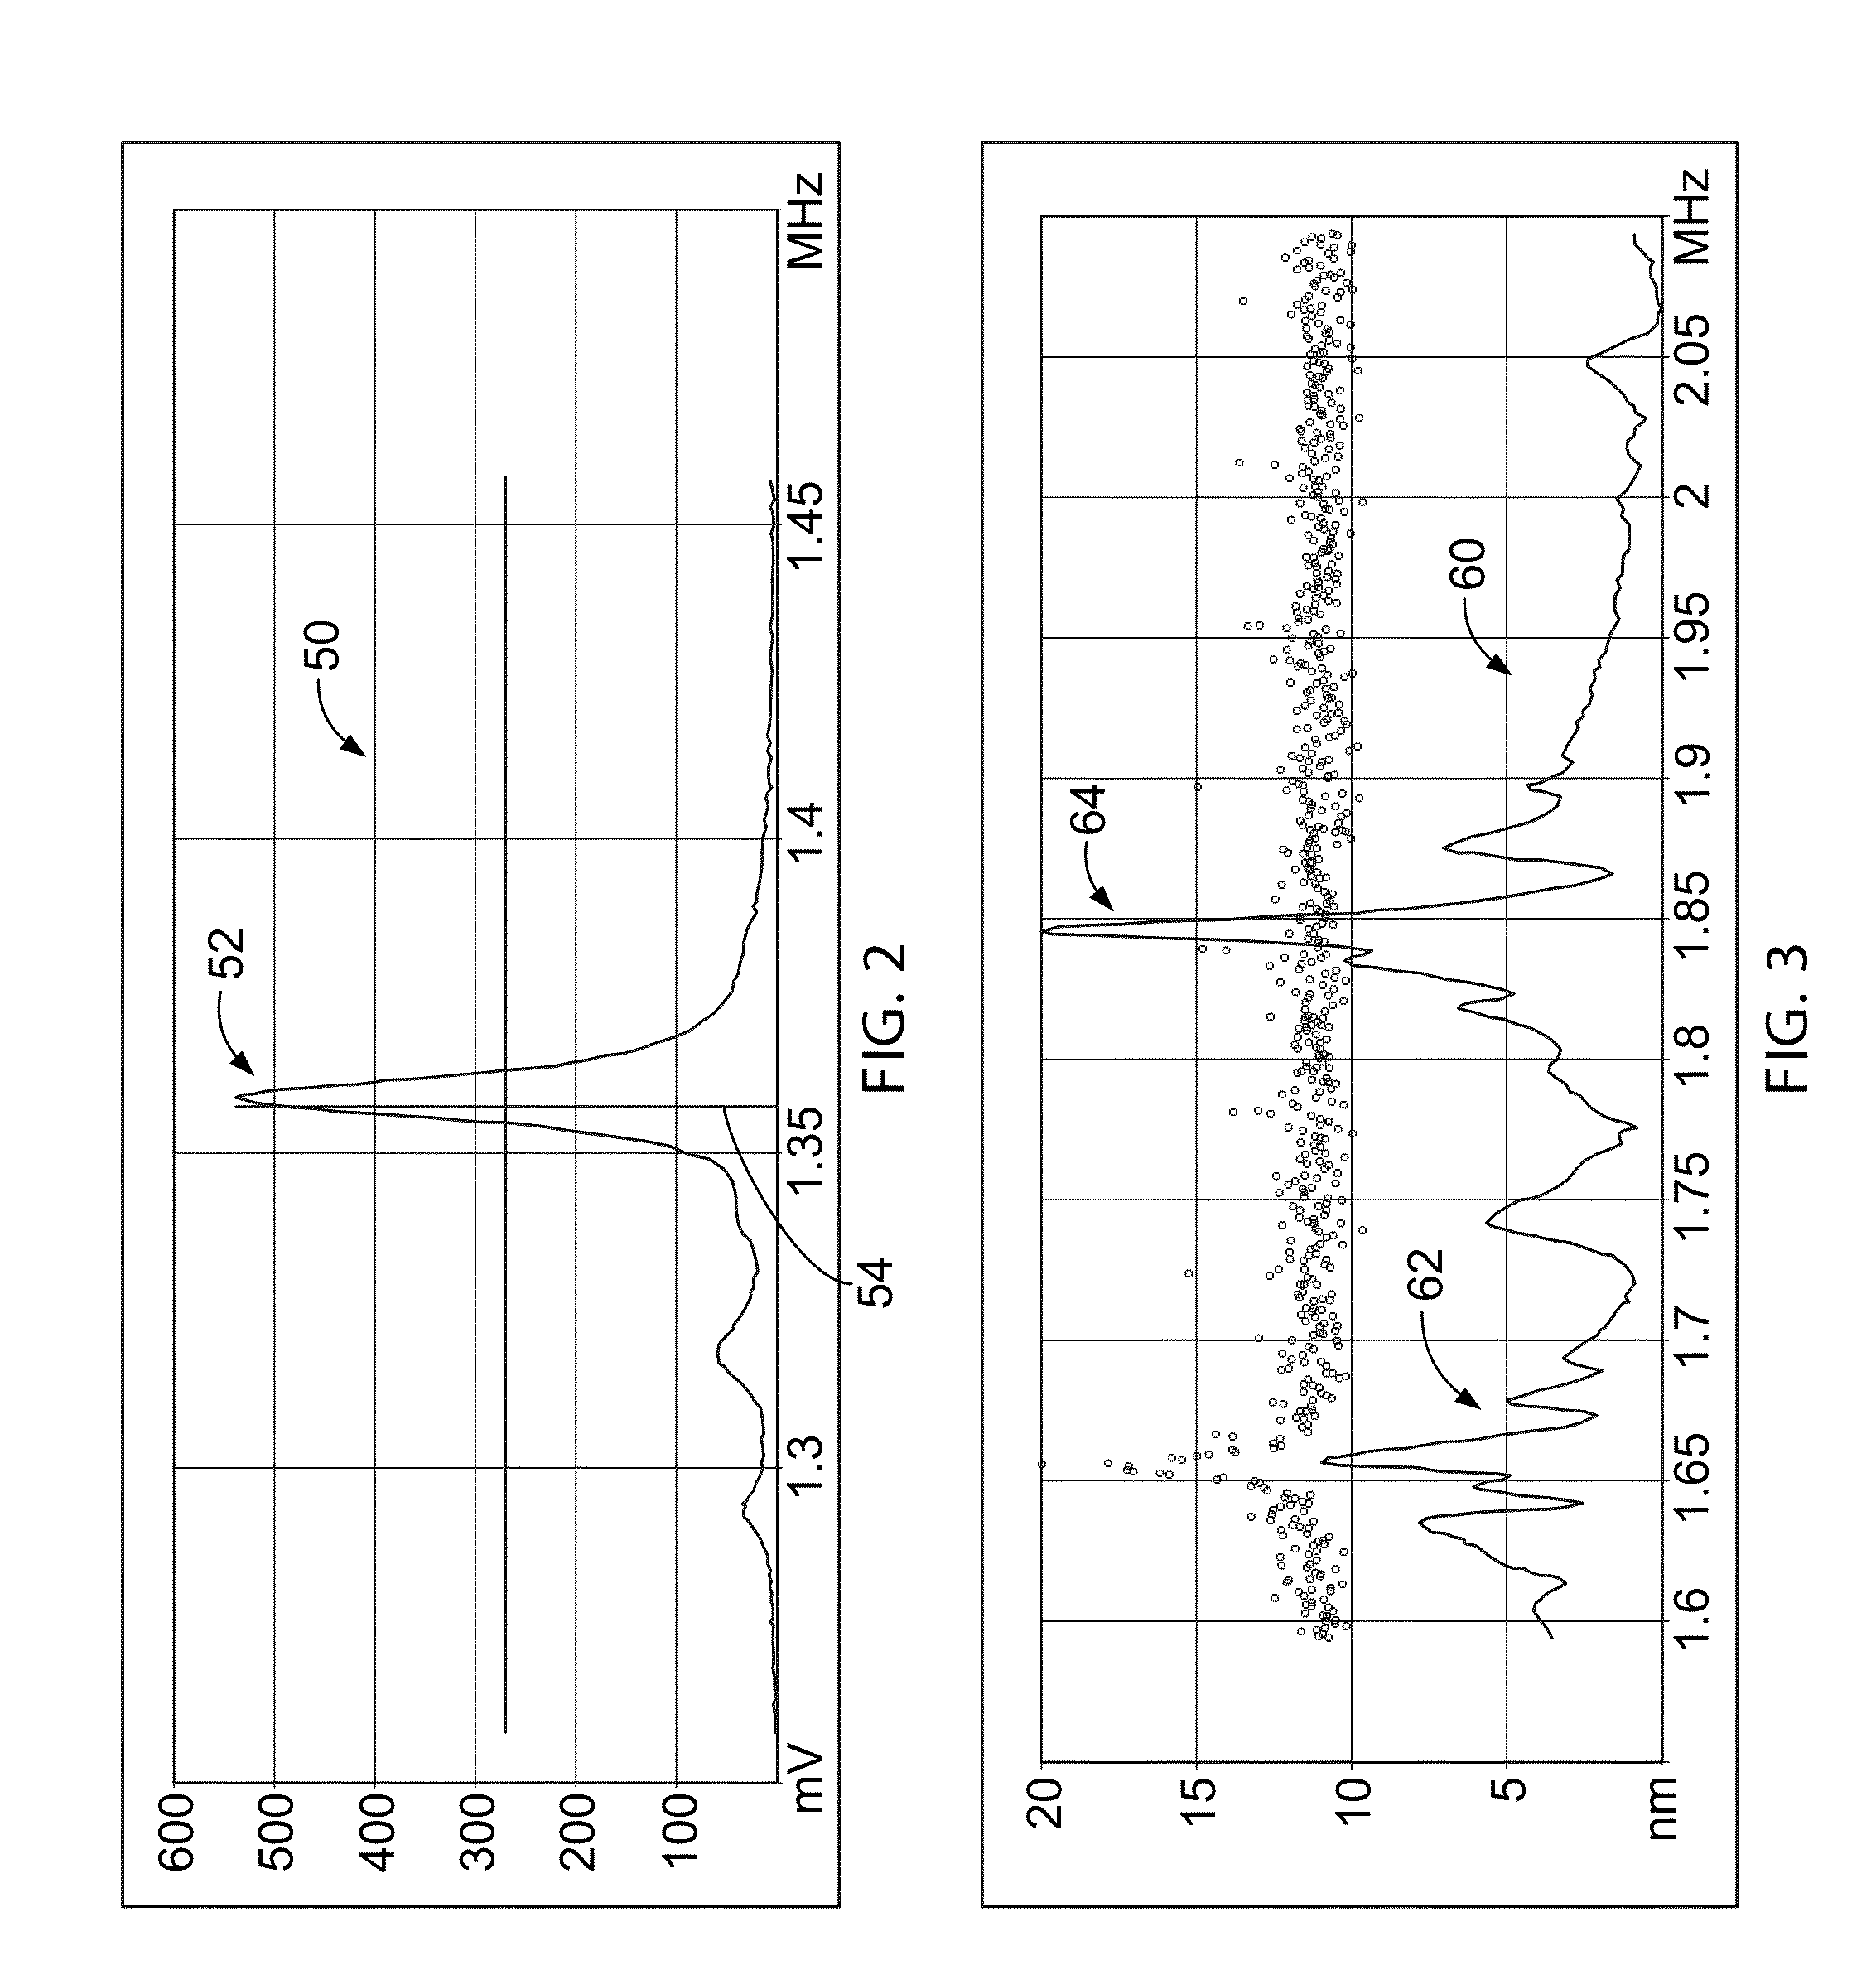
[0054]Contrary to known automatic tuning methods and apparatus used in connection with AFM operation, the preferred embodiments utilize only a thermally induced displacement power spectrum (TIDPS) to identify the resonant frequency of the AFM probe. The technique described herein allows the user to operate the AFM at an optimum drive frequency without the drawbacks associated with using conventional tuning curves, and with no human judgment. Prior to the present preferred embodiments, to tune an AFM, the user would always analyze (or call an auto-tune algorithm to analyze) the frequency swept amplitude response of the probe. By generating a TIDPS curve and considering only the peak(s) of that curve, the preferred embodiments avoid entirely the drawbacks associated with using conventional tuning curves to select AFM operating frequency.

[0055]Turning to FIG. 7, a system 100 for tuning an AFM 102 according to the preferred embodiments is shown. In contrast to conventional auto-tuning a...


PUM


Abstract

An apparatus and method of automatically determining an operating frequency of a scanning probe microscope such as an atomic force microscope (AFM) is shown. The operating frequency is not selected based on a peak of the amplitude response of the probe when swept over a range of frequencies; rather, the operating frequency is selected using only peak data corresponding to a TIDPS curve.

Description

CROSS-REFERENCE TO RELATED APPLICATION[0001]This application claims priority under 35 U.S.C. §119(e) to U.S. Provisional Patent Application Ser. No. 61 / 558,970, filed on Nov. 11, 2011, the entirety of which is expressly incorporated by reference herein.BACKGROUND OF THE INVENTION[0002]1. Field of the Invention[0003]The present invention is directed to scanning probe microscopes (SPMs), including atomic force microscopes (AFMs), and more particularly, to tuning the AFM for optimum operation.[0004]2. Description of Related Art[0005]Scanning probe microscopes (SPMs), such as the atomic force microscope (AFM), are devices which typically employ a probe having a tip and which cause the tip to interact with the surface of a sample with low forces to characterize the surface down to atomic dimensions. Generally, the probe is introduced to a surface of a sample to detect changes in the characteristics of a sample. By providing relative scanning movement between the tip and the sample, surfa...

Claims


Application Information

Patent Timeline
Patent Type & Authority Applications(United States)
IPC IPC(8): G01Q30/00
CPCG01Q30/00G01Q60/34G01Q30/04B82Y35/00G01Q40/00G01Q60/24
Inventor SU, CHANMINSILVA, PAULHUANG, LINPITTENGER, BEDEHU, SHUIQING
Owner BRUKER NANO INC
Why Eureka
Try Eureka