Automatic Visualization of Regional Functional Parameters of Left Ventricle from Cardiac Imaging

a technology of functional parameters and automated visualization, applied in the field of imaging, can solve the problems of inaccurate methods, high inter-observer variability, time-consuming, etc., and achieve the effects of high inter-observer variability, inaccurate methods, and time-consuming

Active Publication Date: 2016-04-21
IBM CORP
View PDF23 Cites 16 Cited by
  • Summary
  • Abstract
  • Description
  • Claims
  • Application Information

AI Technical Summary

Benefits of technology

[0005]The LV regional assessment typically relies on the visual inspection, analysis and interpretation of cine images of the left ventricle in multiple planes and

Problems solved by technology

Studies have shown that this method may be inaccurate, time

Method used


Image

  • Automatic Visualization of Regional Functional Parameters of Left Ventricle from Cardiac Imaging
  • Automatic Visualization of Regional Functional Parameters of Left Ventricle from Cardiac Imaging
  • Automatic Visualization of Regional Functional Parameters of Left Ventricle from Cardiac Imaging

Examples


Embodiment Construction

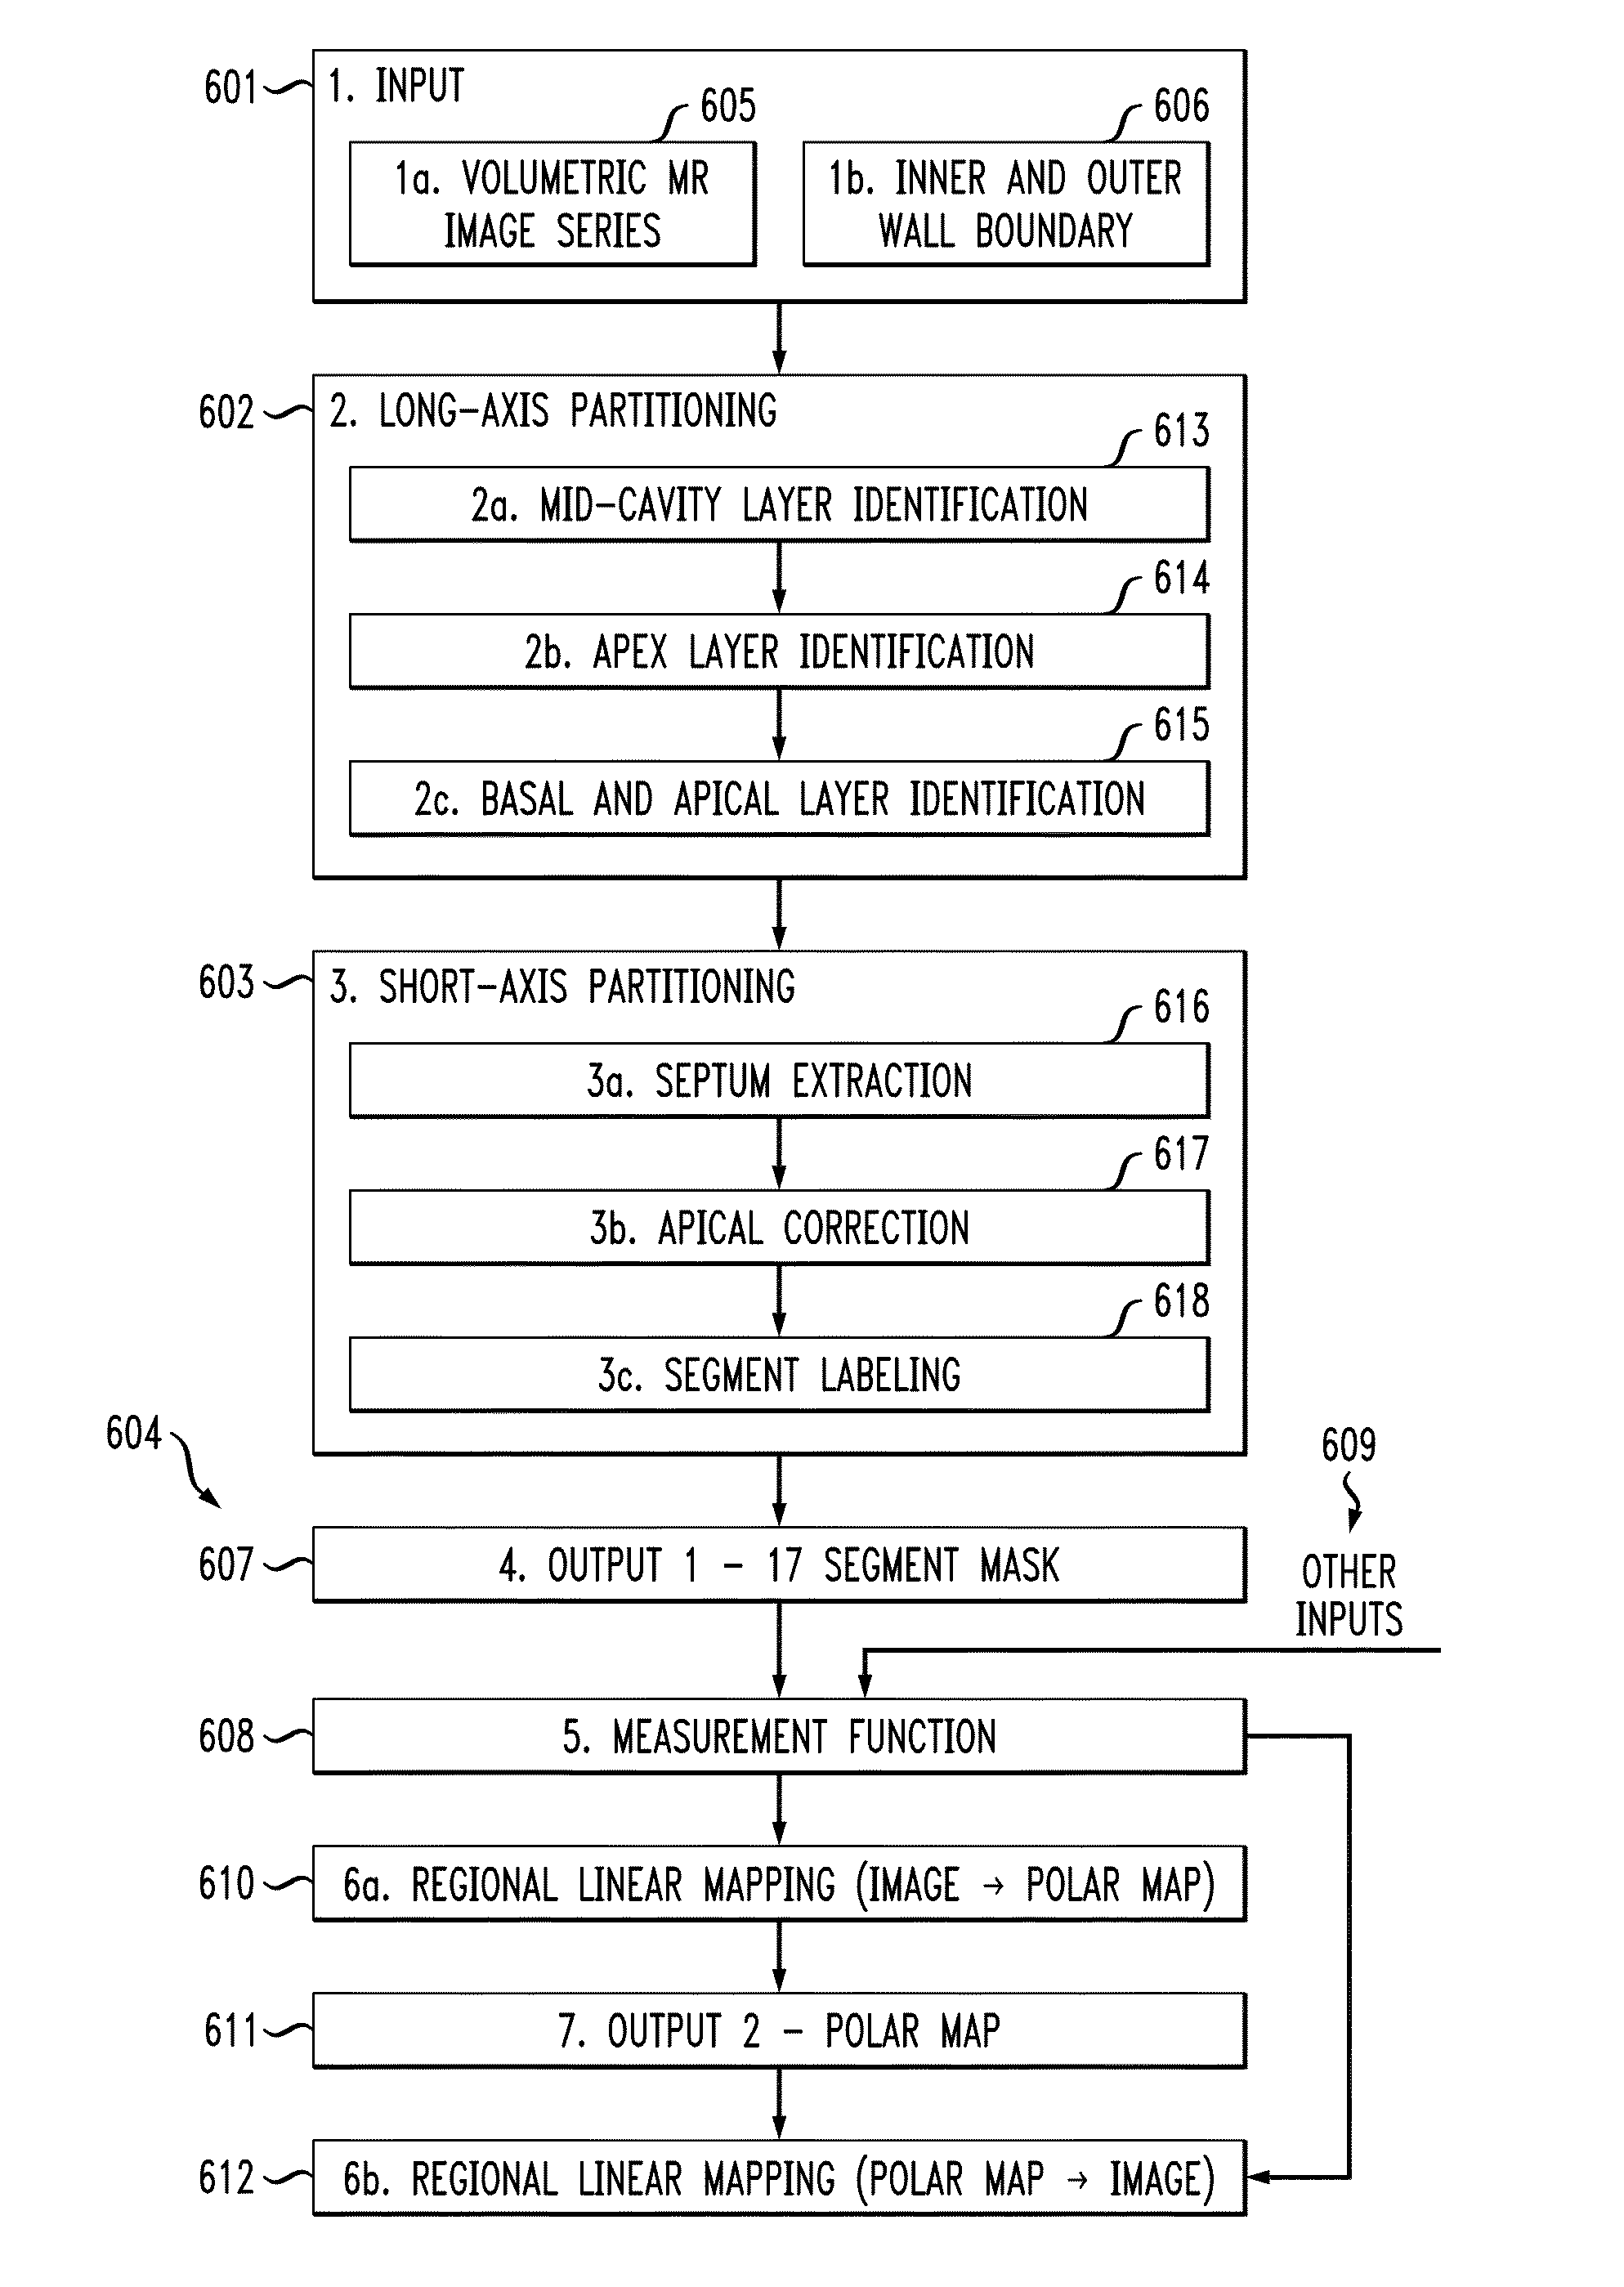
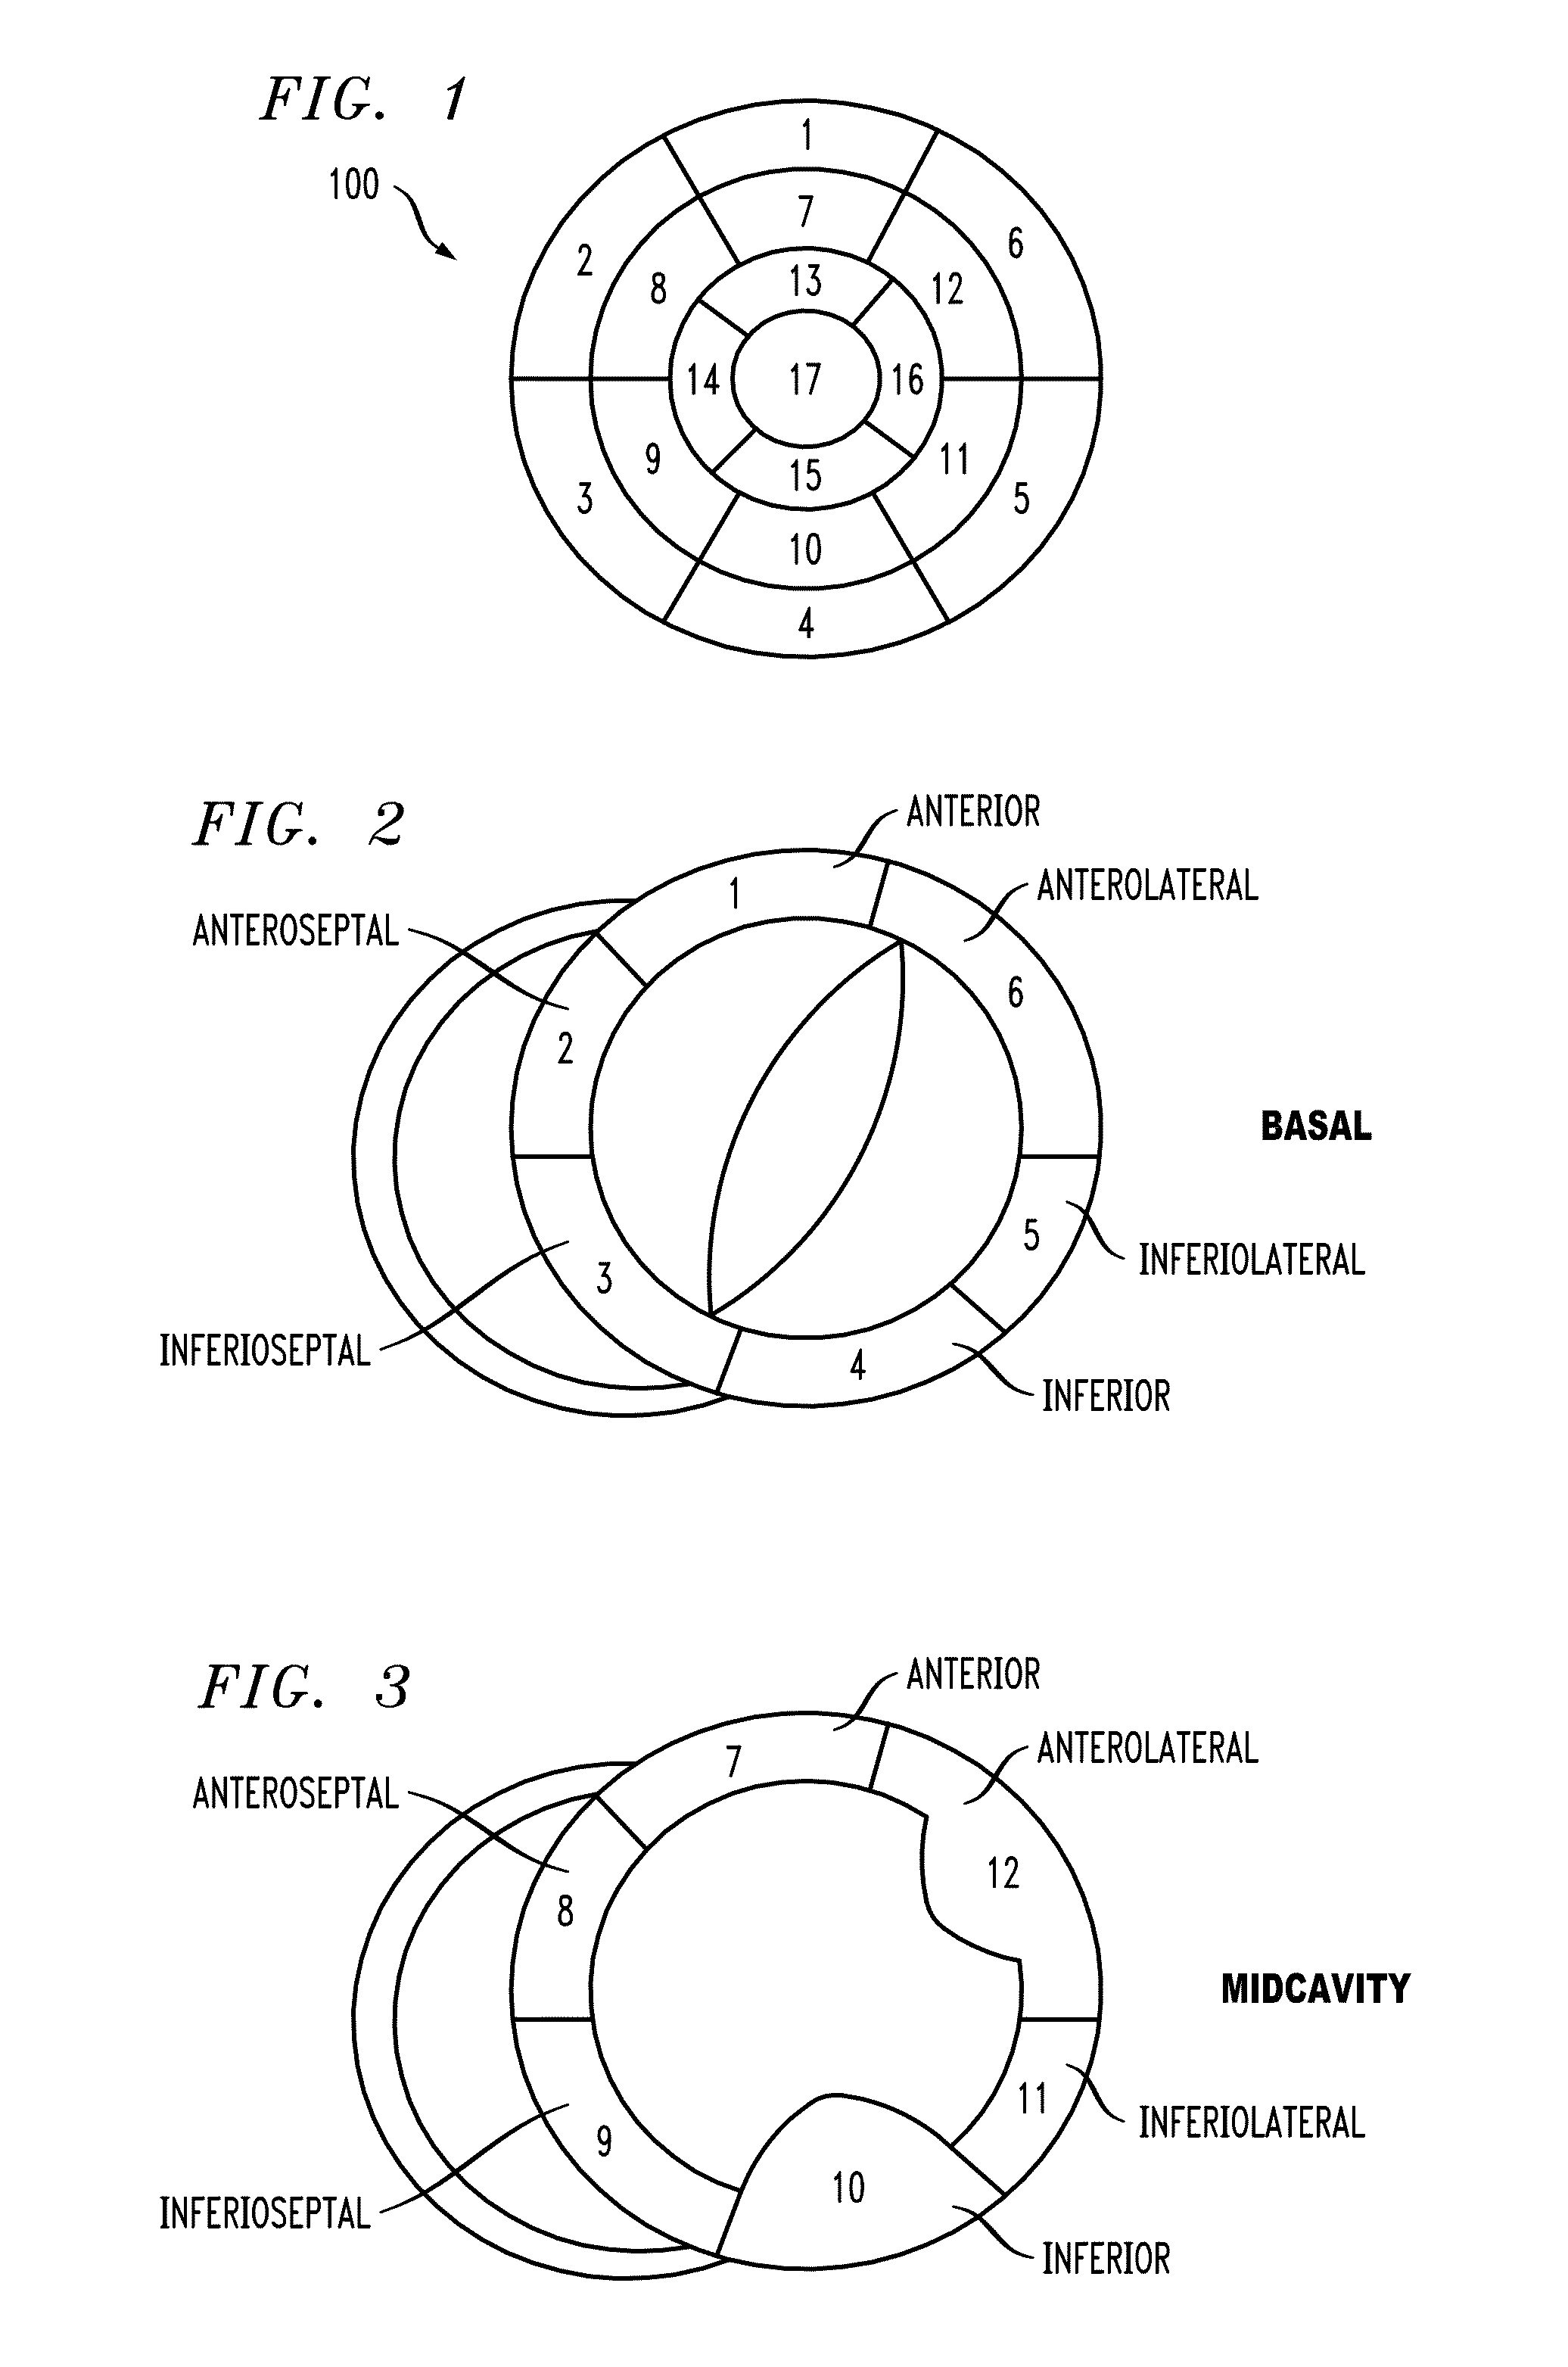
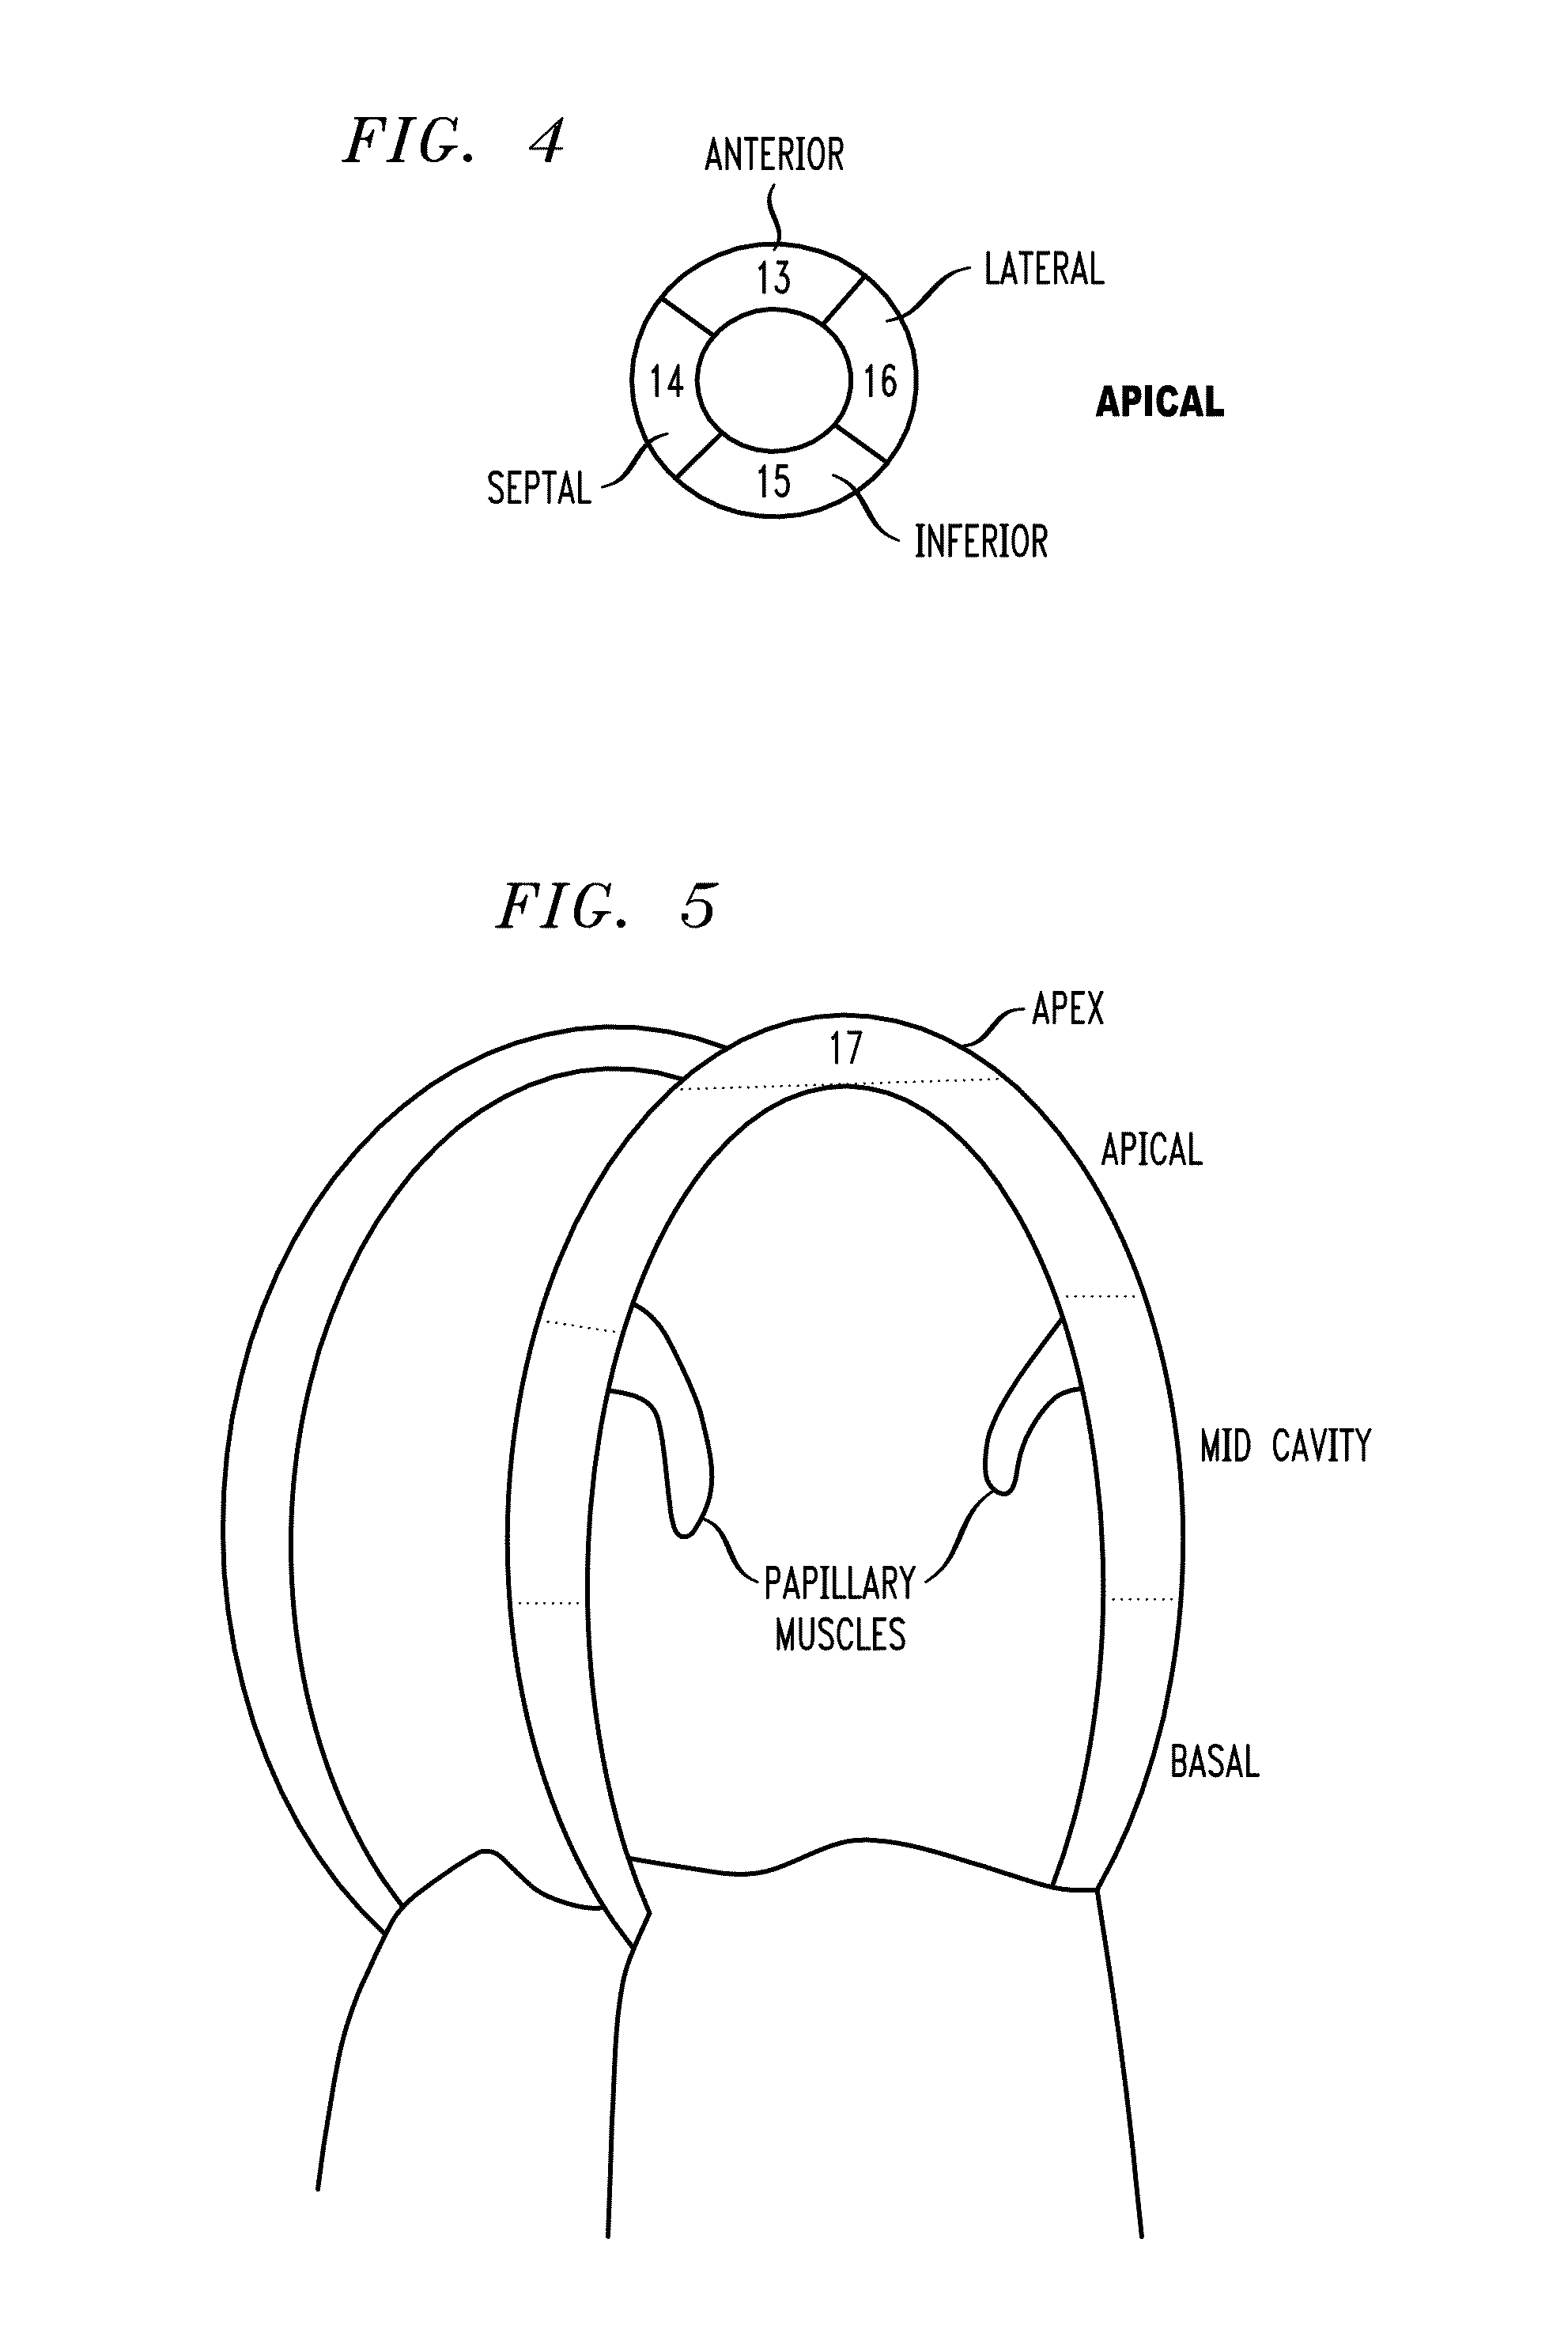
[0017]According to an exemplary embodiment of the present invention, functional parameters of a heart are visualized in cardiac MRI using a 2-dimensional (2D) polar map (see FIG. 1). Cardiac magnetic resonance (MR) images are 3D+cine images, which enable the assessment of a beating heart. According to an exemplary embodiment of the present invention, a 1-to-1 linkage is built from volumetric cardiac MR images series of one or more time-points in the heart cycle to a 2D color-coded polar map. Various functional parameters can be represented in the polar map, such as the LV wall motion and thickness.

[0018]The LV regional assessment typically relies on the visual inspection, analysis and interpretation of cine images of the left ventricle in multiple planes and the interpretation of LV regional functions. For example, LV wall (myocardium) motion is an important regional assessment in evaluating the LV. The diagnosis of abnormal LV wall motion is generally based on the reading of cardia...


PUM


Abstract

A method for automatically identifying and localizing anatomical regions of a left ventricle of a heart using a segment model, the method including receiving a volumetric MR image series of one or more time-points in a heart cycle with associated myocardial boundaries, representing the heart, performing a long-axis partitioning on each image of the volumetric image series, performing a short-axis partitioning volumetric image series, generating a polar map, wherein each image of the volumetric image series is mapped to a location on the polar map, wherein the location is characterized using the long-axis partitioning and the short-axis partitioning, and generating a mapping from the polar map to a voxel in an associated image of the volumetric image series representing an anatomical location.

Description

CROSS-REFERENCE TO RELATED APPLICATIONS[0001]This application claims the benefit of U.S. Provisional Patent Application No. 62 / 065,636 filed on Oct. 18, 2014, the complete disclosure of which is herein expressly incorporated by reference in its entirety for all purposes.BACKGROUND[0002]The present disclosure relates to methods for imaging, and more particularly to a method for generating a polar map to visualize regional functional parameters extracted from cardiac imaging data.[0003]Assessment of left ventricular abnormalities in magnetic resonance images is widely accepted as a predictor of cardiac disease. The quantitative assessment of the left ventricle (LV) includes global and regional measurements.[0004]In most computer-aided diagnosis systems of cardiac magnetic resonance imaging (MRI), the global functional parameters are commonly available, such as ejection fraction, LV mass, stroke volume, end-diastolic volume and end-systolic volume.[0005]The LV regional assessment typic...

Claims


Application Information

Patent Timeline
IPC IPC(8): G06T7/20A61B5/00G06T7/40A61B5/055G06T7/00G06T11/00
CPCG06T7/20G06T7/0044G06T7/0065G06T11/008G06T7/40G06T2207/20148A61B5/055A61B5/0044G06T2207/10028G06T2207/10088G06T2207/30048G06T7/0053G06T7/0012G06T7/0016G06T7/136G06T2207/10076G06T2207/10081G06T2207/10104
Inventor GARNAVI, RAHILLIANG, XISYEDA-MAHMOOD, TANVEER FATHIMAWAIL, SIMON FRANK
Owner IBM CORP
Why Eureka
Try Eureka