Magnetic resonance imaging contrast agent capable of detecting hydrogen peroxide and reducing reactive oxygen species
Active Publication Date: 2017-03-02
AUBURN UNIV
0 Cites 4 Cited by
AI-Extracted Technical Summary
Problems solved by technology
The over-production of reactive oxygen species (ROSs), such as H2O2, O2−, and hydroxyl radicals, has been associated with several lethal and debilitating health conditions.
Although these...
Method used
TABLE 4Selected bond lengths (Å) for complexes 3 and 4Complex23Mn—N(1)2.241(5)2.252(8)Mn—N(2)2.338(6)2.395(8)Mn—N(3)2.346(6)2.395(8)Mn—N(4)2.272(5)2.252(8)Mn—Br(1)2.6244(14 2.5971(19)Mn—Br(2)2.6134(15 2.5971(19)O(1)—C(13)1.363(8) 1.226(15)O(2)—C(10) 1.383(10) 1.242(16)O(3)—C(22) 1.395(11) 1.242(16)O(4)—C(19) 1.334(10) 1.226(15)N(1) and N(4) correspond to pyridine nitrogens; N(2) and N(3) correspond to amine nitrogens. The atoms in 4 have been relabeled in order to facilitate comparison to those in the structure of 3.
[0130]The DPPH (2,2-diphenyl-1-picryl-hydrazyl-hydrate) free radical method is an alternative antioxidant activity assay based on electron-transfer that produces a violet solution in ethanol or methanol. This free radical, stable at room temperature, is reduced in the presence of an antioxidant molecule, giving rise to colorless ethanol or methanol solution. The use of the DPPH assay provides an easy and rapid way to evaluate antioxidants by spectrophotometry, so it can be useful to assess various products at a time.
[0175]All MRI data were collected at the Auburn University MRI Research Center (Auburn, Ala.) on a Siemens Verio open-bore 3-T MRI clinical scanner. A 15-channel knee coil was used to simultaneously image 12-26 samples. An inversion recovery (IR) sequence was used that featured a non-selective adiabatic inversion pulse followed by a slice-selective gradient recalled echo (GRE) readout after a delay period corresponding to the inversion time (TI).1-2 The GRE was a saturation readout, such that only one line of k-space was acquired per repetition time (TR). This method was selected to maximize both the signal strength and the accuracy of the T1 estimates. Specific imaging parameters were as follows: TR was set to 4 s, TI was varied from 4.8 to 2500 ms over 37 steps, the echo time (TE) was set to 3.6 ms, the flip angle equaled 90°, averages=1, slice thickness=5 mm, field of view=140×140 mm, matrix=128×128, resulting in a pixel size of 1.1×1.1×5.0 mm. All samples were run in 50 mM solutions of HEPES in water, buffered to pH 7.0 and kept at 22° C. The manganese content was systematically varied from 0.10 to 1.00 mM. The inverses of the T1 values were plotted versus the concentration of Mn(II) to obtain r1 values. All reported r1 values are averages from the results of two separate series of experiments. Each series of experiments used a different batch of 1.
[0199]FIG. 14 shows plots of (1/T1) versus Mn(II) concentration for 1 in the presence of various oxidants. All samples were run in 298 K aqueous solutions containing 50 mM HEPES buffered to pH 7.00, using a 3 T field provided by a clinical MRI scanner. The data were fit to the indicated linear equations; the y-intercepts were within error of 1/T1 measurements associated with two control samples that contained no Mn(II): (A) 10 mM H2O2 in 50 mM HEPES buffer and (B) pure 50 mM HEPES buffer (both 0.46 s−1). The oxidation of 1 by 2,3-dichloro-5,6-dicyano-1,4-benzoquinone (DDQ) occurred in CH2Cl2. After the reaction occurred, the 2,3-dichloro-5,6-dicyanoquinol product was removed via filtration, the CH2Cl2 was removed, and the sample was dissolve in HEPES buffer for MRI analysis. The other oxidation reactions occurred entirely in HEPES buffer. The addition of KO2 and DDQ resulted in enhanced relaxivity; the addition of NaClO, conversely, did not trigger a MRI response.
[0213]The product of DDQ oxidation, 4, was also crystallized and structurally characterized (FIG. 18). In FIG. 18, all hydrogen atoms and solvent molecules are omitted for clarity and all thermal ellipsoids are drawn at 50% probability. The atoms have been relabeled from those in the CIF file in order to facilitate comparison to the structure of 3. The metal center remains hexacoordinate and retains the same N4Br2 coordination sphere upon oxidation. The C—O bonds shorten to 1.23 Å (Table 4), confirming the oxidation of both quinols to para-quinones. Upon oxidation, the bonds between the Mn(II) and the amine N atoms lengthen slightly while those between the Mn(II) and the Br atoms slightly contract. Although the crystals are colored, the oxidation state of the manganese remains +2, as best structurally evidenced by the Mn—N and Mn—Br bond distances. None of the bonds are significantly elongated or shortened relative to their counterparts in 3. The absence of Jahn-Teller distortions further supports the assignment of the +2 oxid...
Benefits of technology
[0013]An advantage of the present invention is that the disclosed metal complexes are responsive to a reactive oxygen species in a novel mechanism. Upon oxidation, the metal ion of the complexes does not change its oxidation state, instead the ligand is oxidized. More importantly, the T1-weighted relaxivities of the disclosed complexes increase upon oxidation, providing a signal that can be detected and quantified by magnetic resonance imaging.
[0014]Serendipitously, the disclosed metal complexes not only respond to biologically relevant oxidants with increases in their respective relaxivities, providing a signal for MRI imaging, but also exhibit good antioxidant properties and low cytotoxicities. Therefore, the disclosed complexes can serve as potent an...
Abstract
The current invention provides metal ion complexes with an organic ligand, compositions comprising such complexes. In particular, these complexes are capable of reacting with a reactive oxygen species in a subject and increase their T1-weighted relaxivities so a clinical MRI scanner can detect an oxidative stress hotspot in the subject. The disclosed complexes also exhibit excellent anti-oxidant properties and low cell toxicity, therefore can be used as a therapeutic agent to relieve oxidative stress in the subject, or as both a MRI contrast agent and therapeutic agent in a composition.
Application Domain
In-vivo testing preparationsGroup 7/17 element organic compounds
Technology Topic
IonChemistry +13
Image
Examples
- Experimental program(2)
Example
Example 1
Syntheses and Characterization of N,N,N′-tris(2-pyridinylmethyl)-1, 2-ethanediamine
[0180]The procedure to synthesize and characterize N,N,N′-tris(2-pyridinyl-methyl)-1,2-ethanediamine is described in a paper by Mialane, et al. (Mialane, P.; Nivorojkine, A.; Pratviel, G.; Azêma, L.; Slany, M.; Godde, F.; Simaan, A.; Banse, F.; Kargar-Grisel, T.; Bouchoux, G.; Sainton, J.; Homer, O.; Guilhem, J.; Tchertanova, L.; Meunier, B.; Girerd, J.-J. Inorg. Chem. 1999, 38 (6), 1085-1092.) This Mialane paper is herein incorporated by reference in its entirety.
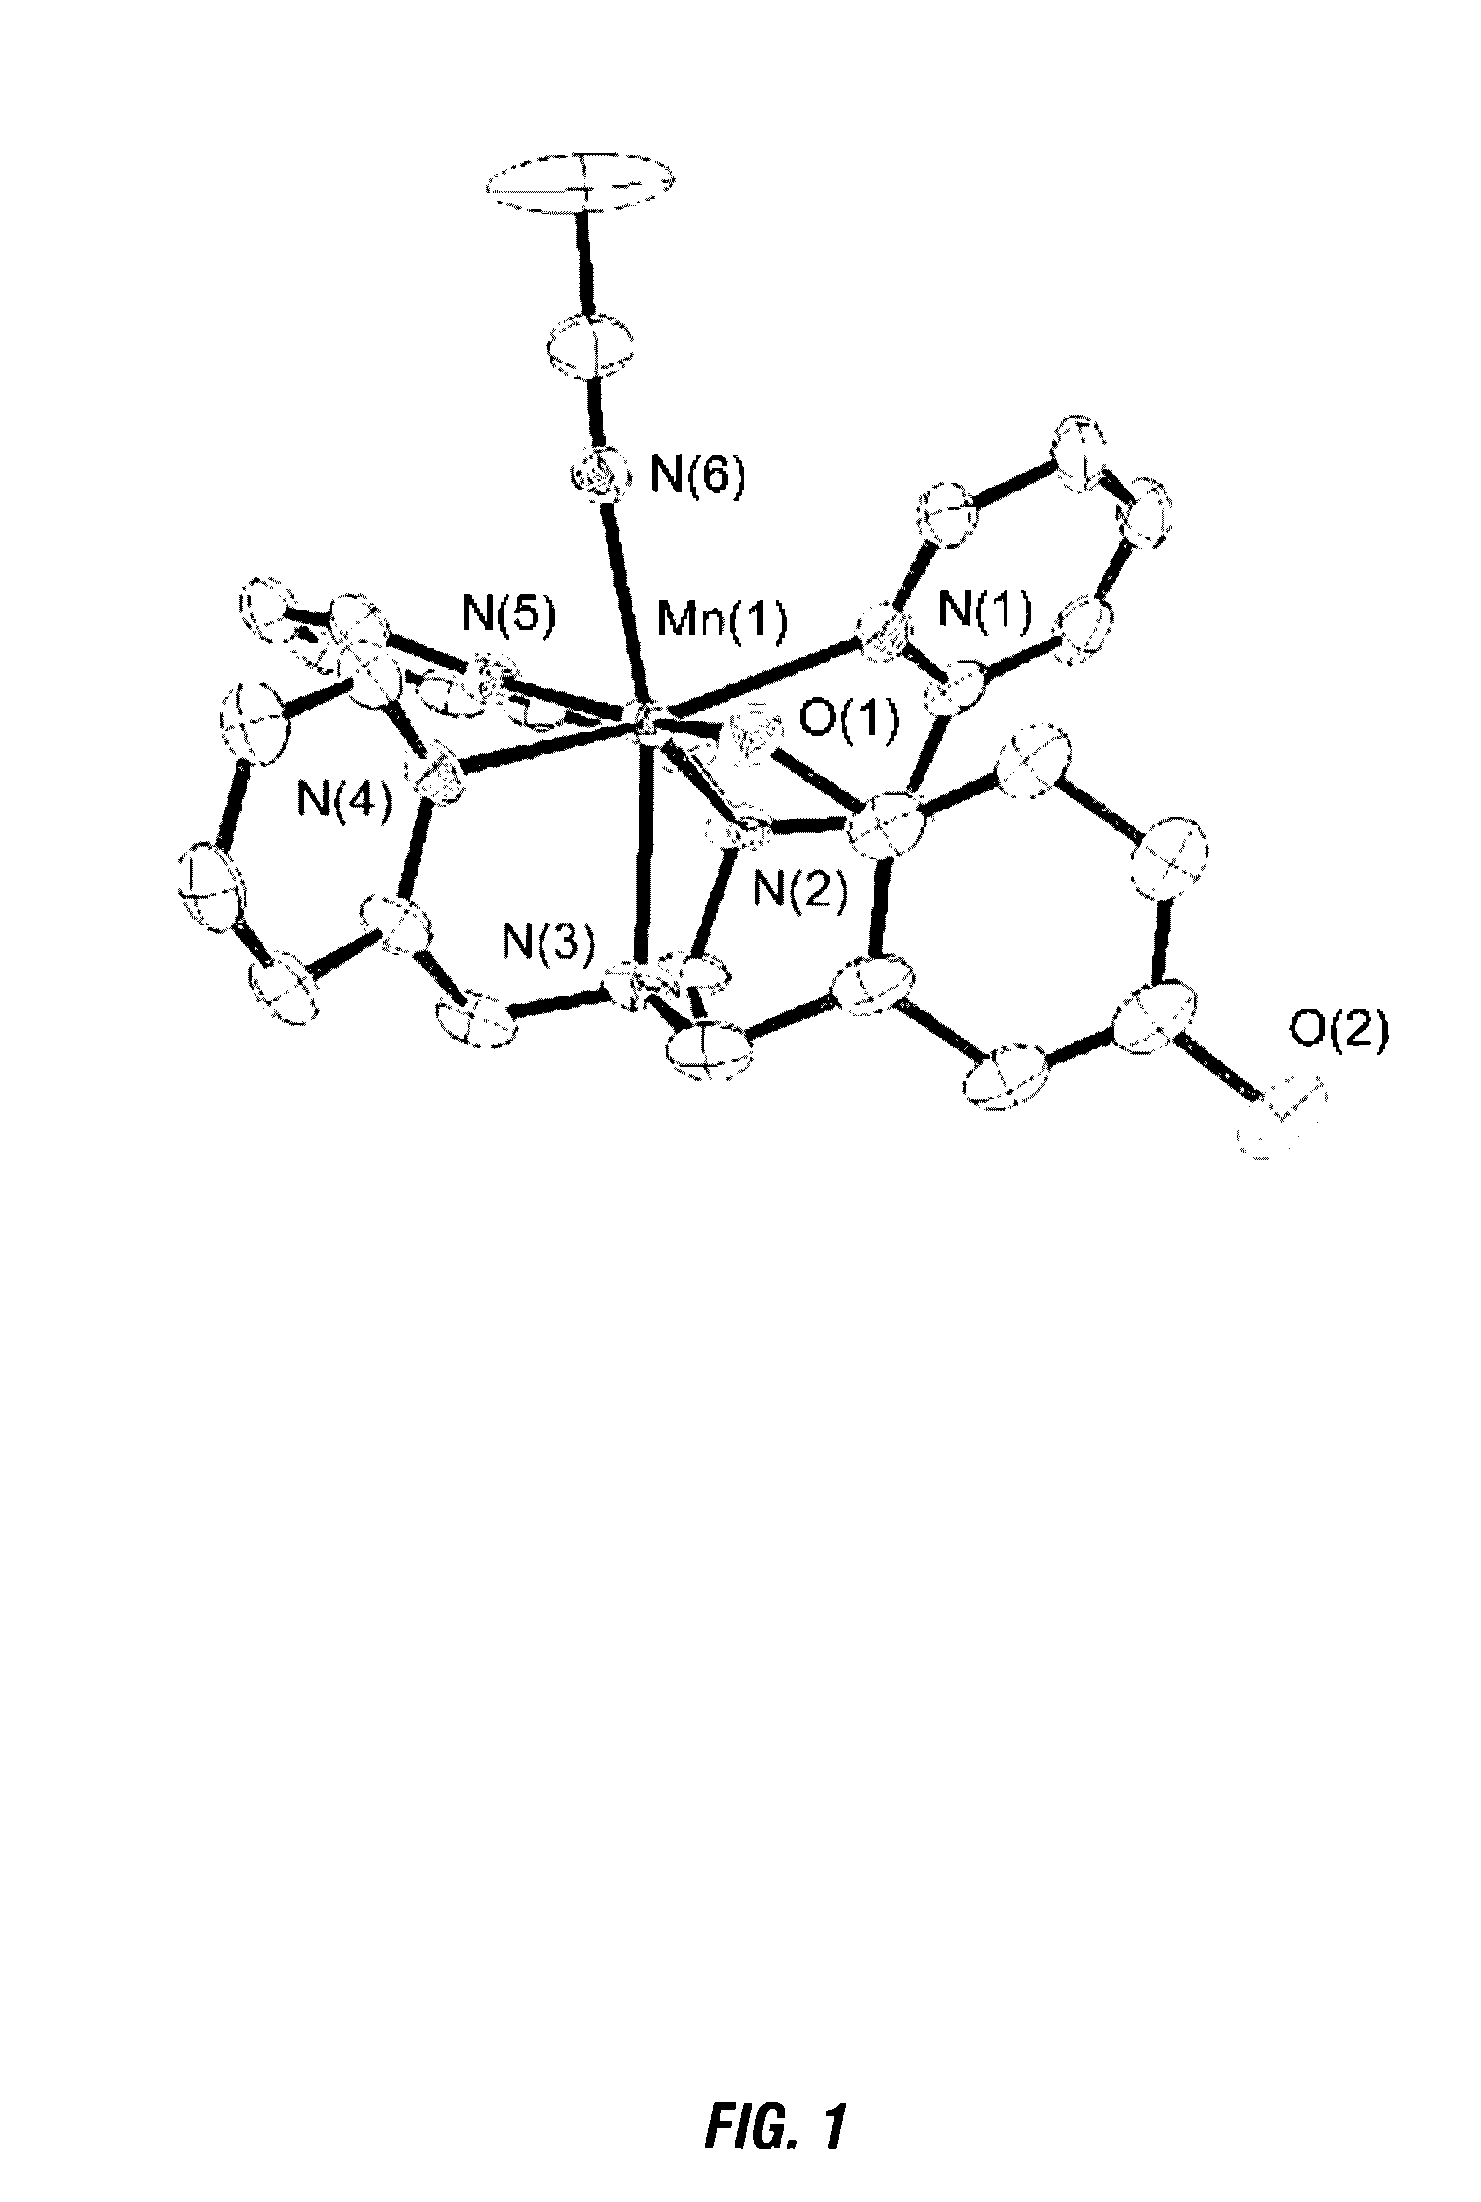
Syntheses and Characterization of a Mononuclear Mn(II) Complex with the Redox-Active Ligand N-(2, 5-dihydroxybenzyl)-N,N′,N′-tris(2-pyridinylmethyl)-1, 2-ethanediamine (H2qtp1)
[0181]For the organic component of the sensor, the hexadentate ligand N-(2,5-dihydroxybenzyl)-N,N′,N′-tris(2-pyridinylmethyl)-1,2-ethanediamine (H2qtp1, Scheme 1) is synthesized. The H2qtp1 ligand is prepared in one step from a reaction between the synthesized N,N,N′-tris(2-pyridinyl-methyl)-1,2-ethanediamine and commercially available 2,5-dihydroxybenzaldehyde. Pure H2qtp1 can be obtained through precipitation of the crude from methanol/ether (40% yield).
N-(2,5-Dihydroxybenzyl)-N,N′,N′-tris(2-pyridinylmethyl)-1,2-ethanediamine (H2qtp1)
[0182]N,N,N′-Tris(2-pyridinylmethyl)-1,2-ethanediamine (2.31 g, 6.93 mmol) and 2,5-dihydroxybenzaldehyde (1.05 g, 7.63 mmol) were dissolved in 40 mL of 1,2-dichloroethane. Subsequently, NaBH(OAc)3 (4.43 g, 20.8 mmol) was added as a solid over 1 h. The resultant mixture was stirred for 24 h, at which point 80 mL of saturated NaHCO3 solution were added to quench the reaction. The crude product was extracted with three 40 mL portions of CH2Cl2. The combined extracts were washed with one 40 mL portion of H2O then dried over anhydrous Na2SO4. Evaporation of the solvent yielded the crude product, which was further purified via precipitation from a MeOH/ether mixture to yield a pale yellow powder (1.25 g, 40% yield). 1H NMR (400 MHz, CDCl3, 293 K): δ 8.53 (1H, d, J=4.8 Hz), 8.49 (2H, d, J=4.8 Hz), 7.59 (3H, m), 7.50 (2H, d, J=8.0 Hz), 7.23 (1H, d, J=8.0 Hz), 7.13 (3H, m), 6.68 (2H, m), 6.48 (1H, d, J=4.8 Hz), 3.73 (6H, s), 3.59 (2H, s), 2.74 (4H, s). 13C NMR (400 MHz, CDCl3, 293 K): δ 159.11, 157.68, 148.91, 148.83, 136.82, 136.60, 123.51, 123.29, 123.01, 122.43, 122.08, 116.87, 116.34, 115.67, 60.24, 59.53, 56.94, 50.71, 50.66. IR (KBr, cm−1): 3380 (m), 3148 (s), 3126 (s), 2929 (m), 2879 (w), 2718 (w), 2617 (w), 1655 (w), 1596 (m), 1569 (m), 1490 (s), 1435 (s), 1400 (s), 1368 (s), 1249 (m), 1204 (w), 1147 (w), 1009 (w), 936 (w), 860 (w), 826 (w), 817 (w), 760 (s), 713 (w). MS (ESI): Calcd for MH+ 456.2400. Found, 456.2341.
Acetonitrilo(N-(2,5-dihydroxy-benzyl)-N,N′,N′-tris(2-pyridinylmethyl)-1,2-ethanediamine)manganese(II) triflate ([Mn(H2qtp1)(MeCN)](OTf)2, 1)
[0183]The H2qpt1 ligand (500 mg, 1.10 mmol) and Mn(OTf)2 (388 mg, 1.10 mmol) were dissolved in 2 mL of MeCN under N2. The solution was allowed to stir at room temperature for 16 h. After this time, 2 mL of ether were added to the solution, and the mixture was transferred to a −40° C. freezer. The product deposited as a white powder over several hours (660 mg, 74% yield). Crystals suitable for single crystal X-ray diffraction were grown from the diffusion of ether into a saturated solution of the powder in MeCN. Solid-state magnetic susceptibility (295 K): μeff=5.6 μB. UV/vis (H2O, 294 K): 262 nm (9370 M−1 cm−1), 292 nm (2550 M−1 cm−1). MS (ESI): Calcd for [Mn(L-H)]+, 509.1624 and for [Mn(L)(OTf)]+, 659.1222. Found, 509.1630 and 659.1226. IR (KBr, cm−1): 3384 (m), 2957 (w), 2858 (w), 2697 (w), 1695 (w), 1605 (s), 1573 (w), 1505 (m), 1483 (m), 1445 (m), 1368 (m), 1346 (m), 1606 (s), 1294 (s), 1249 (s), 1224 (s), 1203 (s), 1170 (s), 1154 (s), 1076 (m), 1030 (s), 1011 (m), 1259 (m), 976 (w), 963 (w), 940 (w), 882 (w), 854 (w), 827 (w), 771 (m), 638 (s), 917 (m), 574 (m), 516 (m), 412 (w). EPR (H2O, 77 K): geff=1.98. Elemental Analysis: Calcd for C29H29N5MnF6O8S2.2H2O: C, 41.24%; H, 3.94%; N, 8.29%. Found: C, 41.08%; H, 3.97%; N, 8.28%.
[0184]At first glance, H2qtp1 strongly resembles the Hptp1 ligand, which has a methyl group installed para to the phenol hydroxyl group. The substitution of a hydroxyl group for the methyl, however, enables a fundamentally different chemical response to oxidants. The redox-active portion of H2qtp1 is a quinol, which is anticipated to oxidize to a more weakly metal-coordinating para-quinone upon exposure to H2O2 (Scheme 2) instead of oxidatively coupling to other phenols like Hptp1. Although manganese was not previously known to catalyze quinol oxidation, other redox-active transition metal ions have been reported to do so.5-6 The manganese therefore serves as both the paramagnetic reporter for the contrast agent and the catalyst for the oxidation of the ligand.
[0185]The reaction between H2qtp1 and manganese(II) triflate in anaerobic acetonitrile yields [Mn(H2qtp1)(MeCN)](OTf)2 (Complex 1, MeCN=acetonitrile, OTf−=triflate). In a typical workup, the complex is crystallized from MeCN/Et2O mixtures in 82% yield. The crystal structure of 1 reveals that the manganese center is heptacoordinate, with six donor atoms from the H2qtp1 ligand and one from the coordinated MeCN (FIG. 1). The overall geometry is best described as a distorted face-capped octahedron, with the quinol O-donor and the three pyridine rings' N-donors defining a pseudo-plane. The heptacoordination and the metal-ligand bond distances are both consistent with a +2 oxidation state for the manganese. This assignment is supported by the lack of charge-transfer bands in the optical spectrum and the 5.6 μB magnetic moment measured for the solid. The bound quinol remains fully protonated, as evidenced by the anion count and the Mn—O and C—O bond lengths. The C—O bond distances are both 1.38 Å, closely matching those found for quinols encapsulated in clathrates. Each hydroxyl group on the hydroquinone is in close proximity to an O atom from a OTf− anion; the O—O distances (2.66 Å for O1, 2.71 Å for O2) are consistent with hydrogen bonding interactions. Selected crystallographic data and bond lengths for 1 are listed in Table 1S and S2.
TABLE S1 Selected crystallographic data for 1 Parameter [Mn(H2qtp1)(MeCN)](OTf)2 Formula C31H31F6MnN6O8S2 MW 848.70 Crystal system Monoclinic Space group P21/n(#14) a (Å) 13.08640(10) b (Å) 19.3897(2) c (Å) 14.42960(10) α (deg) 90 β (deg) 96.1260(10) γ (deg) 90 V (Å3) 3640.48(5) Z 4 Cryst color Colorless T 100 Reflns collected 21924 Unique reflns 5605 R1 (F, I > 2σ(I)) 0.1098 wR2 (F2, all 0.3183 R1 = Σ | | Fo | − | Fc | |/Σ | Fo |; wR2 = [Σw(Fo2 − Fc2)2/Σw(Fo2)2]1/2.
TABLE S2 Selected bond lengths for 1. Bond Length (Å) Mn—N(1) 2.299(5) Mn—N(2) 2.401(5) Mn—N(3) 2.306(5) Mn—N(4) 2.325(5) Mn—N(5) 2.382(5) Mn—N(6) 2.284(5) Mn—O(1) 2.319(5) C(27)—O(1) 1.379(8) C(24)—O(2) 1.363(9)
[0186]Complex 1 is sufficiently stable in aerobic water solutions to allow MRI measurements. The H2qtp1 ligand does not dissociate from Mn(II) to a noticeable degree, as assessed by the lack of 1H NMR resonances in solutions of 1 in D2O.
[0187]The log(K) for the complexation of H2qtp1 to Mn(II) was estimated through a titration with the metal-scavenging agent TPEN (N,N,N′,N′-tetrakis(2-pyridinylmethyl)ethylenediamine, log K=10.3). The ratios of free TPEN to free ligand were assessed by 1H NMR. From these data, equilibrium constants of 0.4 were assigned for the reactions in both water and MeCN:
[Mn(L)(MeCN)]2++TPEN→[Mn(TPEN)]2++L
[0188]Given the known log(K) of 10.3 for TPEN's binding to Mn(II), a log(K) of 10.7 was thereby assigned for the coordination of H2qtp1 to Mn(II). Given the similarity of the values, we can assume that preferential protonation of either the TPEN or H2qtp1 ligand does not occur to an extent large enough to impact the competitive binding of Mn(II). The log(K) of 10.7 is nearly identical to the 10.6 value estimated for a related ligand from our laboratory that contains a para-methylphenol group in place of the H2qtp1's quinol.
[0189]Solutions of 1 in H2O or MeCN are slightly sensitive towards oxygen, with the solutions slowly discoloring from light yellow to purple over 12 h. Over this time, collected UV/vis spectra (FIGS. 2 & 3) display changes in the region between 200 nm and 300 nm which are consistent with the oxidation of the quinol to a para-quinone. Past 24 h, the solution begins to turn brown, consistent with oxidation of the manganese to Mn(III) and/or Mn(IV). For the spectrophotometric analysis, the Fe(ClO4)2 solution was added to a MeCN solution containing 0.10 mM [Mn(Hptp1)(MeCN)]2+; the mixture was scanned at 0 min (dashed red), 30 min (dashed pink), and 60 min (dashed blue). Over this time period, there was negligible displacement of the Mn(II) by Fe(II) as indicated by the data in FIG. 2. At 15 h, approximately 11% of the Mn(II) has been displaced by Fe(II) as indicated by data in FIG. 3.
[0190]The reactivity between 1 and H2O2, conversely, is rapid. In MeCN, the reaction between 1 and excess H2O2 turns purple within a few minutes. FIG. 4 shows UV/Vis spectra spectra depicting the reaction between 0.10 mM 1 and 10 mM H2O2 in H2O. The reaction was scanned immediately after the addition of H2O2, then 12, 30, and 60 min thereafter. The 292 nm feature in the non-oxidized material is typical of a quinol functional group.
[0191]The corresponding mass spectrum shows new m/z peaks at 454.22 and 657.10, which correspond to the oxidized form of the ligand (qtp1) and its manganese complex with a triflate anion respectively. The IR spectrum of the solid isolated from the reaction (FIG. 5) has an intense new absorption at 1658 cm−1, the energy of which is consistent with a carbonyl stretch for a non-metal-coordinated p-quinone. The reactivity is faster in methanol and water, with the spectroscopic changes occurring in seconds, rather than minutes. For IR analysis, after allowing reaction between 1.0 mM 1 and 4.0 mM H2O2 in MeOH for one hour, the solvents were stripped, yielding the solid used to prepare the sample (KBr). The peak at 1659 cm−1 is assigned to a C═O stretch for the quinone formed upon oxidation. For comparison, IR spectrum of 1 is shown in FIG. 6. The 3384 and 3472 cm−1 features are assigned to the O—H stretches of the H2qtp1 quinol. The 1607 cm−1 feature is assigned to the C—N stretches for the coordinated pyridine rings.
[0192]EPR and UV/vis spectroscopy demonstrate that the oxidation state of manganese does not change after adding H2O2. The EPR spectra of 1 (FIG. 7) and its oxidized product (FIG. 8) are highly similar, with features consistent with high-spin Mn(II). The EPR signal intensity of the Mn(II) in the oxidized product is actually slightly greater than that of an identical concentration of 1. Upon oxidation, no distinct features are observed in the 350-500 nm region where Mn(III)-related LMCT bands are normally observed. The lack of ligand resonance peaks in the NMR of the oxidized material in D2O suggests that the oxidized ligand remains bound to the Mn(II) after the reaction.
[0193]Analysis of the oxidized product by 1H NMR (FIG. 9) indicates that the ligand does not oxidize to completion, even with excess H2O2. The oxidized ligand remains bound to the manganese, as indicated by the absence of diamagnetic peaks. For NMR analysis, after 30 minutes reaction between 10 mM 1 and 4.0 equiv of H2O2 in MeCN-d3, 20 mM of Zn(ClO4)2 was added and the reaction was given 2 hours to equilibrate before 1H NMR analysis. The addition of Zn(ClO4)2 to solutions of 1 and its oxidized product leads to rapid metal ion exchange, allowing the visualization of diamagnetic Zn(II)-H2qpt1 (FIG. 10) and Zn(II)-qtp1 adducts. Using HQ-COSY spectroscopy (FIG. 11), we were able to assign two singlet peaks at 6.56 and 7.09 ppm to the hydroxyl protons of H2qtp1 because of the absence of coupling between them. Upon oxidation, these peaks decrease in intensity by approximately 45% but do not vanish completely, as would be anticipated from the complete oxidation of the ligand in the sample. As shown in FIG. 8, the integrated intensities of the quinol peaks at 6.97 and 6.47 ppm are 0.54 and 0.57, suggesting ˜55% oxidation of the H2qtp1 ligand. The decrease in these features is invariant and seemingly not correlated to the amount of H2O2 added past a stoichiometric amount. Consequently, we currently believe that the oxidation is reversible and that the mixture of qtp1 and H2qtp1 corresponds to an equilibrium position.
[0194]For the relaxivity measurements, all samples were run in 298 K aqueous solutions containing 50 mM HEPES buffered to pH 7.00, using a 3 T field provided by a clinical MRI scanner. The data were fit to the indicated linear equations; the y-intercepts were within error of 1/T1 measurements associated with two control samples that contained no Mn(II): (A) 10 mM H2O2 in 50 mM HEPES buffer and (B) pure 50 mM HEPES buffer (both 0.46 s−1). A second series of experiments using a different batch of 1 provided r1 values of 4.73 mM−1 s−1 and 5.30 mM−1 s−1 for the reduced and oxidized forms of the sensor; these are identical within error to those found for the above experiment. FIG. 12 shows the plots of (1/T1) versus Mn(II) concentration for 1 in the presence and absence of 10 mM H2O2.
[0195]The relaxivity of complex 1 in an aqueous solution of 50 mM HEPES buffered to pH 7.00 was found to be 4.73 mM−1 s−1 (3 T field, 25° C.). This r1 value is higher than both the 4.39 mM−1 s−1 value for the Mn(II) complex with the related Hptp1 ligand (Hptp1=N-(2-hydroxy-5-methylbenzyl)-N,N′,N′-tris(2-pyridinylmethyl)-1,2-ethanediamine) and the 1.73 mM−1 s−1 value for [Mn(EDTA)(H2O)]2− measured under identical conditions. The enhanced relaxivity of 1 relative to [Mn(Hptp1)(MeCN)](ClO4)2 (2) may be due to additional interactions with outer-sphere water molecules made possible by the presence of the second hydroxyl group on the quinol.
[0196]Upon the addition of 10 mM H2O2, the relaxivity per manganese increases from 4.73 mM−1 s−1 to 5.30 mM−1 s−1. Although the change is modest, this represents the first instance of a turn-on response by a mononuclear MRI contrast agent to H2O2. We attribute the increase of the relaxivity to the oxidation of the hydroquinone moiety to more weakly coordinating p-benzoquinone. In aqueous solution, water molecules should more readily displace the quinone portion of the ligand, resulting in a transiently greater aquation number, which in turn would increase the r1.7 This is difficult to ascertain experimentally, given that the sensor is only partially oxidized. The incomplete oxidation also explains the modest r1 response.
[0197]That the same amount of ligand oxidation is observed, even with exceedingly high concentrations of H2O2, may suggest that the Mn(II)-qtp1 adduct formed upon oxidation may react with a second equiv. of ROS to return to the reduced state, analogous to a superoxide dismutase (SOD) or catalase enzyme. Evidence does suggest that 1 can catalytically degrade ROSs and behave as an anti-oxidant (vida infra). Complex 1 can be fully oxidized by 2,3-dichloro-5,6-dicyano-1,4-benzoquinone (DDQ). The addition of 1 equiv. of DDQ to a solution of 1 is sufficient to completely oxidize the quinol portion of H2qtp1 to the quinone, as assessed by 1H NMR. In the absence of Zn(II), the product is NMR-silent, suggesting that the oxidized ligand remains bound to the Mn(II). The r1 value for the fully oxidized sensor is 5.56 mM−1 s−1. The addition of 2 mM KO2 to 1 likewise triggers a stronger response (r1=5.52 mM−1 s−1). The chemical change responsible for the MRI response, however, is not identical to those in the H2O2 and DDQ experiments, as confirmed by UV/vis and MS analysis of the reaction. The addition of 10 mM NaClO to solutions of 1, conversely, does not trigger any changes in the spectroscopic features, and the r1 value (4.82 mM−1 s−1) remains essentially equal to that of non-oxidized 1. The relaxivity results suggest that an excess of H2O2 oxidizes ˜70% of the sensor.
[0198]There is limited evidence that the oxidation of the sensor can be reversed by reductants. The addition of sodium dithionite to a H2O2-oxidized solution of 1 in MeOH changes the color from purple to light yellow; the UV/vis spectrum, however, has a much more intense band around 300 nm, which suggests the formation of a different coordination compound. Further analysis suggests that the ligand's oxidation has been reversed. The IR spectrum of the product (FIG. 13) lacks the 1658 cm−1 feature indicative of the quinone, and the organic isolated from the reaction mixture appears to be entirely H2qtp1 on the basis of its 1H NMR spectrum. For this IR analysis, the sample was prepared by first reacting 10 mM 1 with 40 mM H2O2 for 1 h in MeOH then 40 mM of sodium dithionite for 30 min in MeOH. The solvent was stripped to yield the solid product for the KBr pellet
[0199]FIG. 14 shows plots of (1/T1) versus Mn(II) concentration for 1 in the presence of various oxidants. All samples were run in 298 K aqueous solutions containing 50 mM HEPES buffered to pH 7.00, using a 3 T field provided by a clinical MRI scanner. The data were fit to the indicated linear equations; the y-intercepts were within error of 1/T1 measurements associated with two control samples that contained no Mn(II): (A) 10 mM H2O2 in 50 mM HEPES buffer and (B) pure 50 mM HEPES buffer (both 0.46 s−1). The oxidation of 1 by 2,3-dichloro-5,6-dicyano-1,4-benzoquinone (DDQ) occurred in CH2Cl2. After the reaction occurred, the 2,3-dichloro-5,6-dicyanoquinol product was removed via filtration, the CH2Cl2 was removed, and the sample was dissolve in HEPES buffer for MRI analysis. The other oxidation reactions occurred entirely in HEPES buffer. The addition of KO2 and DDQ resulted in enhanced relaxivity; the addition of NaClO, conversely, did not trigger a MRI response.
[0200]The superoxide scavenging effects of 1 and 2 are shown in FIG. 15. Superoxide was generated using a hypoxanthine-xanthine oxidase reaction and detected using the chemiluminescent probe lucigenin. Reactions were carried out in 50 mM Tris-HCl (pH 8.0) containing either 1, 2, or Cu/Zn SOD from bovine erythrocytes (insert). Data for the various concentrations of 1, 2, and SOD are expressed as a percentage of luminescence in the presence of vehicle.
[0201]The anti-oxidant properties of 1 and 2 were also assessed using the DPPH assay (DPPH=2,2-diphenyl-1-picrylhydrazyl radical hydrate), which evaluates the ability of a compound to donate hydrogen atoms to DPPH to yield the corresponding hydrazine. The anti-oxidants were added to DPPH and incubated in the dark for 30 min at room temperature. Spectroscopic measurements were performed at 517 nm. The data were normalized to the absorbance in the presence of vehicle. All experiments were performed in triplicate and repeated twice. Although 1 and 2 are similar with respect to their abilities to intercept O2− prior to its reaction with lucigenin, the DPPH assay suggests that 1 is the superior anti-oxidant (FIG. 16). The IC50 value for 1 was found to be 6.6 M; by this measure, it bests the well-known anti-oxidant ascorbic acid (IC50=22.3 μM). The Hptp1 complex, conversely, fails to reduce DPPH to a noticeable degree.
[0202]One concern that has limited the application of redox-active metals in biological imaging is that they can elevate ROS concentrations. The results here demonstrate that the opposite can be true and that there exists the potential to simultaneously image and mitigate the oxidative stress caused by aberrantly high concentrations of ROSs. The cytotoxicities of 1 and 2 have been assessed with H9c2 cells. The cells can tolerate 10 M doses of both compounds for 4 h and a 1.0 M dose of 1 for 24 h. Higher dosages and/or longer incubation times do trigger noticeable cell death.
Example
Example 2
The Synthesis and Characterization of a Mononuclear Mn(II) Complex with the Redox-Active Ligand N,N′-bis(2-pyridinylmethyl)-1, 2-ethanediamine (H4qtp2)
[0203]
[0204]The H4qtp2 ligand as shown in Scheme 3 can be synthesized from the readily available N,N′-bis(2-pyridinylmethyl)-1,2-ethanediamine (bispicen) in three steps. The synthesis of H4qtp2 is more challenging than that of the closely related H2qtp1 in that the installation of the second quinol requires the addition of the reagents in two portions and a 40 h reaction time. The product is also hygroscopic and degrades under basic conditions (pH >10). An alternate route in which the two quinol groups were added to 1,2-ethanediamine before the picolyl arms was explored, but it presented drawbacks similar to those for the route proceeding through bispicen in that adding the fourth arm of the ligand required forcing conditions. Further, the quinols needed to be protected before the installation of the picolyl subunits; this and the subsequent deprotection add two synthetic steps. Although H4qtp2 was successfully prepared through this route, the alternative synthesis requires much more time and effort while yielding less of the product.
N-(2,5-Dihydroxybenzyl)-N,N′-bis(2-pyridinylmethyl)-1,2-ethanediamine
[0205]2,5-Dihydroxybenzaldehyde (552 mg, 4.00 mmol) and bispicen (1.03 g, 4.25 mmol) were dissolved in 20 mL of ether. The resultant mixture was stirred for 4 h, during which time a solid deposited. The precipitate was collected and washed with a mixture of MeOH/ether (1:9). The isolated and washed aminal (900 mg, 2.48 mmol) was dried and redissolved in 30 mL of MeOH. Trifluoroacetic acid (750 mg, 6.58 mmol) was added to the MeOH solution at 0° C., followed by sodium cyanoborohydride (220 mg, 3.50 mmol). The mixture was stirred at RT for 24 h, at which point the solvent was removed to yield the crude product. The crude was purified by repeated precipitation from MeOH/ether to yield the product as a white solid (568 mg, 63% yield). Typical yields range from 60-70%. 1H NMR (400 MHz, CD3OD, 293 K): δ 8.54 (d, J=4.5 Hz, 1H), 8.44 (d, J=4.5 Hz, 1H), 7.80 (m, 2H), 7.38 (m, 4H), 6.58 (m, 3H), 4.25 (s, 2H), 3.92 (s, 2H), 3.71 (s, 2H), 3.31 (m, 4H). 13C NMR (100 MHz, CD3OD, 293 K): δ 158.42, 151.51, 149.87, 149.22, 148.70, 148.29, 137.48, 137.32, 124.04, 123.55, 122.48, 117.43, 115.94, 115.09, 57.76, 54.23, 49.58, 49.27, 44.64. MS (ESI): Calcd for MH+, 365.1978. Found, 365.2156.
N,N′-Bis(2,5-dihydroxybenzyl)-N,N′-bis(2-pyridinylmethyl)-1,2-ethanediamine (H4qtp2)
[0206]N-(2,5-Dihydroxybenzyl)-N, N′-bis(2-pyridinylmethyl)-1,2-ethanediamine (939 mg, 2.57 mmol) and 2,5-dihydroxybenzaldehyde (354 mg, 2.57 mmol) were combined in 60 mL of MeOH. The mixture was cooled to 0° C. with an ice bath. Subsequently, acetic acid (308 mg, 5.14 mmol) was added to the solution, which then stirred for 30 min. After this period, sodium cyanoborohydride (161 mg, 2.57 mmol) was added, and the resultant solution was stirred for an additional 24 h. Second portions of 2,5-dihydroxybenzaldehyde (354 mg, 2.57 mmol), acetic acid (308 mg, 5.14 mmol), and sodium cyanoborohydride (161 mg, 2.57 mmol) were added and allowed react for another 16 h. The solvent was removed under reduced pressure, and the residue was purified by silica gel chromatography (15:1 EtOAc/MeOH eluent, product Rf=0.3) to yield the ligand as a white powder (800 mg, 64% yield). Typical yields range from 45-65%. 1H NMR (400 MHz, CD3OD, 293 K): δ 8.46 (qd, J=5.2 Hz, 1.6 Hz, 0.8 Hz, 2H), 7.75 (dt, J=9.6 Hz, 2.0 Hz, 2H), 7.31 (m, 4H), 6.58 (d, J=1.6 Hz, 4H), 6.55 (m, 2H), 3.81 (s, 4H), 3.68 (s, 4H), 2.87 (s, 4H). 13C NMR (100 MHz, CD3CN, 293 K): δ 150.08, 149.36, 148.97, 137.07, 123.56, 122.59, 117.14, 116.47, 115.47, 58.27, 56.15, 49.82. MS (ESI): Calcd for MH+, 487.2346. Found, 487.2277.
cis-Dibromo(N,N′-bis(2,5-dihydroxybenzyl)-N,N′-bis(2-pyridinylmethyl)-1,2-ethanediamine)manganese(II) ([Mn(H4qtp2)Br2], 3)
[0207]The H4qtp2 ligand (500 mg, 1.03 mmol) and MnBr2 (221 mg, 1.03 mmol) were dissolved in 5 mL of MeCN in a dry and anaerobic glovebox. The solution was allowed to stir at 60° C. for 16 h; over this time, a white precipitate deposited. The solution was filtered, and the filtrate was washed with MeCN to yield the product as a white powder (550 mg, 71% yield). Typical yields range from 70-85%. Crystals suitable for single crystal X-ray diffraction were grown by slow evaporation from a saturated solution of the crude in MeOH. MS (ESI): Calcd for [Mn(L-H)]+, 540.1569. Found, 540.1564. Solid-state magnetic susceptibility (294 K): μeff=5.6 μB. Optical spectroscopy (MeOH): 302 nm (5420 M−1 cm−1). IR (KBr, cm−1): 3405 (s), 1604 (m), 1511 (s), 1446 (s), 1358 (w), 1341 (w), 1310 (w), 1210 (m), 1191 (s), 1156 (w), 1066 (w), 1049 (w), 1016 (w), 948 (w), 934 (w), 810 (m), 754 (m). Elemental Analysis (powder): Calcd for C29H34N4MnO4Br2*CH3CN: C, 48.54%; H, 4.48%; N, 9.43%. Found: C, 48.43%; H, 4.58%; N, 9.72%.
cis-Dibromo(N,N′-bis(2,5-benzoquinone)-N,N′-bis(2-pyridinylmethyl)-1,2-ethanediamine)manganese(II) ([Mn(qtp2)Br2], 4)
[0208]Complex 3 (60 mg, 0.080 mmol) was dissolved in 1 mL of CH2Cl2 under N2. 2,3-Dichloro-5,6-dicyano-p-benzoquinone (DDQ, 37 mg, 0.16 mmol) was dissolved in 5 mL of CH2Cl2. The resultant solution was added to 3 dropwise. The mixture was allowed to stir overnight, at which point it was filtered through celite. Slow evaporation of the solvent from the filtrate deposited red crystals that were suitable for X-ray diffraction. These were collected and washed with cold CH2Cl2 to yield 9.8 mg of product (16%). Typical yields range from 10-15%. Optical spectroscopy (MeOH): 249 nm (4140 M−1 cm−1). IR (KBr, cm−1): 3434 (s), 3234 (w), 2963 (m), 2925 (w), 2855 (w), 1657 (C═O, s), 1602 (m), 1443 (m), 1262 (m), 1102 (m), 1050 (m), 1015 (m), 810 (m). Elemental Analysis: Calcd for C28H26N4MnO4Br2.0.5H2O: C, 47.62%; H, 3.85%; N, 7.93%. Found: C, 47.70%; H, 3.97%; N, 7.84%.
[0209]The H4qtp2 ligand appears to bind to Mn(II) readily, but we were unable to obtain a crystalline product from reactions between H4qtp2 and either Mn(OTf)2 or Mn(ClO4)2.
[0210]Consequently, MnBr2 was selected as the salt for the H4qtp2 complex for two reasons. First, the solubility of this salt in MeCN facilitated the product's isolation and purification. Second, bromide does not bind avidly to Mn(II),8 and we anticipated that this anion would be readily displaced by O-donors, such as quinols, quinolates, and water molecules, upon solvation. The complex [Mn(H4qtp2)Br2] (3) was prepared in moderately high yield by mixing the ligand with MnBr2 in 60° C. MeCN. Upon standing, complex 3 precipitates from the reaction mixture.
[0211]The Mn(II) complex with the fully oxidized ligand (qtp2) was prepared by oxidizing 3 with 2,3-dichloro-5,6-dicyano-p-benzoquinone (DDQ) in CH2Cl2. DDQ was previously noted for its ability to cleanly and fully oxidize the quinol subunit in the related 1. Crystals of [Mn(qtp2)Br2] (4) can be obtained after approximately 20 h, albeit in relatively low yield. Regrettably, the solubility of crystalline 4 is poor in pure H2O; this and the poor yield (˜15%) limit our ability to both characterize the complex and use it as a standard for reactions involving 4 and H2O2.
Structural Characterization
[0212]Needle-shaped crystals of 3 were grown from saturated solutions of the complex in MeOH via slow evaporation of the solvent (Table 3). The Mn(II) center is six-coordinate, with the two bromides bound in a cis fashion and the four nitrogen donors provided by the H4qtp2 ligand binding in a cis-α conformation which places the two pyridine groups trans to each other (FIG. 17). In FIG. 17, all hydrogen atoms and solvent molecules are omitted for clarity. All thermal ellipsoids are drawn at 50% probability. Neither quinol binds directly to the Mn(II) in the crystal. The Mn—N and Mn—Br bond distances measured for 3 are typical for a hexacoordinate high-spin Mn(II) complex (Table 4). The oxidation number and spin-state assignments derived from the metrical parameters are corroborated by solid-state magnetic susceptibility measurements (μeff=5.6 μB). The Mn—N bonds to the pyridine rings are shorter than those to the tertiary amines; both pairs of bond distances are similar to those measured for other MnN4X2 cores with amine and pyridine N-donors. The C—O bond distances average 1.37 Å, indicating that the quinols remain both fully reduced and fully protonated.
TABLE 3 Selected crystallographic data for 3 and 4 Parameter [Mn(H4qtp2)Br2] [Mn(qtp2)Br2] (4) Formula C30H33Br2MnN5O5 C28H26Br2MnN4O8 MW 758.35 761.27 Crystal system Monoclinic Cubic Space group P21/n Ia3d a (Å) 9.6411(2) 34.991(2) b (Å) 21.9027(6) 34.991(2) c (Å) 15.3507(4) 34.991(2) α (deg) 90 90 β (deg) 99.881(1) 90 γ (deg) 90 90 V (Å3) 3193.46(14) 42842(9) Z 4 48 Cryst color Light orange Light red T 180 180 Reflns collected 31999 38465 Unique reflns 3031 1350 R1 (F, I > 2σ(I)) 0.0566 0.0578 wR2 (F2, all 0.1104 0.2042 R1 = Σ | | Fo | − | Fc | |/Σ | Fo |; wR2 = [Σw(Fo2 − Fc2)2/Σw(Fo2)2]1/2.
TABLE 4 Selected bond lengths (Å) for complexes 3 and 4 Complex 2 3 Mn—N(1) 2.241(5) 2.252(8) Mn—N(2) 2.338(6) 2.395(8) Mn—N(3) 2.346(6) 2.395(8) Mn—N(4) 2.272(5) 2.252(8) Mn—Br(1) 2.6244(14 2.5971(19) Mn—Br(2) 2.6134(15 2.5971(19) O(1)—C(13) 1.363(8) 1.226(15) O(2)—C(10) 1.383(10) 1.242(16) O(3)—C(22) 1.395(11) 1.242(16) O(4)—C(19) 1.334(10) 1.226(15) N(1) and N(4) correspond to pyridine nitrogens; N(2) and N(3) correspond to amine nitrogens. The atoms in 4 have been relabeled in order to facilitate comparison to those in the structure of 3.
[0213]The product of DDQ oxidation, 4, was also crystallized and structurally characterized (FIG. 18). In FIG. 18, all hydrogen atoms and solvent molecules are omitted for clarity and all thermal ellipsoids are drawn at 50% probability. The atoms have been relabeled from those in the CIF file in order to facilitate comparison to the structure of 3. The metal center remains hexacoordinate and retains the same N4Br2 coordination sphere upon oxidation. The C—O bonds shorten to 1.23 Å (Table 4), confirming the oxidation of both quinols to para-quinones. Upon oxidation, the bonds between the Mn(II) and the amine N atoms lengthen slightly while those between the Mn(II) and the Br atoms slightly contract. Although the crystals are colored, the oxidation state of the manganese remains +2, as best structurally evidenced by the Mn—N and Mn—Br bond distances. None of the bonds are significantly elongated or shortened relative to their counterparts in 3. The absence of Jahn-Teller distortions further supports the assignment of the +2 oxidation state for the manganese atom.
Spectroscopic and Solution Characterization
[0214]The oxidation state of H4qtp2 can be readily monitored by UV/vis and infrared (IR) spectroscopy. The reaction was scanned at 0, 1, 2, 3, and 12 h. The band at 302 nm is characteristic of quinol functional groups. In MeOH, complex 3 displays a moderately intense UV/vis absorbance band at 302 nm under air (FIG. 19). This feature can be assigned to an electronic excitation within the quinols. As expected, the oxidized product 4 lacks this UV/vis band. The C═O stretches associated with the para-quinones are anticipated to appear between 1600 and 1800 cm−1. The IR spectrum of 3 has a band at 1605 cm−1, which has a frequency and intensity typical of a C—N stretch for a pyridine bound to a divalent metal, but otherwise lacks features in this range (FIG. 20). The 3405 cm−1 feature is assigned to the O—H stretches associated with the quinol groups of the H4qtp2 ligand. The 1605 cm−1 feature is assigned to the C—N stretches associated with the metal-coordinated pyridine rings. The IR spectrum of 4, conversely, has a strong band at 1657 cm−1, consistent with the presence of quinone C═O bonds (FIG. 21).
[0215]Complex 3 was studied by cyclic voltammetry (CV) in water containing 50 mM phosphate to buffer the solution to pH 7.2. A redox feature with E1/2 of 60 mV vs. Ag/AgCl (295 mV vs. NHE) is observed (FIG. 22).
[0216]Similar redox processes were found for both 1 and a Zn(II)-H2qtp1 complex, leading us to assign the 60 mV redox event to the oxidation of the ligand, rather than the manganese. The separation between the anodic and cathodic peaks (ΔE) for this feature is 230 mV; this is much less reversible than its analog in the CV of 1 (75 mV). A second and entirely irreversible redox event at 725 mV (960 mV vs NHE) is tentatively assigned to the oxidation of Mn(II) to Mn(III). For this analysis, the scan rate was 100 mV/s. For the quasi-reversible feature: E1/2=57 mV vs. Ag/AgCl, ΔE=232 mV. An irreversible feature with Epc=725 mV is also observed.
Potentiometric pH Titrations
[0217]Small molecule sensors are notoriously sensitive to changes in their molecular structure; seemingly minor changes can either disrupt the desired response or introduce side reactivity that precludes their use. When complex 3 is dissolved in D2O, 1H NMR spectroscopy detects no resonances aside from that corresponding to the solvent. The 1H NMR data are therefore inconsistent with the presence of either the free H4qtp2 ligand or potential decomposition products. The speciation in water was more rigorously probed with potentiometric pH titrations. Analysis of the H4qtp2 ligand in 100 mM KCl solution found two distinct ionization events between pH 2.5 and 9.0. The instability of the ligand under more basic conditions precluded us from obtaining reliable data above pH 9.0, but we were able to find the same two ionization events by titrating basic solutions of H4qtp2 with HCl. Analysis of the equivalence points suggested pKa values of 4.47 and 7.18 which were subsequently confirmed with a Hyperquad model. The 4.47 and 7.18 values likely correspond to the protonation/deprotonation of a pyridine ring and one of the tertiary amines, respectively (Scheme 4); similar values have been found for analogous protonation events for pyridylamine ligands. The quinolic protons likely deprotonate at higher pH values (pKa ˜10), but we were unable to obtain the high pH data necessary to confirm this.
[0218]Complex 3 displays a pH response that is distinct from that of H4qtp2. Upon titration of an acidic solution of 3 with KOH, we observed that the solution began to become cloudy at approximately pH 8.0, which again limited our ability to obtain reliable high pH data. This also prevented us from titrating basic solutions of 3 with HCl, but we were able to reproduce the events observed in the KOH titration three times. The data were fit to a model containing the protonated forms of the free ligand and four Mn(II) complexes with the ligand in various protonation states: [Mn(H2qtp2)], [Mn(H3qtp2)]+, [Mn(H4qtp2)]2+, and [Mn(H4qtp2)]3+ (Scheme 4). The Mn(II) ions in these species could potentially be coordinated to water molecules, but we were unable to obtain complementary data to either support or refute this. Based on the heptacoordination observed for the related 1 and 2, we speculate that q=1 at pH 7.0. Table 5 lists the calculated log(3) values for each species in the model; Table 6 provides the pKa values that can be derived thereof. The pKa values at 7.14 and 5.82 have been assigned to the protonation of metal-bound quinolates. Although the free ligand displays an ionization event with pKa of 7.18, the data for 3 are inconsistent with a single ionization event. Since the 7.14 and 5.82 values are substantially below the pKa values associated with free quinols, we propose that the relevant Mn(II) species around pH 7 are bound to O-donors from the quinol/quinolate ligands. Water molecules bound to divalent metals typically have pKa values close to 10. Phenols coordinated to divalent metals, conversely, have pKa values in the 6-8 range unless they have been derivatized with an electron-withdrawing substituent.
TABLE 5 Parameters for the Hyperquad model. Species Mn2+ H4qtp2 H+ log(β) Derived Values H4qtp2 0 1 0 0.00 H5qtp2+ 0 1 1 7.18 (±0.03) pKL2 = 7.18 (±0.03)a H6qtp22+ 0 1 2 11.65 (±0.05) pKL1 = 4.47 (±0.08)a [Mn(H2qtp2)] 1 1 −2 −7.19 (±0.01) [Mn(H3qtp2)]+ 1 1 −1 −0.05 (±0.01) pKa(Mn(H3qtp2)+) = 7.14 (±0.02)b [Mn(H4qtp2)]2+ 1 1 0 5.77 (±0.01) pKa(Mn(H4qtp2)2+) = 5.82 (±0.02)c [Mn(H5qtp2)]3+ 1 1 1 11.30 (±0.01) pKa(Mn(H5qtp2)3+) = 5.53 (±0.02)d Refer to Scheme 4 for the proposed molecular structures for each ligand and Mn(II) complex. Due to the instability of the ligand at high pH values, we were unable to obtain log(β) values for the H3qtp2− and H2qtp22− species. aLigand pKa values corresponding to the (de)protonation of the free ligand amine and pyridine groups. KL1 = [H5qtp2+][H+]/[H6qtp22+], pKL1 = logβ011 − logβ010. KL2 = [H4qtp2][H+]/[H5qtp2+], pKL2 = logβ012 − logβ011. bKa(Mn(H3qtp2)+) = [Mn(H2qtp2)][H+]/[Mn(H3qtp2)+], corresponds to the (de)protonation of the second quinol. pKa(Mn(H3qtp2)+) = logβ11-1 − logβ11-2. cKa(Mn(H4qtp2)2+) = [Mn(H3qtp2)+][H+]/[Mn(H4qtp2)2+], corresponds to the (de)protonation of a quinol group. pKa(Mn(H4qtp2)2+) = logβ110 − logβ11-1. dKa(Mn(H5qtp2)3+) = [Mn(H4qtp2)2+][H+]/[Mn(H5qtp2)3+], corresponds to the (de)protonation of a pyridine group. pKa(Mn(H5qtp2)3+) = logβ111 − logβ110.
[0219]The protonation state assignments for the quinols are supported by UV/vis data collected for free H4qtp2 and 3 in aqueous solutions. All spectra were obtained at 298 K under air using a 1.0 cm pathlength cuvette. A) UV/vis spectra of 0.10 mM solutions of H4qtp2 and 3 in aqueous solutions containing 50 mM HEPES buffered to pH 7.00. B) UV/vis spectra of a 0.05 mM solution of 3 in water adjusted to various pH values between 7.700 and 4.470 through the addition of either KOH or HCl. In 50 mM HEPES solutions buffered to pH 7.00, H4qtp2 displays absorbance peaks at 260 nm and 294 nm; conversely, complex 3 has maxima at 300 nm and 362 nm (FIG. 23A). The free ligand, but not 3, is anticipated to contain fully protonated quinols at this pH. At pH 7.700, complex 3 has a sharp band at 311 nm (FIG. 23B). Upon titrating this solution with HCl, this band gradually shifts to 295 nm, the energy of which is consistent with the presence of quinols rather than quinolates. No substantial changes to the 295 nm feature occur below pH 5.983; at this point the metal-bound quinols are anticipated to be approximately 75% protonated. Similar pH-dependent spectrophotometric changes were recently found for a Mn(II) complex with a phenol-containing ligand.
[0220]The [Mn(H5qtp2)]3+ species observed under acidic conditions likely contains a proton localized on one of the amines; the 5.53 pKa value is high for a pyridine. The protonation of one of the secondary amines would be anticipated to greatly destabilize the Mn(II) complex. We had hoped to obtain a Keq for the [Mn(H2qtp2)] complex, but the instability of the ligand under basic conditions precluded us from measuring the log(3) for H2qtp22− that is required for this calculation.
[0221]FIG. 24 shows the percent formation of each Mn(II) species as a function of pH.
[0222]Analysis of the modeled data yields a pMn of 5.36 at pH 7.4. A nearly identical pMn value was recently found for our Hptp1 system, which features a ligand with a para-methylphenol, rather than a quinol, moiety. At pH 7.4, the most prevalent species are [Mn(H2qtp2)] (66.2%) and [Mn(H3qtp2)]+ (32.5%), which feature one and two quinolate O-donors respectively. Over 99% of the manganese is bound by some form of the H4qtp2 ligand. At pH 7.0, [Mn(H3qtp2)]+ becomes the major species (54.6%), although there is still a substantial amount of [Mn(H2qtp2)] (40.3%). The percentage of free Mn(II) increases to 1.4%. As the pH drops below 7.0, the N-donors on the ligand become protonated with concomitant release of Mn(II).
TABLE 6 pMn value and pKa Values for the Ligands and Mn(II) Complex Determined by Potentiometric Titration at 25° C. pKL1a 4.47 (±0.08) pKL2a 7.18 (±0.03) pKa(Mn(H5qtp2)3+)b 5.53 (±0.02) pKa(Mn(H4qtp2)2+)c 5.82 (±0.02) pKa(Mn(H3qtp2)+)d 7.14 (±0.02) pMn(pH 7.4)e 5.36 (±0.02) Refer to Scheme 3 for proposed molecular structures. aLigand pKa values corresponding to the (de)protonation of the free ligand amine and pyridine groups. KL1 = [H5qtp2+][H+]/[H6qtp22+], KL2 = [H4qtp2][H+]/[H5qtp2+]. bKa(Mn(H5qtp2)3+) = [Mn(H4qtp2)2+][H+]/[Mn(H5qtp2)3+], corresponds to the (de)protonation of a pyridine group. cKa(Mn(H4qtp2)2+) = [Mn(H3qtp2)+][H+]/[Mn(H4qtp2)2+], corresponds to the (de)protonation of a quinol group. dKa(Mn(H3qtp2)+) = [Mn(H2qtp2)][H+]/[Mn(H3qtp2)+], corresponds to the (de)protonation of the second quinol. epMn = −log[Mn(II)]free calculated for [3] = 1.0 mM, 298K, pH 7.4.
Stability of [Mn(H4qtp2)Br2] to Air and Adventitious Metal Ions The stability of 3 to air and adventitious metal ions was assessed primarily by UV/vis spectroscopy. Upon solvation in aerated MeOH, the 302 nm feature corresponding to the quinol groups decreases in intensity by about 10% over 12 h, demonstrating that 3 is sufficiently air stable for most MRI studies (Figure S1), with less than a 5% error introduced over 4 h. Complex 3, however, is susceptible to metal exchange. When equimolar amounts of 3 and Fe(ClO4)2 are mixed in MeCN, 80% of the Mn(II) is replaced by Fe(II) by 3 h. Experiments monitored by NMR suggest that Zn(II) can also readily displace the Mn(II) from 3 (vide infra).
Reactivity with H2O2
[0223]Although complex 3 is reasonably stable to air and moisture, it reacts with H2O2 in a variety of solvents to yield a mixture of Mn(II) species in which either zero, one, or two of the quinol groups have been oxidized to para-quinones.
[0224]EPR spectroscopy confirms that the manganese remains in the +2 oxidation state.
[0225]The reaction between 3 and H2O2 proceeded for 30 min before the sample was frozen and analyzed. The data were acquired at 77 K. For both spectra: geff=2.00, A=103 Gauss. The EPR spectrum of a 1.0 mM solution of 3 in MeOH is highly similar to that corresponding to a 1.0 mM sample of 3 that was allowed to react with 10 mM of H2O2 for 30 min (FIG. 25). Both EPR spectra show a major feature at g=2.00 that is split six-fold by the I=5/2 manganese nucleus. A minor feature at 1000 gauss is present in both samples as well. For the non-oxidized sample, this feature likewise exhibits hyperfine splitting; the oxidized sample, conversely, lacks this detail. The two spectra overlap almost perfectly, suggesting that they have nearly equal concentrations of Mn(II).
[0226]UV/vis spectroscopy verifies that the reaction between 3 and H2O2 in MeOH oxidizes the quinols, as evidenced by the loss of the 302 nm band over 1 h (FIG. 26A). The reaction was tracked for 2 h. FIG. 26B shows the change in the absorbance at 300 nm over this time. The absorbance initially increases slightly due to the unreacted H2O2. The changes in the spectra are consistent with an induction period, in that little change occurs until approximately 10 min after the reagents are mixed. The loss of the 302 nm band can also be triggered by the addition of DDQ. Excesses of O2− or ClO− result in the decomposition of the ligand and do not appear to cleanly generate species with either one or two para-quinones.
[0227]The IR of the solid isolated from reactions between 3 and 4 equiv. H2O2 in MeOH after 1 h reveals an intense band at 1659 cm−1, which is typical of the carbonyl stretch associated with a non-metal-coordinated para-quinone (FIG. 27). For this analysis, after allowing 30 min to react, the solvents were stripped, yielding the solid used to prepare the sample (KBr). The peak at 1659 cm−1 is assigned to a C═O stretch for the quinone groups formed upon the partial oxidation of the H4qtp2 ligand. This compares well to the 1657 cm−1 feature observed for 4. The intensity of the 3405 cm−1 band, which can be at least partly attributed to O—H stretches from the quinol, decreases upon oxidation by H2O2, providing further evidence for the conversion of the quinols to para-quinones.
[0228]Mass spectrometry (MS) of reactions between 3 and H2O2 in either H2O or MeOH detects m/z peaks at 485.20 and 483.19, corresponding to inorganic products with one and two para-quinones. As the amount of H2O2 is increased from 4 to 16 equiv., the reaction appears to proceed more quickly and forms more 4. Despite this, none of the reactions go to completion; the m/z peaks for 3 never fully disappear. Additional m/z peaks are found when the reaction is allowed to proceed for 12 h. These peaks have not been assigned to discrete species and likely result from subsequent oxidation of the ligand and manganese. Treating the H2O2-oxidized 3 with an equimolar amount of dithionite reduces the ligand back to the H4qtp2 state, as assessed by MS. Similar reversibility in the ligand oxidation was observed for 1.
[0229]The changes to the H4qtp2 ligand in 3 can be monitored and analyzed indirectly by 1H NMR. The addition of Zn(ClO4)2 to mixtures of 3 and its oxidized products in CD3CN yields diamagnetic species that can be observed and quantitated by 1H NMR spectroscopy after the reaction was given 2 h to equilibrate. Mixing the Zn(II) salt and the 3 led to a 3:10 mixture of complexes (FIG. 28). The peaks observed between 7.0 and 8.8 ppm can be assigned to the protons on the pyridine subunits. The peaks around 6.5 ppm can be attributed to the O—H and C—H protons on the quinol subunits. These may either be conformers, solvent isomers, ionization isomers, or a combination thereof. The 1H NMR resonances corresponding to the quinolic C—H groups in the free ligand and Zn(II) complex are offset, but these changes aren't large enough to unambiguously confirm the coordination of the quinols to the Zn(II) in MeCN. The resonances corresponding to the quinolic C—H and O—H bonds overlap at 6.5 ppm in CD3CN. The integration of this peak decreases by ˜4 upon oxidation of 3 by DDQ; this is consistent with the oxidation of the two quinols to para-quinones that occurs upon the formation of 3 (FIG. 29). The decreased intensities of the peaks at ˜6.8, relative to those in FIG. 28, correspond to a loss of 4H nuclei upon oxidation.
[0230]When 4 equiv. of H2O2 are added to a CD3CN solution of 3 prior to treatment with Zn(II), only 50% of the quinols oxidize by 1 h, as assessed by the intensity of the feature at 6.5 ppm. Increasing the loading of oxidant to 8 equiv. maximizes the conversion to 70; raising the H2O2 loading to 16 equiv. does not further oxidize the quinols. Without the Zn(II), no ligand-derived resonances are observed, suggesting that the Mn(II) remains bound to the oxidized components in MeCN.
Measurement of Aliquot Group T1 Relaxivity
[0231]The capability of 3 to serve as a MRI contrast agent was assessed with a 3 T clinical MRI scanner. All samples were run in 298 K aqueous solutions containing 50 mM HEPES buffered to pH 7.00, using a 3 T field provided by a clinical MRI scanner. All samples were prepared under air. The oxidized samples were prepared by directly adding H2O2 to solutions of 3 in aqueous solutions buffered to pH 7.0. The oxidation reactions were allowed to proceed for 30 min at 298 K before the T1 measurements were taken. The data were fit to the indicated linear equations; the y-intercepts were within error of 1/T1 measurements associated with two control samples that contained no Mn(II): pure water (0.39 s−1) and 50 mM HEPES buffer (0.38 s−1). A second series of measurements yielded r1 values of 5.64 mM−1 s−1 and 7.32 mM−1 s−1 for 3 before and after reaction with H2O2.
[0232]The relationship between the concentration of 3 in 50 mM HEPES buffer (pH 7.0, 25° C.) and T1 was linear and consistent with the Mn(II) and H4qtp2 remaining bound to each other in solution. The slopes of two separate series of experiments yield a r1 of 5.46 (+0.19) mM−1 s−1. The r1 of 3 increases to 7.17 (+0.15) mM−1 s−1 upon the addition of 10 mM of H2O2 to solutions of the Mn(II) complex in buffered water (FIG. 30). A large excess of H2O2 was added both to activate the sensor to as full an extent as possible and to enable direct comparisons to prior H2O2-sensitive MRI contrast agents reported by our lab. Despite the large excess of H2O2 present, the 1.71 mM−1 s−1 response corresponds to partial oxidation of 3 to species containing H2qtp2 and qtp2. We attempted to measure r1 for the isolated samples of the fully oxidized 4, but the poor solubility of this compound in water precluded these measurements.
Cytotoxicity
[0233]The toxicity of 3 was tested using H9c2 cells in order to facilitate comparison to that of 1. H9c2 cells were obtained from the American Tissue Type Collection (Manassas, Va., USA) and grown at 37° C. with 95% humidity and 5% CO2. Cells were grown in Dulbecco's modified eagles medium (DMEM) supplemented with 10% fetal bovine serum. Experiments were performed at 70-80% confluence. To determine the cytotoxic effects of 3, H9c2 cells were exposed to increasing concentrations of 3 (0.1-1000 M) or its vehicle in DMEM for 4 or 24 hr. Cell number was assessed using the CyQUANT Cell Proliferation Assay Kit (Life Technologies Corporation, Carlsbad, Calif.) per manufacturer's instructions. Cell number was expressed as percentage of the vehicle-treated cells. Values are expressed as mean and standard deviation and represent 2-4 experiments performed in triplicate. The bars marked with an * display a significant difference from the vehicle-treated cell number for corresponding time period (p<0.05).
[0234]H9c2 cells could withstand 1.0 μM concentrations of 1 for at least 24 h. Upon increasing the dose to 10 μM, no cell death was observed at 4 h, but less than 50% survived by 24 h. Complex 3 is significantly less toxic. A 10 μM dose of 3 does not impact the viability of H9c2 cells over 24 h (FIG. 31). The viability of cells exposed to 50 μM of 3 is within error to that of the control at 4 h. Higher concentrations of 3 do trigger cell death, but markedly greater percentages of the cells survive for all analyzed dosages and exposure times than for 1. It should be noted that these cytotoxicities represent upper limits. A human or animal model would be expected to eliminate the probe, and the contact between individual cells and a freely diffusing sensor would not be anticipated to approach 4 h.
Anti-Oxidant Activity
[0235]Previously reported H2O2 sensors from our laboratory were found to behave as potent anti-oxidants. Complex 1 served as an excellent mimic of superoxide dismutase (SOD) and could donate hydrogen atoms more readily than ascorbic acid, as assessed by the 2,2-diphenyl-1-picryl-hydrazyl hydrate (DPPH) assay.
[0236]The ability of 3 to degrade superoxide was tested using a standard technique that uses the reaction between xanthine oxidase and xanthine to generate O2− and a subsequent reaction with the chemiluminescent probe lucigenin to detect it. Reactions were carried out in 50 mM Tris-HCl (pH 8.0). Data for the various concentrations of Mn(II) complex are expressed as a percentage of luminescence in the presence of vehicle. As was found for 1 and 2, complex 3 successfully intercepts O2− before its reaction with lucigenin (FIG. 32). The EC50 value for 3 was found to be 18.2 nM, which is equal within error to that measured for 1.
[0237]Complex 3 is also a competent oxidant as assessed by the DPPH assay (FIG. 33), which tests the abilities of compounds to donate hydrogen atoms to 2,2-diphenyl-1-picrylhydrazyl radical hydrate. In this assay, the anti-oxidants were added to DPPH and incubated in the dark for 30 min at 298 K. Spectroscopic measurements were performed at 517 nm. The data were normalized to the absorbance in the presence of vehicle. All experiments were performed in triplicate and repeated twice. The hydrazine product is monitored by UV/vis. The IC50 for 3 was found to be 2.7 μM; ascorbic acid was found to have an IC50 value of 15 μM under the same conditions.
[0238]Much like H2qtp1, the H4qtp2 ligand binds Mn(II) readily in its neutral form. We were unable to obtain crystalline adducts with either Mn(OTf)2 or Mn(ClO4)2, the former of which was used to prepare [Mn(H2qtp1)MeCN)](OTf)2 (1). The ligand was instead complexed to MnBr2. The resultant [Mn(H4qtp2)Br2] (3) features two Mn—Br bonds but no Mn—O bonds to the quinol subunits. The structure of 1, conversely, contains a Mn—O bond to the quinol group of the ligand. The difference in the structures can be rationalized by the much stronger metal-binding affinity of bromide ions relative to triflates. We do not believe that the structure in FIG. 17 is strictly maintained in aqueous solution since the complex between H4qtp2 and Mn(II) appears to be stable at pH 7.0. The potentiometric pH titration data are consistent with the deprotonation and coordination of the quinol groups above pH 7. The pKa constants for the deprotonation of [Mn(H3qtp2)]+ (7.14) and [Mn(H4qtp2)]2+ (5.82) and the changes to the UV/vis spectra that occur upon lowering the pH (FIG. 3B) are consistent with observations previously made for other M(II)-bound phenols.
[0239]Although replacing a pyridine with a quinol could severely destabilize the Mn(II)-ligand complex in water or render it overly sensitive to O2, we were gratified to find that neither event occurred. Complex 3 is moderately stable in aerobic aqueous solutions above pH 7.0 (FIG. 4). The ligand remains attached to the metal, as assessed by the lack of 1H NMR resonances for solutions of 3 in D2O, the UV/vis data evidence for metal-bound quinols, and the pMn of 5.36 calculated at pH 7.4. The stability can be attributed to the deprotonation of the quinols; the resultant anionic forms of the ligand will have a stronger affinity for Mn(II) than neutral H4qtp2. Noticeable dissociation of the Mn(II) does occur below pH 7.0, and the improved stabilization of Mn(II) complexes with redox-active ligands remains an important goal for this project. Only slight ligand oxidation is observed upon 12 h of exposure to air. Complex 3 is much more susceptible to metal substitution than 1, and a 3 h treatment of a 0.10 mM solution of the Mn(II) complex with 0.10 mM Fe(ClO4)2 is sufficient to remove approximately 80% of the manganese (Figure S8). Biological concentrations of peptide-free transition metal ions are not anticipated to approach this level, however,9 and metal displacement is therefore unlikely to significantly impact the ability of the probe to function in most biological environments.
[0240]The reaction between 3 and H2O2 oxidizes the ligand, rather than the metal, as assessed by EPR, IR, UV/vis, and NMR spectroscopies. Most of the analyses were performed in organic solvents to facilitate the characterization, but MS data affirm that the reaction occurs in water to yield the same para-quinone-containing products (Figure S12). 1H NMR analysis of the product mixture does not detect any free ligand, suggesting that the Mn(II) complexes with the oxidized ligands are also water-stable. The lack of precipitation suggests that complex 4, which has two inner-sphere bromide ions, is not a major product of H2O2 oxidation in water. Fuller interrogation of the stability of complex 4 is complicated by the inability to generate it cleanly in water; complexes with H4qtp2 and the mono-para-quinone ligand, H2qtp2, are also present. Upon prolonged oxidation (3 h) a 420 nm band begins to appear in the UV/vis spectrum; this may be consistent with Mn(III) or Mn(IV). A similar feature was not observed for the monoquinol complex, suggesting that the metal center in 3 is more sensitive to over-oxidation by H2O2 than 1.
[0241]As was observed with complex 1, excess H2O2 only oxidizes about ˜70% of the quinols of 3 to para-quinones. We speculate that secondary reactions between the oxidized probes and H2O2 or another ROS may reduce the probe back to 3, thereby limiting the maximum oxidation. This may be connected to the SOD activity, which is comparable to that of 1. The oxidation of the ligand can also be reversed with dithionite. The ability to reverse the oxidation of the probe is valuable since it may enable a freely diffusing sensor to identify regions of high oxidative activity. Under these circumstances, the probe could be deactivated by naturally occurring anti-oxidants upon exiting a region with high concentrations of ROS.
[0242]Complex 3 is an excellent MRI contrast agent, and the 5.46 (+0.19) mM−1s−1 r1 value is high relative to clinically approved mononuclear Gd(III)- or Mn(II)-containing contrast agents. Higher r1 values have been measured for mononuclear Mn(II) complexes, albeit under different conditions. At pH 7.0, the Mn(II) complexes with the structurally similar and hexadentate Hptp1 and H2qtp1 ligands have r1 values of 4.39 and 4.73 mM−1s−1. The Hptp1 complex was recently firmly established to be a q=1 species at pH 7.4, and its relatively high r1 has been attributed to rapid inner-sphere water exchange. We believe that the higher r1 values for the H2qtp1 and H4qtp2 complexes result from more extensive second-sphere interactions with water molecules, which have been found to markedly increase the relaxivities of Gd(III)-containing MRI contrast agents. The r1 values for [Mn(Hptp1)(MeCN)]2+, 1, and 3 scale with the number of hydroxyl groups on the ligand; each installed OH group increases r1 by 0.36 mM−1 s−1. We currently speculate that the enhancement in r1 is accomplished through proton exchange with bulk water and/or second-sphere interactions with water molecules. Hydrogen bonding between a phenolic O-donor and a second-sphere water molecule was observed in the crystal structure of [Mn(Hptp1)(MeCN)]2+.
[0243]Upon exposure to H2O2, the relaxivity increases by 31%. To the best of our knowledge, 3 is the third MRI contrast agent with a direct turn-on r1 response to H2O2. Other redox-responsive contrast agents either display a turn-off response or require a co-analyte. In 2013, Almutairi and co-workers reported coated Gd2O3 nanoparticles that exhibited a 10-fold increase in r1 upon exposure to excess H2O2. Although the response is stronger, its irreversibility would prevent the sensors from tracking fluctuations in the concentration of H2O2.
[0244]Even though the oxidation of the ligand should render it a weaker chelate and likely triggers the release of free Mn(II), we do not believe that the entirety of the r1 response can be attributed to release of the metal ion. We previously found that [Mn(H2O)6]2+ has a r1 value of about 5.3 mM−1s−1 under conditions that are identical to those used to characterize the relaxivity of 3 in the presence and absence of H2O2.10 If the ligand oxidation were to merely release Mn(II), the relaxivity would remain approximately the same. The para-quinones in H2qtp2 and qtp2 may coordinate to the metal to an extent; a prior study from our lab found that carbonyl groups from esters could bind to Mn(II) as parts of a polydentate ligand. Further, the remaining quinol in the partially oxidized H2qtp2 would be anticipated to deprotonate and bind to the metal above pH 7.0.
[0245]One concern about introducing redox-active metals into a biological system is that they have the capacity to increase the concentrations of ROS through reactions with O2. The H2qtp1 complex 1 was instead found to be a strong anti-oxidant in that it can catalytically degrade superoxide and transfer hydrogen atoms to radical species. Despite the significant structural differences, compound 3 behaves similarly. The superoxide dismutase (SOD) activity is approximately equal to that for 1, and its EC50 value, although an imperfect gauge, ranks 3 amongst the best small molecule SOD mimics. Much like 1, complex 3 has an electrochemical feature at about 300 mV vs. NHE, but this feature is much less reversible. A large concentration of O2 will degrade 3, similar to what we found for 1. Although biological concentrations of H2O2 likely dwarf those of O2−, degradation of the probes by other ROS could become problematic in longer-term MRI studies.
[0246]The hydrogen atom donating ability of 3 was measured with the 2,2-diphenyl-1-picryl-hydrazyl hydrate (DPPH) assay. By this measure, the complex was found to be a superior anti-oxidant to ascorbic acid. Due to the sensitivity of the assay, direct comparison of 1 and 3 is difficult. Their reactivities relative to a common ascorbic acid standard suggest that their abilities to donate H atoms are approximately equivalent.
[0247]The addition of a second redox-active quinol to a previously reported MRI contrast agent sensor for H2O2 markedly increases its relaxivity response, albeit at the cost of some of the pre-activated complex's stability to adventitious transition metal ions and O2. The fundamental reactivity with H2O2 appears to be the same for the Mn(II) complexes with the H2qtp1 and H4qtp2 ligands, in that the enhancement in r1 is associated with the oxidation of the quinols to para-quinone groups. The second quinol increases the r1 values of both the reduced and oxidized forms of the sensor, and the incorporation of these highly hydrogen-bonding groups appears to be a viable strategy for the production of higher-relaxivity mononuclear contrast agents. The ability to isolate an oxidized product [Mn(qtp2)Br2] allows us to confirm some of the molecular changes associated with the activation of the sensor. The replacement of one of the pyridine rings with a second quinol provides the added benefit of reducing the cytotoxicity. The complex with the diquinol ligand displays anti-oxidant activity that strongly resembles that of the monoquinol complex.
[0248]In summary, MRI contrast agents that use a redox-active ligand to signal the presence of H2O2 are synthesized. Unlike a prior sensor, the ligands in the contrast agents are oxidized and the ligand oxidation is reversible, which may allow related sensors to distinguish highly oxidizing regions within biological samples. The ligand oxidation results in a more weakly coordinating ligand, and causes an increase in r1 as a result from greater aquation of the metal ion. The results disclosed here demonstrate the feasibility of this strategy for H2O2 detection. Additionally, the disclosed complexes are potent anti-oxidants, as assessed by two common assays for such activity. These complexes may therefore be able to serve as theranostic agents, i.e., both MRI contrast and therapeutic agents, for oxidative stress.
[0249]The inventions being thus described, it will be obvious that the same may be varied in many ways. Such variations are not to be regarded as a departure from the spirit and scope of the inventions and all such modifications are intended to be included within the scope of the following claims.
[0250]The above specification provides a description of the synthesis and use of the disclosed compositions and methods. Since many embodiments can be made without departing from the spirit and scope of the invention, the invention resides in the claims.
PUM


Description & Claims & Application Information
We can also present the details of the Description, Claims and Application information to help users get a comprehensive understanding of the technical details of the patent, such as background art, summary of invention, brief description of drawings, description of embodiments, and other original content. On the other hand, users can also determine the specific scope of protection of the technology through the list of claims; as well as understand the changes in the life cycle of the technology with the presentation of the patent timeline. Login to view more.
Similar technology patents
Hydroxyapatite as well as preparation method and application thereof
PendingCN114436231Alow cytotoxicityExcellent biocompatibility and biodegradability
Owner:中科南京绿色制造产业创新研究院 +1
Anti-spermidine monoclonal antibody hybridoma cell strain 4E4 and monoclonal antibody and application thereof
ActiveCN108530540Alow cytotoxicityLower serum spermidine levels
Owner:SOUTH CHINA AGRI UNIV
Carrier for in-situ analysis of intracellular protein compound as well as preparation method and application of carrier
Owner:DALIAN INST OF CHEM PHYSICS CHINESE ACAD OF SCI
Application of small molecule compound in preparation of medicine for resisting central nervous system inflammation
PendingCN113209092Alow cytotoxicitygood development prospects
Owner:SUZHOU UNIV
Applications of coumarin compounds in preparing HIV-latency-resisting treatment medicine
InactiveCN105708836Alow cytotoxicitypromote clearance
Owner:FUDAN UNIV
Classification and recommendation of technical efficacy words
- low cytotoxicity
Medical devices having antimicrobial coatings thereon
ActiveUS7402318B2low cytotoxicity
Owner:ALCON INC
2-(4-alkylformyloxyphenylcarbonylmethylthio)pyrimidine compounds and application thereof
InactiveCN102558072AGood anti-HIV-1 virus activitylow cytotoxicity
Owner:KUNMING UNIV OF SCI & TECH
Autophagic inhibiting polypeptide
ActiveCN107501405AFacilitate large-scale promotion and utilizationlow cytotoxicity
Owner:江苏护理职业学院
Composite body for antigen or drug delivery
InactiveUS20130052127A1low cytotoxicitydeliver and safely and effectively
Owner:NAGASAKI UNIVERSITY +2
Amphiphilic Cationic Polymers and Methods of Use Thereof
InactiveUS20130071444A1low cytotoxicityintermediate size
Owner:CHARLOTTE MECKLENBURG HOSPITAL AUTHORITY