
Pathway recognition algorithm using data integration on genomic models (paradigm)

a path recognition algorithm and genomic model technology, applied in the field of path recognition algorithms using data integration on genomic models, can solve the problems of inability to translate modern advances in basic cancer biology, failure to apply knowledge in practice, and a lack of success based on this paradigm

Active Publication Date: 2018-01-11
RGT UNIV OF CALIFORNIA
View PDF0 Cites 7 Cited by
  • Summary
  • Abstract
  • Description
  • Claims
  • Application Information

AI Technical Summary

Benefits of technology

[0073]FIG. 39 illustrates altered Pathways in HGS-OvCa. (a) The RB and PI3K / RAS pathways, identified by curated analysis and (b) NOTCH pathway, identified by HotNet analysis, are commonly altered. Alterations are defined by somatic mutations, DNA copy-number changes, or in some cases by significant up- or down-regulation compared to expression in diploid tumors. Alteration frequencies are in percentage of all cases; activated genes are red, inactivated genes are blue. (c) Genes in the HR pathway are altered in up to 49% of cases. Survival analysis of BRCA status shows divergent outcome for BRCA mutated cases (exhibiting better overall survival) than BRCA wild-type, and BRCA1 epigenetically silenced cases exhibiting worse survival. (d) The FOXM1 transcription factor network is activated in 87% of cases. Each gene is depicted as a multi-ring circle in which its copy number (outer ring) and gene expression (inner ring) are plotted such that each “spoke” in the ring represents a single patient sample, with samples sorted in increasing order of FOXM1 expression. Excitatory (red arrows) and inhibitory interactions (blue lines) were taken from the NCI Pathway Interaction Database. Dashed lines indicate transcriptional regulation.

Problems solved by technology

While several high-throughput technologies have been available for probing the molecular details of cancer, only a handful of successes have been achieved based on this paradigm.
However, even this success story is clouded by the fact that fewer than 50% of patients with ERBB2-positive breast cancers actually achieve any therapeutic benefit from trastuzumab, emphasizing our incomplete understanding of this well-studied oncogenic pathway and the many therapeutic-resistant mechanisms intrinsic to ERBB2-positive breast cancers (Park J W, Neve R M, Szollosi J, Benz C C. Unraveling the biologic and clinical complexities of HER2.
This overall failure to translate modern advances in basic cancer biology is in part due to our inability to comprehensively organize and integrate all of the omic features now technically acquirable on virtually any type of cancer.
Despite overwhelming evidence that histologically similar cancers are in reality a composite of many molecular subtypes, each with significantly different clinical behavior, this knowledge is rarely applied in practice due to the lack of robust signatures that correlate well with prognosis and treatment options.
However, the challenges of integrating multiple data sources to identify reproducible and interpretable molecular signatures of tumorigenesis and progression remain elusive.
Overrepresentation analyses are limited in their efficacy because they do not incorporate known interdependencies among genes in a pathway that can increase the detection signal for pathway relevance.
In addition, they treat all gene alterations as equal, which is not expected to be valid for many biological systems.
Because of these factors, overrepresentation analyses often miss functionally-relevant pathways whose genes have borderline.differential activity.
They can also produce many false positives when only a single gene is highly altered in a small pathway.
Until recently, few computational approaches were available for incorporating pathway knowledge to interpret high-throughput datasets.
While SPIA represents a major step forward in interpreting cancer datasets using pathway topology, it is limited to using only a single type of genome-wide data.
The accumulation of high throughput molecular profiles of tumors at various levels has been a long and costly process worldwide.

Method used


Image

  • Pathway recognition algorithm using data integration on genomic models (paradigm)
  • Pathway recognition algorithm using data integration on genomic models (paradigm)
  • Pathway recognition algorithm using data integration on genomic models (paradigm)

Examples


example i

ces

[0142]Breast cancer copy number data from Chin (2007 supra) was obtained from NCBI Gene Expression Omnibus (GEO) under accessions GPL5737 with associated array platform annotation from GSE8757.

[0143]Probe annotations were converted to BED 15 format for display in the UCSC Cancer Genomics Browser (Zhu:2009, supra) and subsequent analysis. Array data were mapped to probe annotations via probe ID. Matched expression data from Naderi (2007, supra) was obtained from MIAM1Express at EBI using accession number E-UCon-1. Platform annotation information for Human 1A (V2) was obtained from the Agilent website. Expression data was probe-level median-normalized and mapped via probe ID to HUGO gene names.

[0144]All data was non-parametrically normalized using a ranking procedure including all sample-probe values and each gene-sample pair was given a signed p-value based on the rank. A maximal p-value of 0.05 was used to determine gene-samples pairs that were significantly altered.

[0145]The gli...

example ii

mpendium

[0146]We collected the set of curated pathways available from the National Cancer Institute Pathway Interaction Database (NCI PID) (Schaefer:2009 supra). Each pathway represents a set of interactions logically grouped together around high-level biomolecular processes describing intrinsic and extrinsic sub-cellular-, cellular-, tissue-, or organism-level events and phenotypes. BioPAX level 2 formatted pathways were downloaded. All entities and interactions were extracted with SPARQL queries using the Rasqal RDF engine.

[0147]We extracted five different types of biological entities (entities) including three physical entities (protein-coding genes, small molecules, and complexes), gene families, and abstract processes. A gene family was created whenever the cross-reference for a BioPAX protein listed proteins from distinct genes. Gene families represent collections of genes in which any single gene is sufficient to perform a specific function. For example, homologs with redunda...

example iii

Predicting Biological Pathways

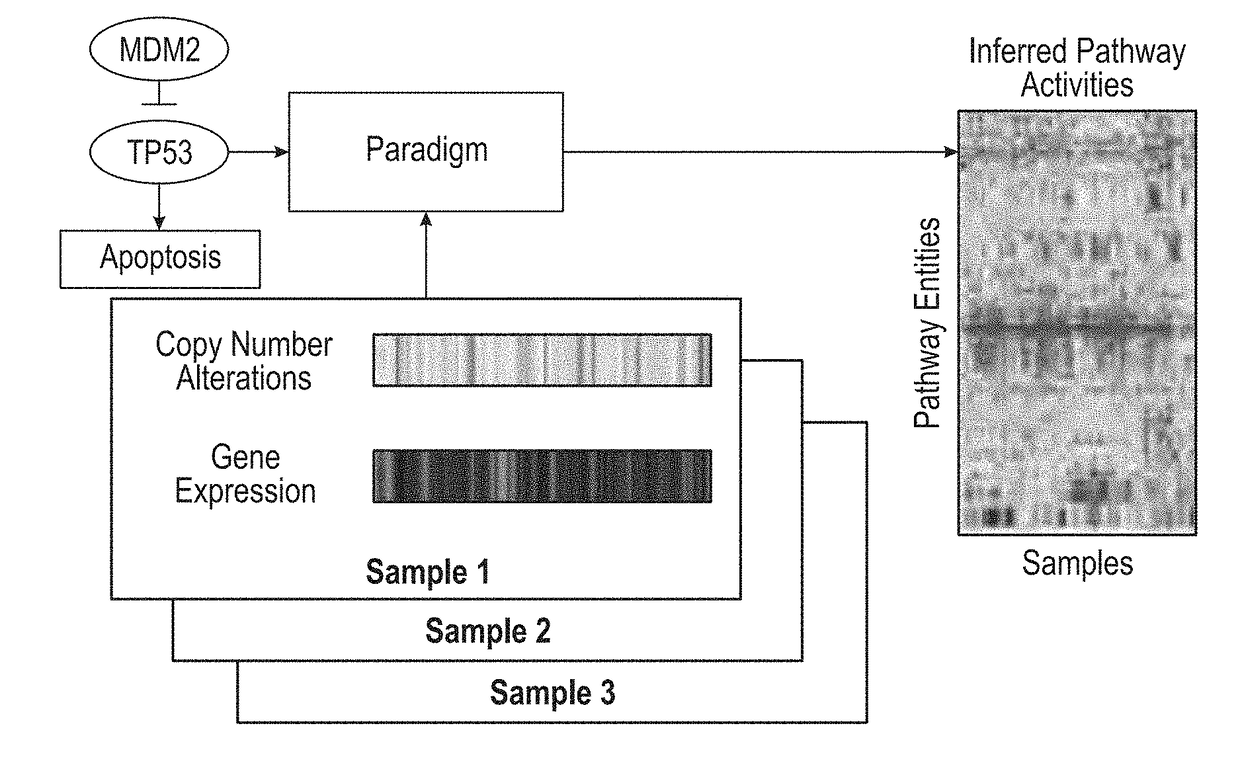
[0150]We first converted each NCI pathway into a distinct probabilistic model. A toy example of a small fragment of the p53 apoptosis pathway is shown in FIG. 2. A pathway diagram from NCI was converted into a factor graph that includes both hidden and observed states. The factor graph integrates observations on gene- and biological process-related state information with a structure describing known interactions among the entities.

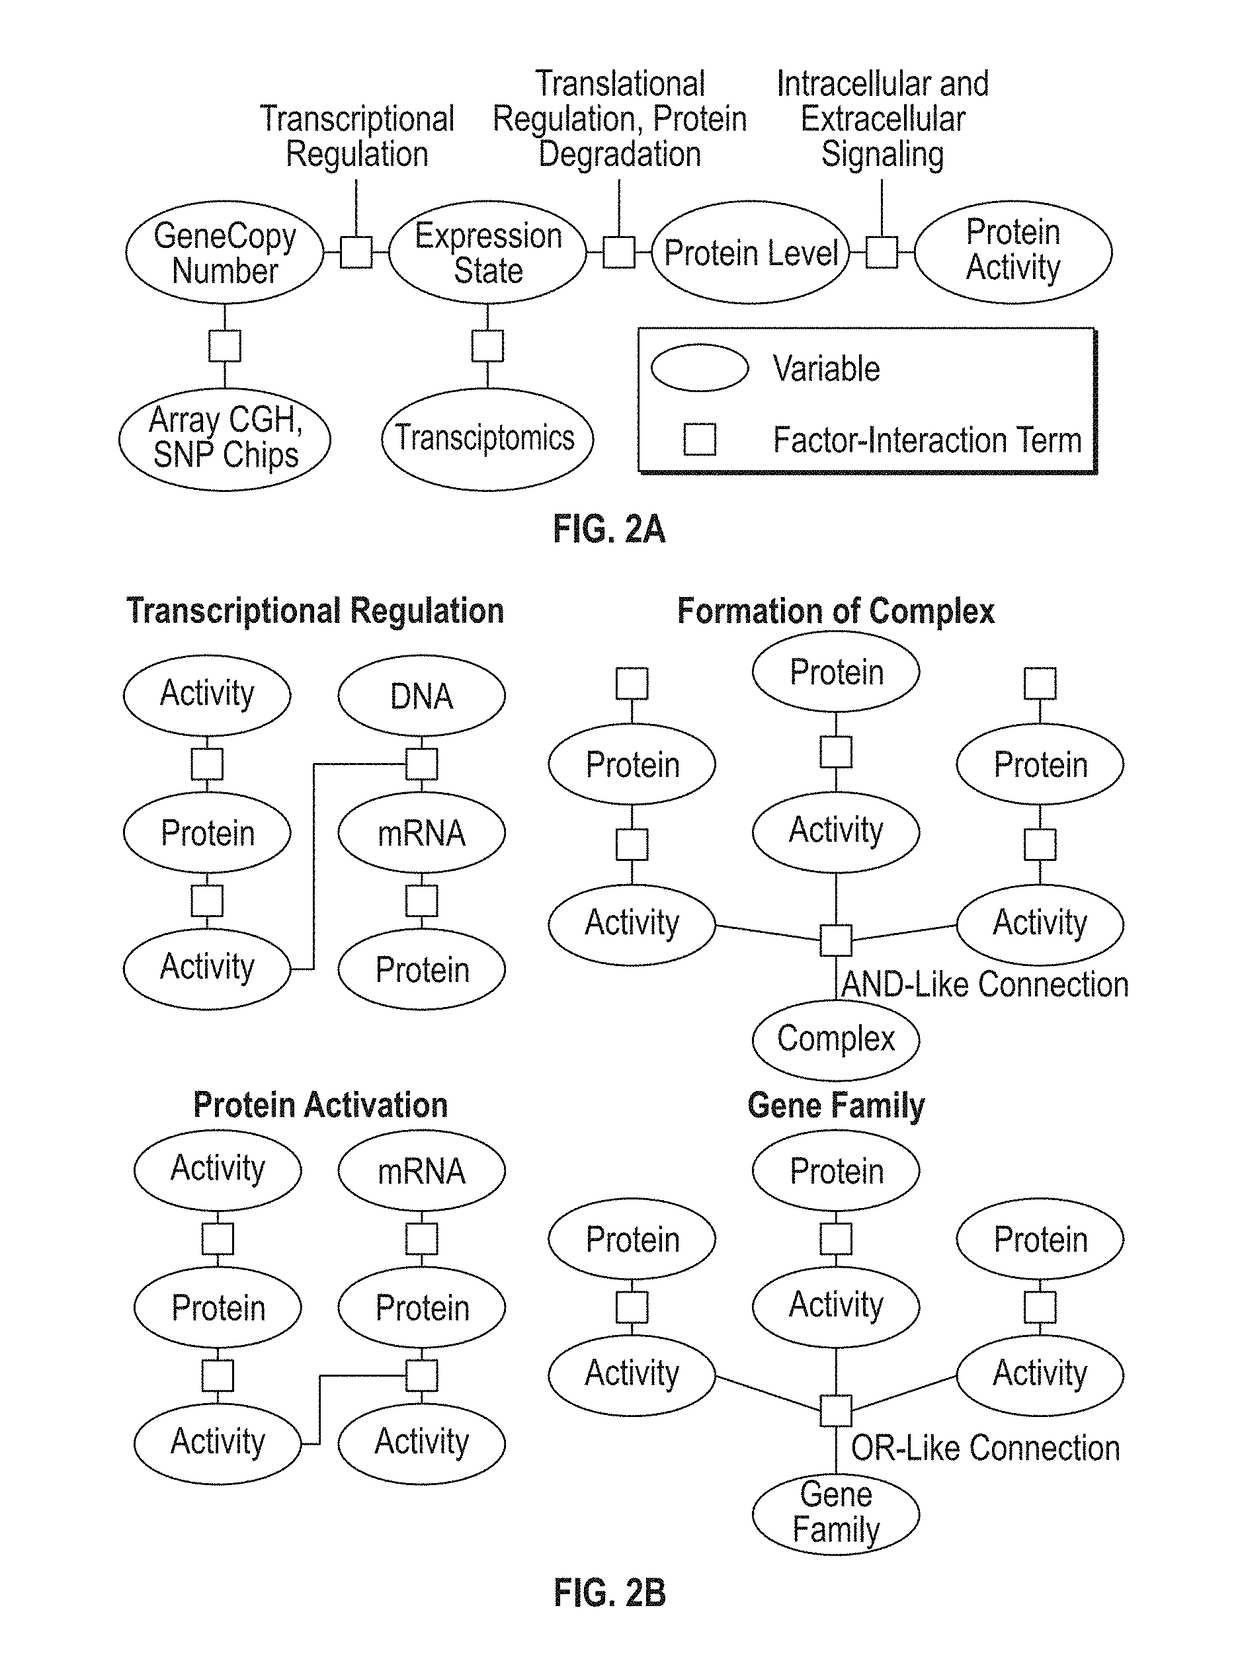
[0151]To represent a biological pathway with a factor graph, we use variables to describe the states of entities in a cell, such as a particular mRNA or complex, and use factors to represent the interactions and information flow between these entities. These variables represent the \textit{differential state of each entity in comparison to a “control” or normal level rather than the direct concentrations of the molecular entities. This representation allows us to model many high-throughput datasets, such as gene expression det...


PUM


Abstract

The present invention relates to methods for evaluating the probability that a patient's diagnosis may be treated with a particular clinical regimen or therapy.

Description

RELATIONSHIP TO OTHER APPLICATIONS[0001]This application is related to and claims priority to U.S. Non-Provisional patent application Ser. No. 13 / 068,002 entitled “PATHWAY RECOGNITION ALGORITHM USING DATA INTEGRATION ON GENOMIC MODELS (PARADIGM)” filed Apr. 29, 2011, which claims the benefit of U.S. Provisional Patent Application Ser. No. 61 / 343,575 entitled “PATHWAY RECOGNITION ALGORITHM USING DATA INTEGRATION ON GENOMIC MODELS (PARADIGM)” filed 29 April, 2010, which is herein incorporated by reference in its entirety.[0002]This invention was made partly using funds from the following United Stated Federal agencies: NSF CAREER award 0845783, National Cancer Institute Contract / Grant numbers 5R21CA135937-02 and 1U24CA143858-01, and National Institute of Health Training Grant number T32 GM070386-01. The US Federal Government has certain rights to this invention.FIELD OF THE INVENTION[0003]The present invention relates to a method for identifying components of biological pathways in an...

Claims


Application Information

Patent Timeline
Patent Type & Authority Applications(United States)
IPC IPC(8): G06F19/12G16B5/30G16B25/10G16B40/30G16B45/00
CPCG06F19/24G06F19/12G06F19/20G16B5/00G16B25/00G16B40/00G16B5/20Y02A90/10G16B40/30G16B5/30G16B25/10G16B45/00
Inventor VASKE, CHARLES J.BENZ, STEPHEN C.STUART, JOSHUA M.HAUSSLER, DAVID
Owner RGT UNIV OF CALIFORNIA
Learn More