Pathway recognition algorithm using data integration on genomic models (PARADIGM)

a path recognition algorithm and genomic model technology, applied in the field of path recognition algorithms using data integration on genomic models, can solve the problems of inability to translate modern advances in basic cancer biology, failure to apply knowledge in practice, and a lack of success based on this paradigm

Active Publication Date: 2012-02-16
RGT UNIV OF CALIFORNIA
View PDF2 Cites 112 Cited by
  • Summary
  • Abstract
  • Description
  • Claims
  • Application Information

AI Technical Summary

Benefits of technology

[0025]The invention further provides a method of analyzing biologically relevant information, comprising: providing access to a model database that stores a dynamic pathway map (DPM), wherein the DPM is generated by modification of a probabilistic pathway model with a plurality of measured attributes for a plurality of elements of a first cell or patient sample; obtaining a plurality of measured attributes for a plurality of elements of a second cell or patient sample; and using the DPM and the plurality of measured attributes for the plurality of elements of the second cell or patient sample, via an analysis engine, to determine a predicted pathway activity information for the second cell or patient sample. In one preferred embodiment, the measured attributes for the plurality of elements of the first cell or patient sample are characteristic for a healthy cell or tissue, a specific age of a cell or tissue, a specific disease of a cell or tissue, a specific disease stage of a diseased cell or tissue, a specific gender, a specific ethnic group, a specific occupational group, and a specific species. In another preferred embodiment, the measured attributes for the plurality of elements of the second cell or patient sample are selected from the group consisting of a mutation, a differential genetic sequence object, a gene copy number, a transcription level, a translation level, a protein activity, and a protein interaction. In an alternative preferred embodiment, the first and second samples are obtained from the same cell or patient, and further comprising providing a treatment to the cell or patient before obtaining the plurality of measured attributes for the plurality of elements of the second cell or patient sample. In a more preferred embodiment, the treatment is selected from the group consisting of radiation, administration of a pharmaceutical to the patient, and administration of a candidate molecule to the cell. In another more preferred embodiment, the candidate molecule is a member of a library of candidate molecules. In another preferred embodiment, the predicted pathway activity information identifies an element as a hierarchical-dominant element in at least one pathway. In a more preferred embodiment, the predicted pathway activity information identifies an element as a disease-determinant element in at least one pathway with respect to a disease. In an alternative embodiment, the method further comprises a step of generating a graphical representation of predicted pathway activity information. In an alternative embodiment, the method further comprises a step of generating a treatment recommendation that is at least in part based on the predicted pathway activity information. In an alternative embodiment, the method further comprises a step of using the predicted pathway activity information to formulate a diagnosis, a prognosis for a disease, or a recommendation selected from the group consisting of a selection of a treatment option, and a dietary guidance. In an alternative embodiment, the method further comprises a step of using the predicted pathway activity information to identify an epigenetic factor, a stress adaptation, a state of an organism, and a state of repair or healing.
[0026]In another embodiment, The invention provides a transformation method for creating a matrix of integrated pathway activities (IPAs) for predicting a clinical outcome for an individual in need, the method comprising the steps of (i) providing a set of curated pathways, wherein the pathways comprise a plurality of entities; (ii) converting each curated pathway into a distinct probabilistic graphical model (PGM), wherein the PGM is derived from factor graphs of each curated pathway, (iii) providing a biological sample from the individual wherein the biological sample comprises at least one endogenous entity comprised in one of the curated pathways; (iv) determining the levels of endogenous entity in the biological sample; (v) comparing the levels of the endogenous entity with those levels of the entity in a previously determined control sample from another individual; (vi) determining whether the levels of the endogenous entity relative to the control entity levels are activated, nominal, or inactivated; (vii) assigning the endogenous entity a numeric state, wherein the state representing activated is +1, the state representing nominal activity is 0, and wherein the state representing inactivated is −1; (viii) repeating steps ii through (vi) for another endogenous entity; (x) compiling the numeric states of each endogenous entity into a matrix of integrated pathway activities (IPAs), (x) wherein the matrix of integrated pathway activities is A wherein Aij represents the inferred activity of entity i in biological sample j; the method resulting in a matrix of integrated pathway activities for predicting a clinical outcome for the individual.
[0027]In one embodiment the method for creating a matrix of IPAs comprises predicting a clinical outcome, providing a diagnosis, providing a treatment, delivering a treatment, administering a treatment, conducting a treatment, managing a treatment, or dispensing a treatment to an individual in need. In another embodiment, the set of curated pathways is from an analysis of human biology. In yet another alternative embodiment, the set of curated pathways is from an analysis of non-human biology. In another embodiment, the determining of the levels of the endogenous entity relative to the control entity levels is performed using Student's t-test. In an alternative embodiment, the determining of the levels of the endogenous entity relative to the control entity levels is performed using ANOVA. In another embodiment, the transforming method comprise the steps of wherein a plurality of matrices of integrated pathway activities from more than one individual are combined, the combined plurality of matrices resulting in a cluster, and where the distances between the individuals' matrices of the resulting cluster are determined. In one embodiment, the determined distances are analysed using K-means cluster analysis. In another alternative embodiment, the determined distances are analysed using K2-means cluster analysis. In a yet other embodiment, the transforming method comprises the step of determining the levels of endogenous entity in the biological sample comprises detecting the endogenous entity with an antibody and thereby determining the levels of endogenous entity. In an alternative embodiment the step of determining the levels of endogenous entity in the biological sample comprises detecting the endogenous entity with a nucleic acid probe and thereby determining the levels of endogenous entity. In another alternative embodiment, the step of determining the levels of endogenous entity in the biological sample comprises detecting the endogenous entity with an organic reagent, wherein the organic reagent binds to the endogenous entity thereby resulting in a detectable signal and thereby determining the levels of endogenous entity.
[0028]In a still further alternative embodiment, the step of determining the levels of endogenous entity in the biological sample comprises detecting the endogenous entity with an inorganic reagent, wherein the inorganic reagent binds to the endogenous entity thereby resulting in a detectable signal and thereby determining the levels of endogenous entity. In another alternative embodiment, the step of determining the levels of endogenous entity in the biological sample comprises detecting the endogenous entity with an organic reagent, wherein the organic reagent reacts with the endogenous entity thereby resulting in a detectable signal and thereby determining the levels of endogenous entity. In another alternative embodiment, the step of determining the levels of endogenous entity in the biological sample comprises detecting the endogenous entity with an inorganic reagent, wherein the inorganic reagent reacts with the endogenous entity thereby resulting in a detectable signal and thereby determining the levels of endogenous entity. In a preferred embodiment, the step of determining the levels of endogenous entity in the biological sample comprises measuring the absorbance of the endogenous entity at the optimal wavelength for the endogenous entity and thereby determining the levels of endogenous entity. In an alternative preferred embodiment, the step of determining the levels of endogenous entity in the biological sample comprises measuring the fluorescence of the endogenous entity at the optimal wavelength for the endogenous entity and thereby determining the levels of endogenous entity. In a still further alternative preferred embodiment, the step of determining the levels of endogenous entity in the biological sample comprises reacting the endogenous entity with an enzyme, wherein the enzyme selectively digests the endogenous entity to create at least one product, detecting the at least one product, and thereby determining the levels of endogenous entity. In a more preferred embodiment, the step of reacting the endogenous entity with an enzyme results in creating at least two products. In a yet more preferred embodiment, the step of reacting the endogenous entity with an enzyme resulting at least two products is followed by a step of treating the products with another enzyme, wherein the enzyme selectively digests at least one of the products to create at least a third product, detecting the at least a third product, and thereby determining the lev...

Problems solved by technology

While several high-throughput technologies have been available for probing the molecular details of cancer, only a handful of successes have been achieved based on this paradigm.
However, even this success story is clouded by the fact that fewer than 50% of patients with ERBB2-positive breast cancers actually achieve any therapeutic benefit from trastuzumab, emphasizing our incomplete understanding of this well-studied oncogenic pathway and the many therapeutic-resistant mechanisms intrinsic to ERBB2-positive breast cancers (Park J W, Neve R M, Szollosi J, Benz C C. Unraveling the biologic and clinical complexities of HER2.
This overall failure to translate modern advances in basic cancer biology is in part due to our inability to comprehensively organize and integrate all of the omic features now technically acquirable on virtually any type of cancer.
Despite overwhelming evidence that histologically similar cancers are in reality a composite of many molecular subtypes, each with significantly different clinical behavior, this knowledge is rarely applied in practice due to the lack of robust signatures that correlate well with prognosis and treatment...

Method used


Image

  • Pathway recognition algorithm using data integration on genomic models (PARADIGM)
  • Pathway recognition algorithm using data integration on genomic models (PARADIGM)
  • Pathway recognition algorithm using data integration on genomic models (PARADIGM)

Examples


example i

Data Sources

[0142]Breast cancer copy number data from Chin (2007 supra) was obtained from NCBI Gene Expression Omnibus (GEO) under accessions GPL5737 with associated array platform annotation from GSE8757.

[0143]Probe annotations were converted to BED15 format for display in the UCSC Cancer Genomics Browser (Zhu:2009, supra) and subsequent analysis. Array data were mapped to probe annotations via probe ID. Matched expression data from Naderi (2007, supra) was obtained from MIAMIExpress at EBI using accession number E-UCon-1. Platform annotation information for Human 1A (V2) was obtained from the Agilent website. Expression data was probe-level median-normalized and mapped via probe ID to HUGO gene names.

[0144]All data was non-parametrically normalized using a ranking procedure including all sample-probe values and each gene-sample pair was given a signed p-value based on the rank. A maximal p-value of 0.05 was used to determine gene-samples pairs that were significantly altered.

[0145...

example ii

Pathway Compendium

[0146]We collected the set of curated pathways available from the National Cancer Institute Pathway Interaction Database (NCI PID) (Schaefer:2009 supra). Each pathway represents a set of interactions logically grouped together around high-level biomolecular processes describing intrinsic and extrinsic sub-cellular-, cellular-, tissue-, or organism-level events and phenotypes. BioPAX level 2 formatted pathways were downloaded. All entities and interactions were extracted with SPARQL queries using the Rasqal RDF engine.

[0147]We extracted five different types of biological entities (entities) including three physical entities (protein-coding genes, small molecules, and complexes), gene families, and abstract processes. A gene family was created whenever the cross-reference for a BioPAX protein listed proteins from distinct genes. Gene families represent collections of genes in which any single gene is sufficient to perform a specific function. For example, homologs wi...

example iii

Modelingand Predicting Biological Pathways

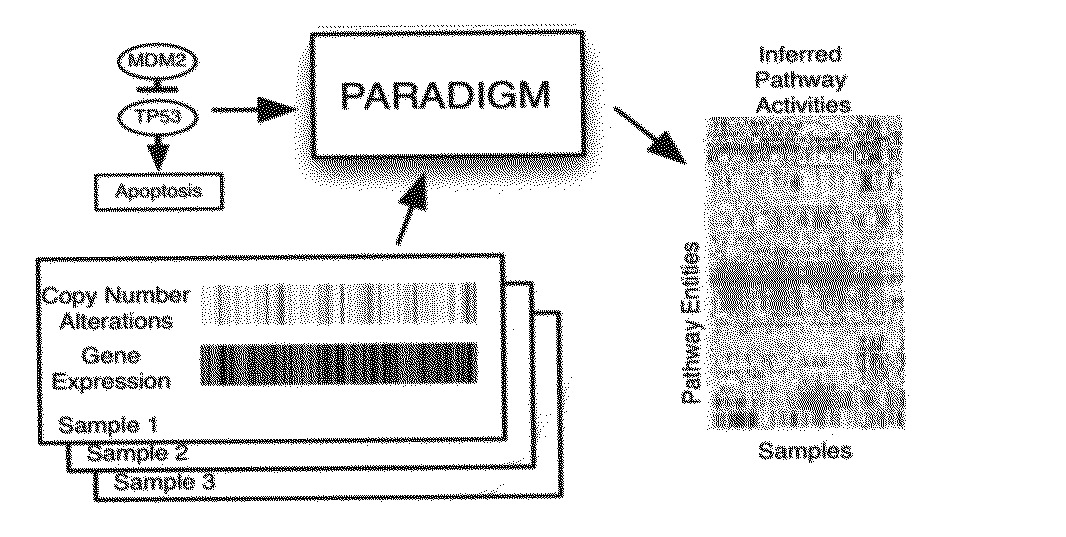
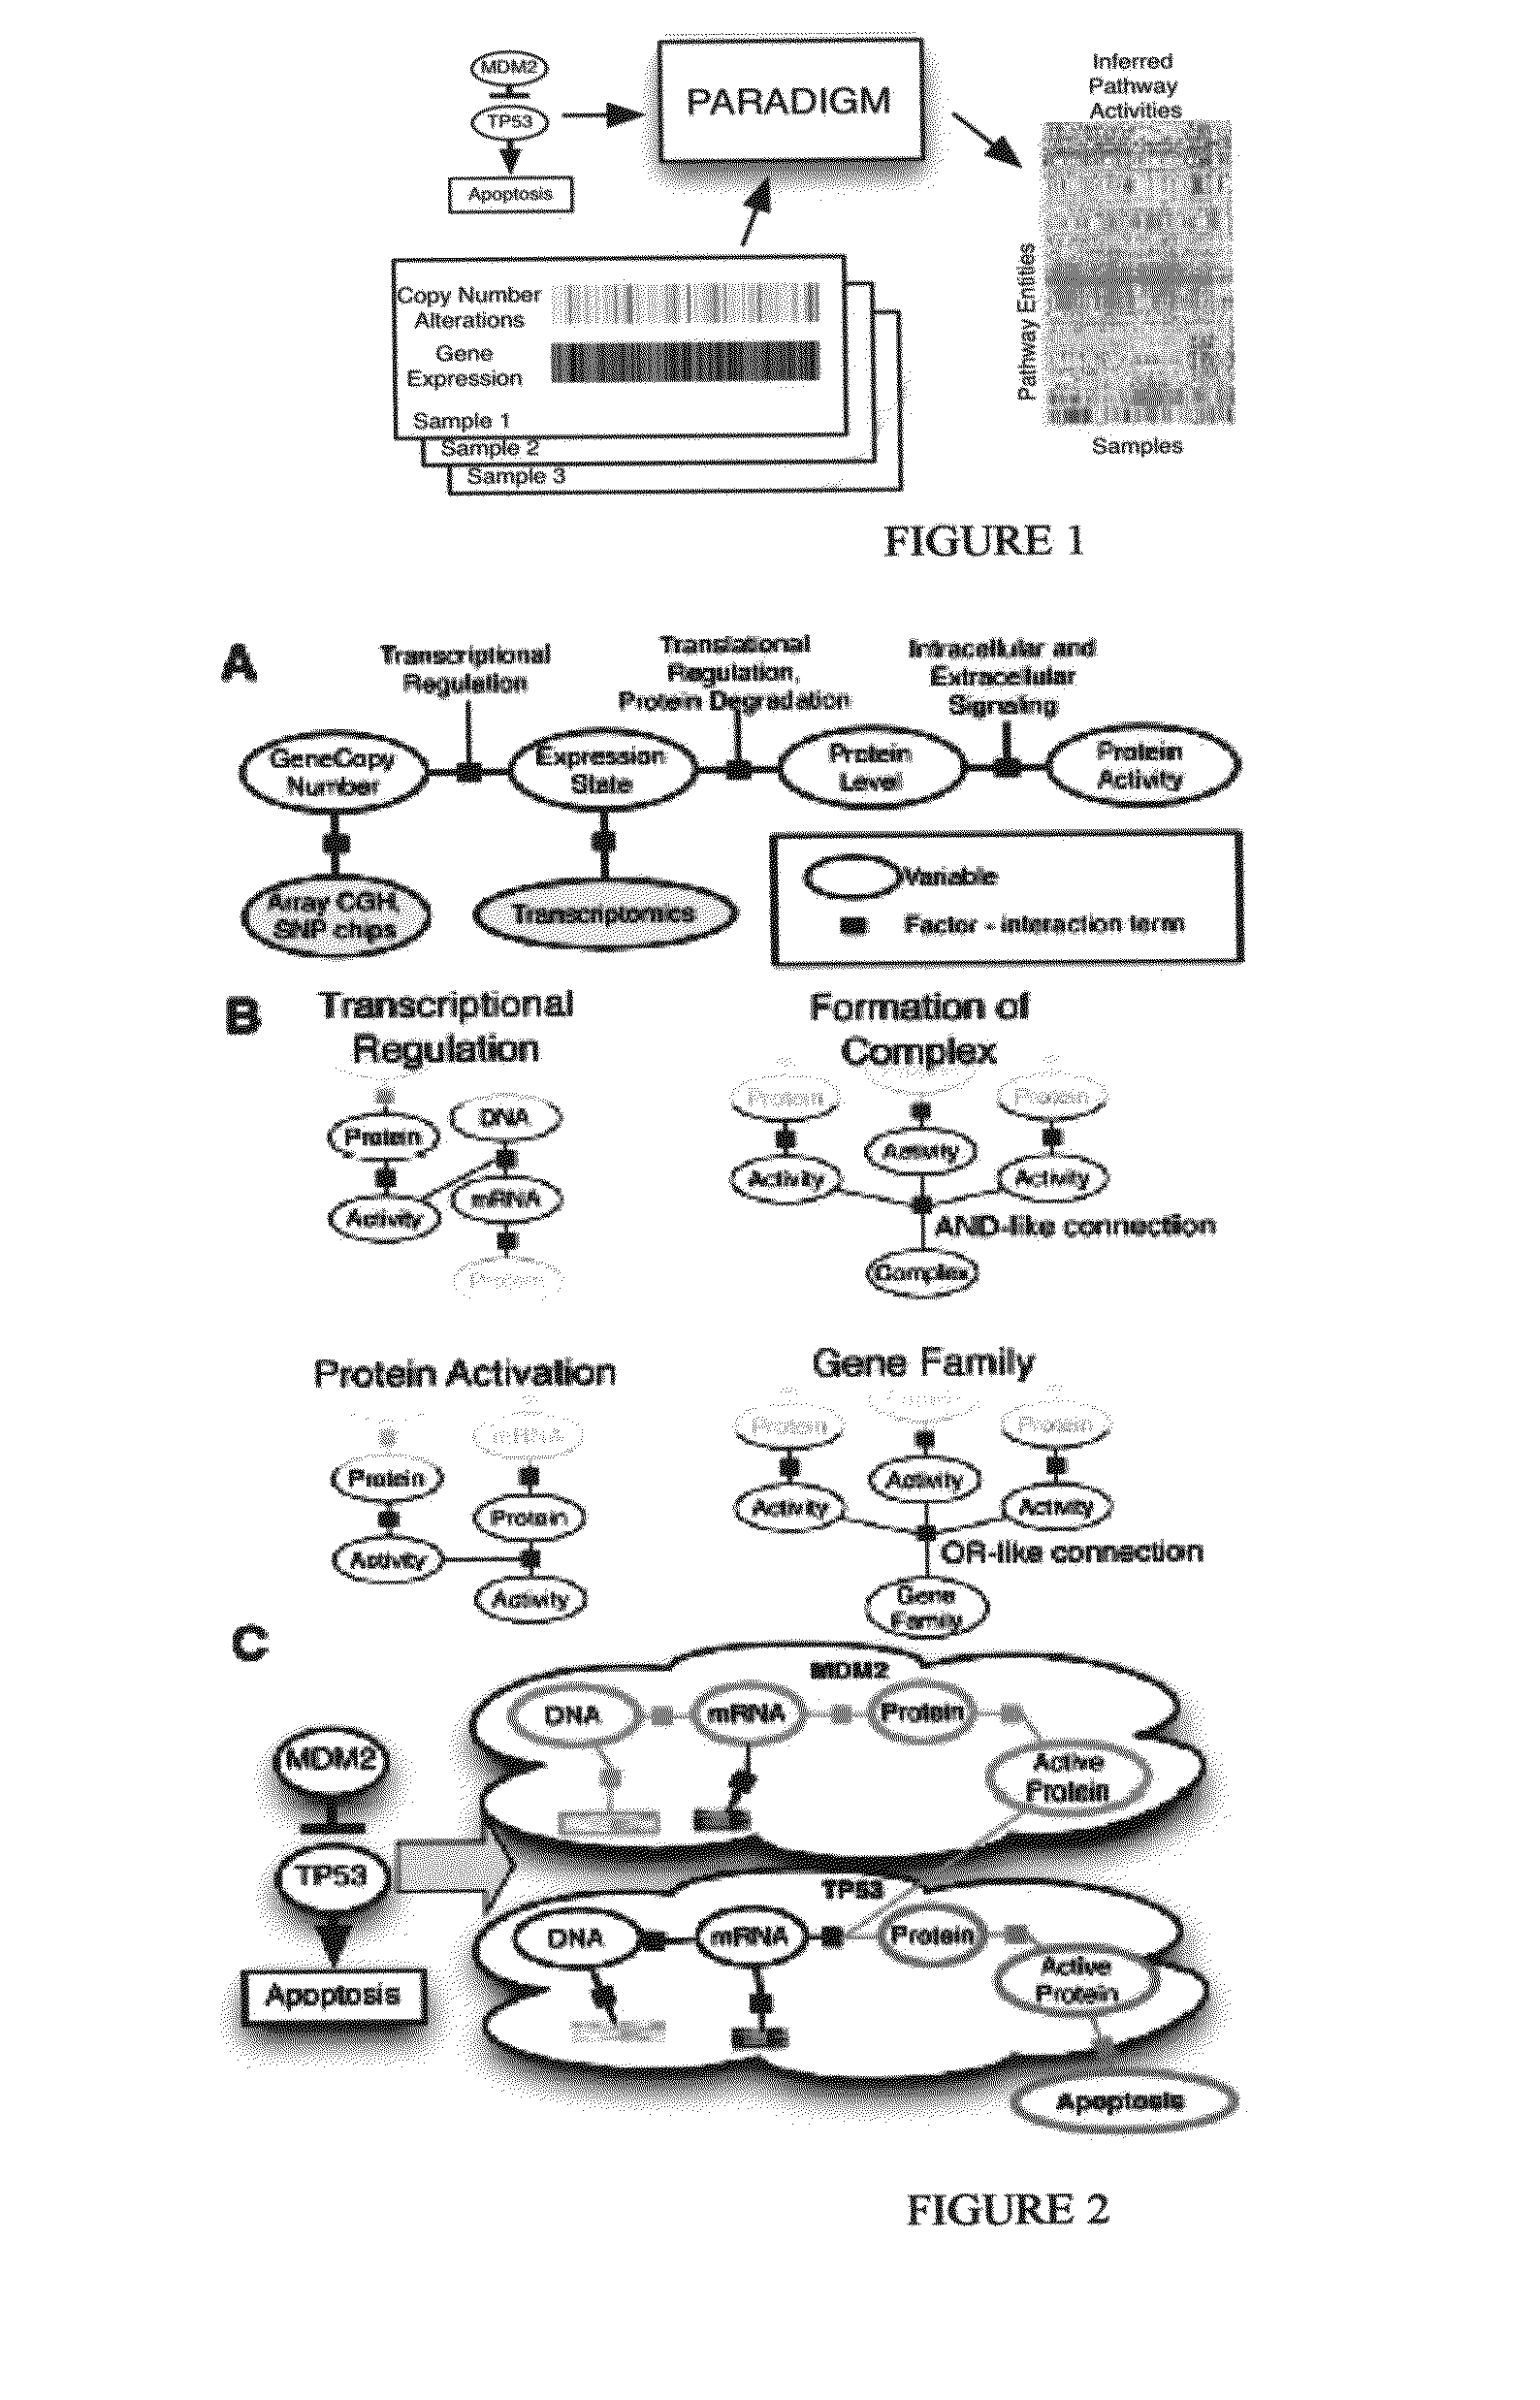
[0150]We first converted each NCI pathway into a distinct probabilistic model. A toy example of a small fragment of the p53 apoptosis pathway is shown in FIG. 2. A pathway diagram from NCI was converted into a factor graph that includes both hidden and observed states. The factor graph integrates observations on gene- and biological process-related state information with a structure describing known interactions among the entities.

[0151]To represent a biological pathway with a factor graph, we use variables to describe the states of entities in a cell, such as a particular mRNA or complex, and use factors to represent the interactions and information flow between these entities. These variables represent the \textit{differential} state of each entity in comparison to a “control” or normal level rather than the direct concentrations of the molecular entities. This representation allows us to model many high-throughput datasets, such as gene e...


PUM


Abstract

The present invention relates to methods for evaluating the probability that a patient's diagnosis may be treated with a particular clinical regimen or therapy.

Description

RELATIONSHIP TO OTHER APPLICATIONS[0001]This application is related to and claims priority from U.S. Provisional Patent Application Ser. No. 61 / 343,575 entitled “PATHWAY RECOGNITION ALGORITHM USING DATA INTEGRATION ON GENOMIC MODELS (PARADIGM)” filed 29 April, 2010, which is herein incorporated by reference in its entirety.[0002]This invention was made partly using funds from the following United Stated Federal agencies: NSF CAREER award 0845783, National Cancer Institute Contract / Grant numbers 5R21CA135937-02 and 1U24CA143858-01, and National Institute of Health Training Grant number T32 GM070386-01. The US Federal Government has certain rights to this invention.FIELD OF THE INVENTION[0003]The present invention relates to a method for identifying components of biological pathways in an individual or subject and determining if the individual or subject is a candidate for a clinical regimen or treatment. The invention also relates to using the methods to diagnose whether a subject is...

Claims


Application Information

Patent Timeline
IPC IPC(8): G06F17/18G06F15/18G06F19/12G16B5/30G16B25/10G16B40/30G16B45/00
CPCG06F19/12G06F19/24G06F19/20G16B5/00G16B25/00G16B40/00G16B5/20Y02A90/10G16B40/30G16B5/30G16B25/10G16B45/00
Inventor VASKE, CHARLES J.BENZ, STEPHEN C.STUART, JOSHUA M.HAUSSLER, DAVID
Owner RGT UNIV OF CALIFORNIA
Why Eureka
Try Eureka