Optical imaging based on spectral shift assessment
a technology of optical imaging and spectral shift, applied in the field of optical imaging, can solve the problems of affecting the accuracy of imaging devices, and affecting the intensity of emitted light,
- Summary
- Abstract
- Description
- Claims
- Application Information
AI Technical Summary
Benefits of technology
Problems solved by technology
Method used
Image

Examples
example 1
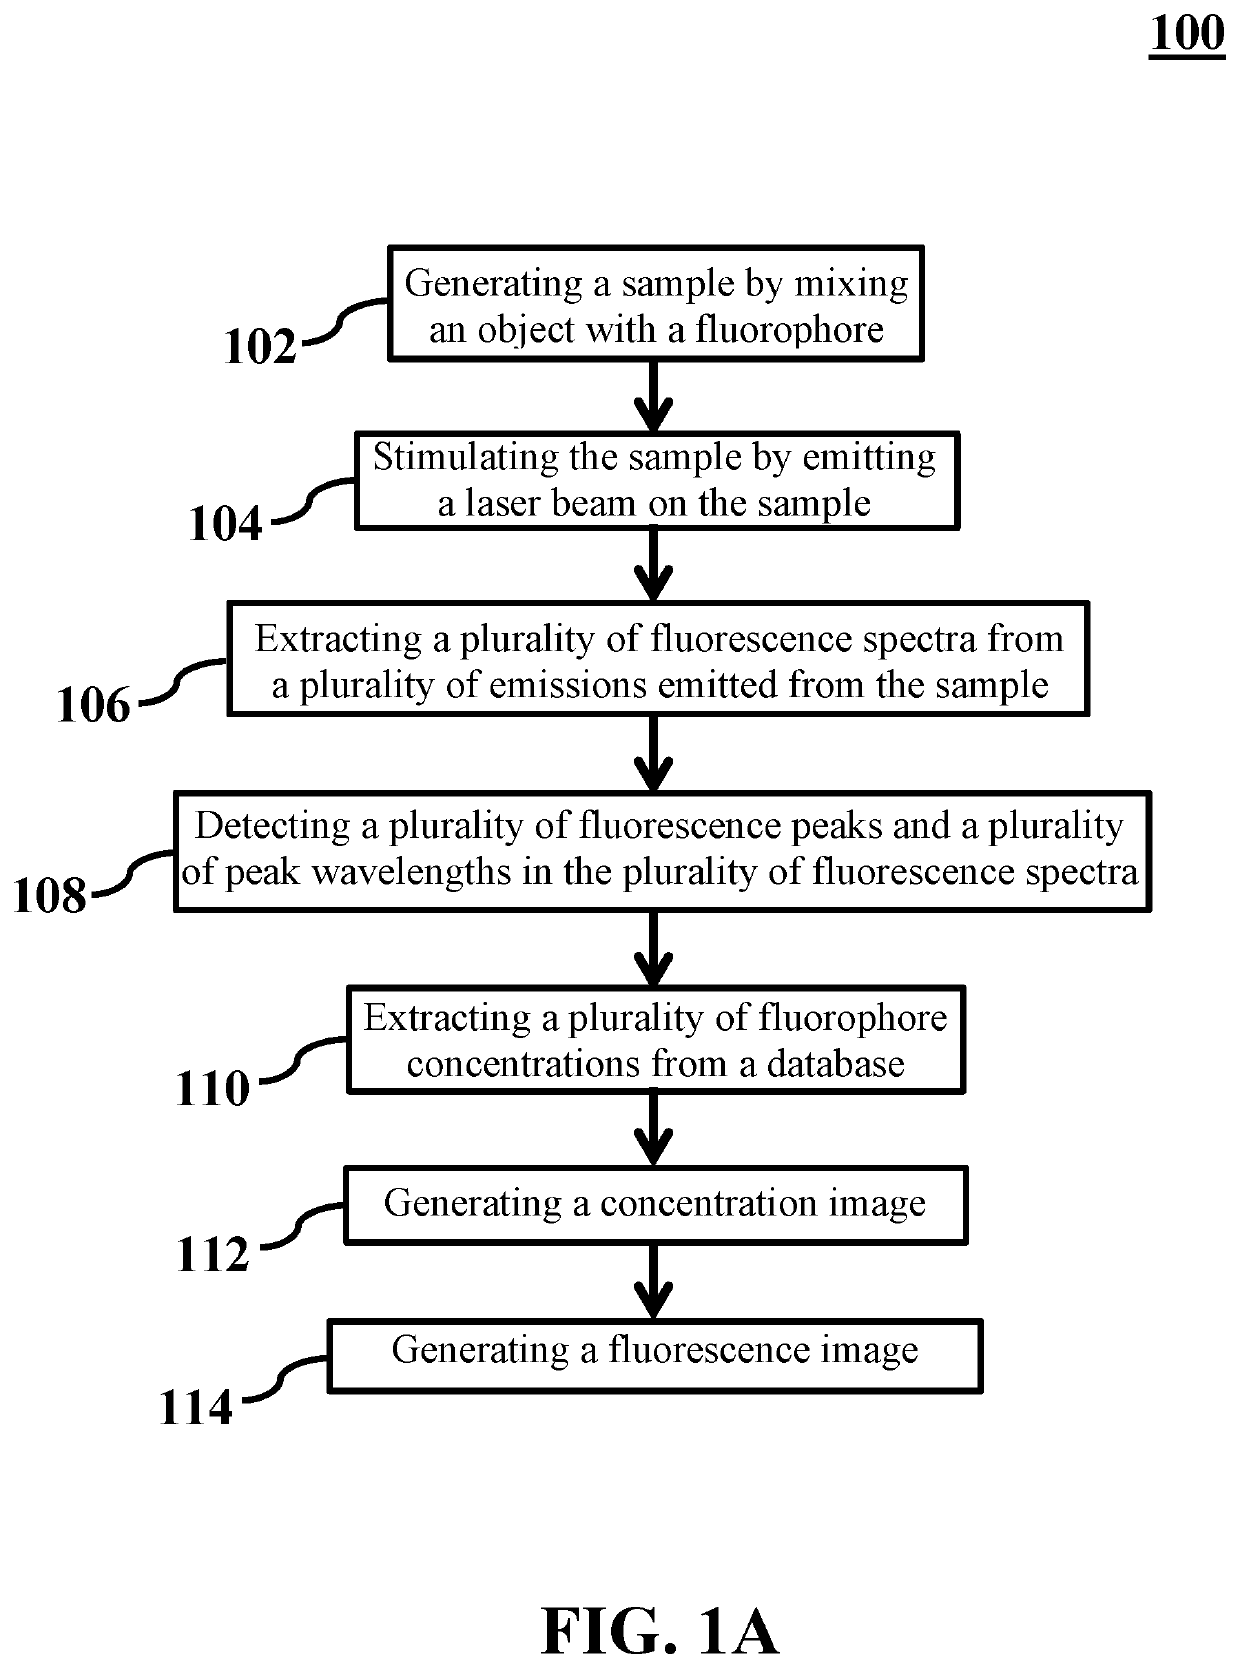
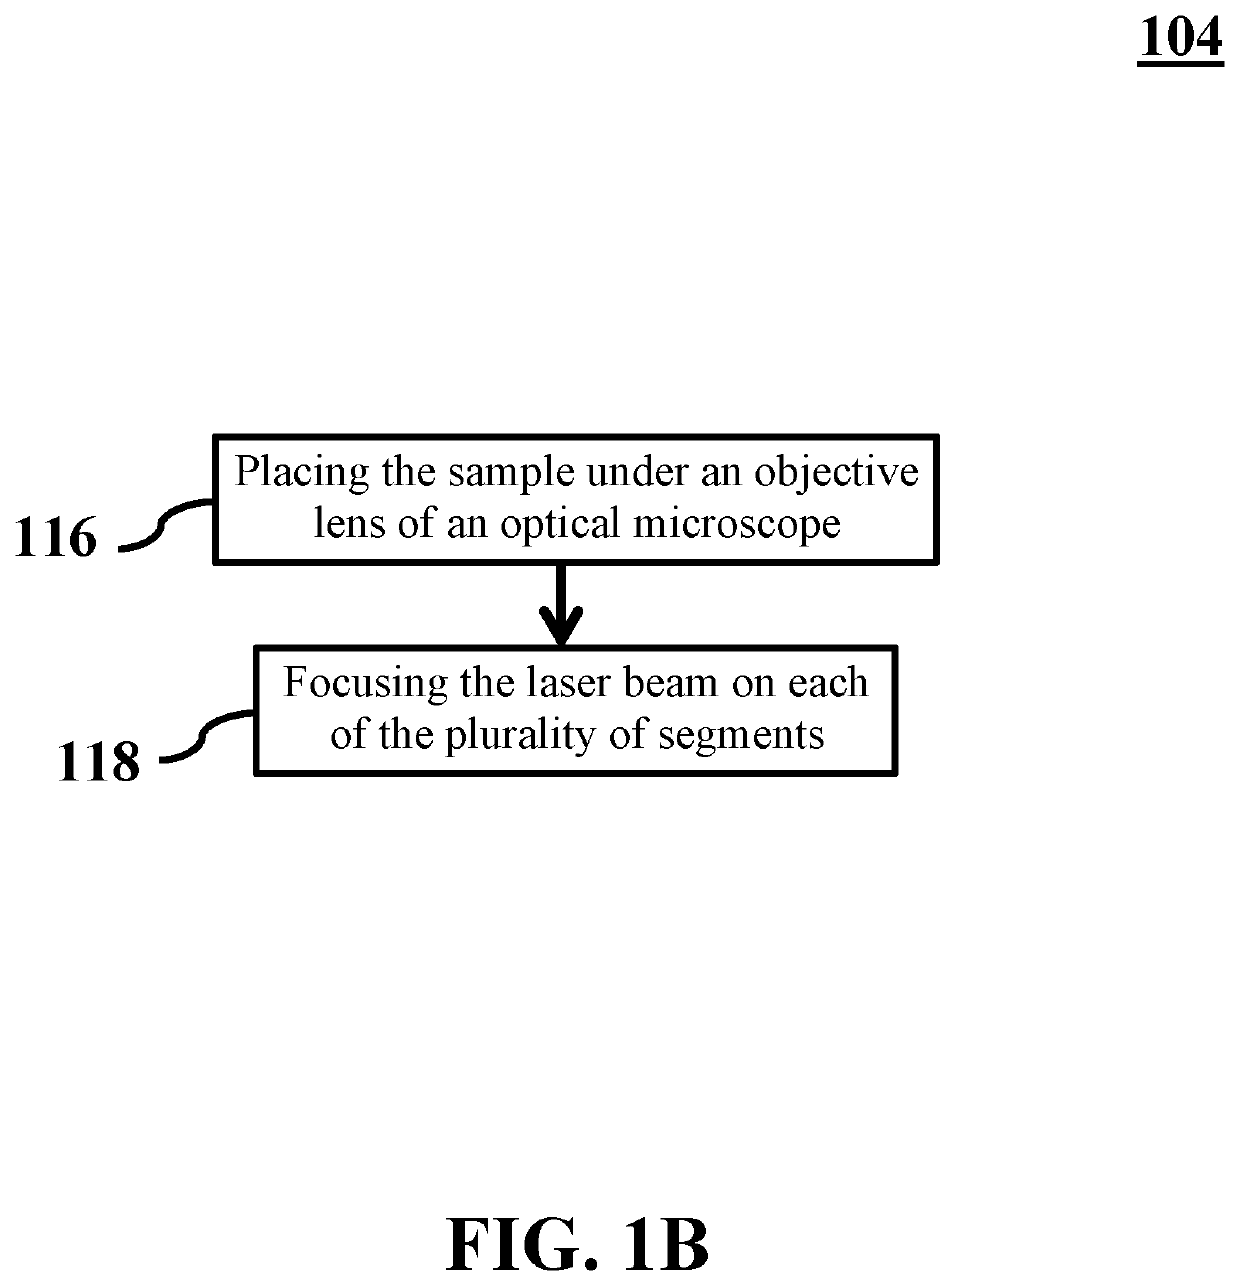
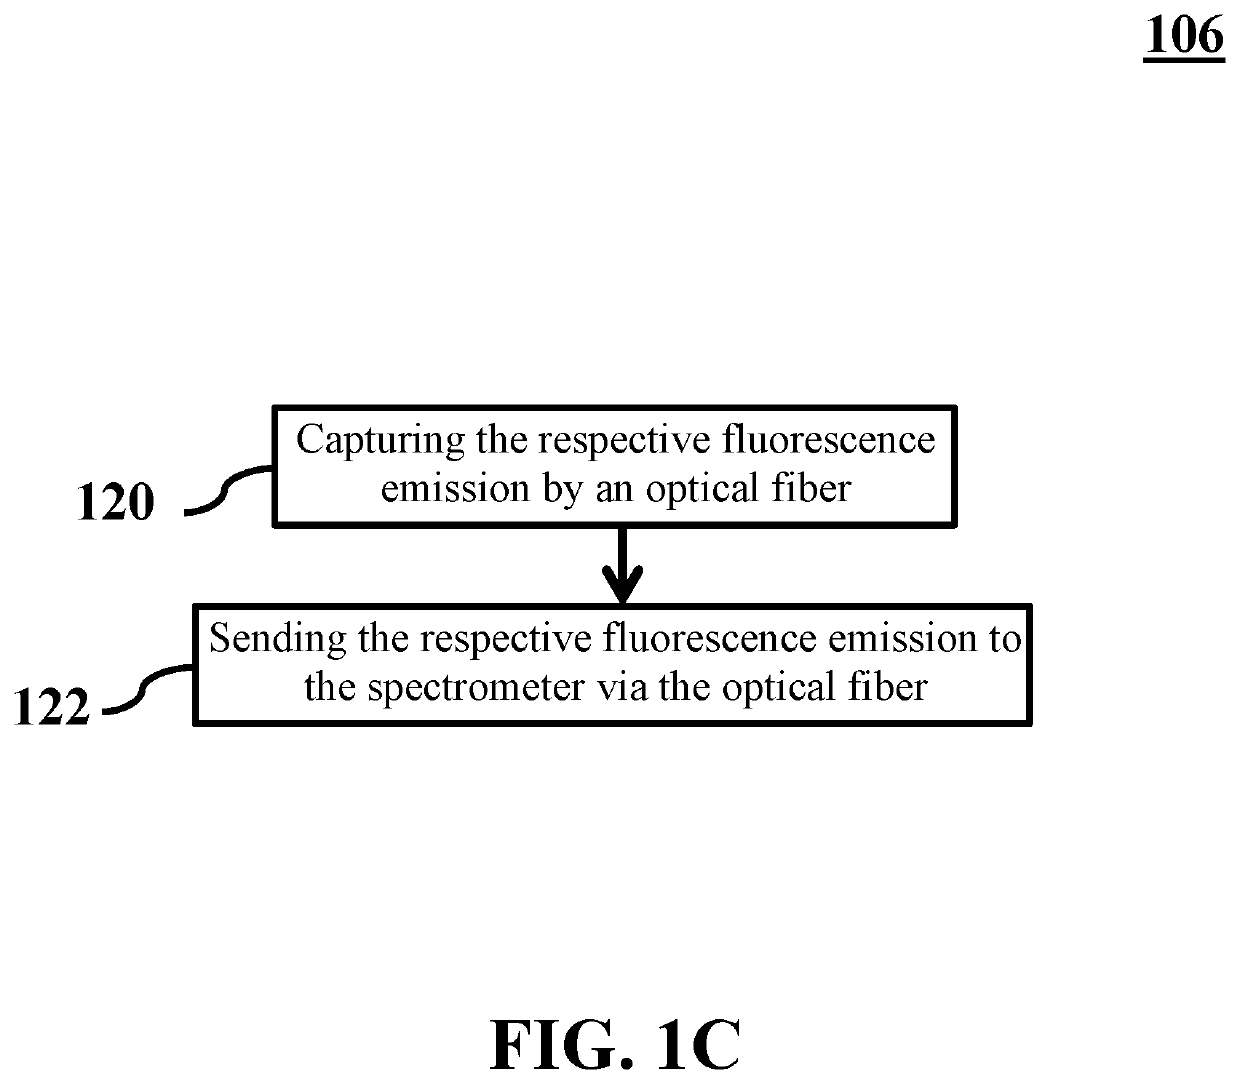
[0071]In this example, a performance of a method (analogous to method 100) for optical imaging based on spectral shift assessment is demonstrated. Different steps of the method are implemented using a system for optical imaging based on spectral shift assessment (analogous to system 200). A tip size of an exemplary optical fiber (analogous to optical fiber 236) is about 500 μm and a field of view of a second eyepiece (analogous to second eyepiece 237) is about 50 μm. A size of each segment of a plurality of segments (analogous to plurality of segments 212) is about 3 μm. The system includes a spectrometer (analogous to spectrometer 204) with a 2048 pixel charge-coupled device (CCD) array and with about 4 nm spectrum resolution. The system also includes a micrometer translation stage (analogous to translation stage 228) which sweeps a sample (analogous to sample 210) with about 6 μm step size. Objects of interest include apple and onion tissues with a dimension about 1 cm×1 cm and a ...
example 2
[0072]In this example, a system similar to the system of EXAMPLE 1 is considered except for a generated sample and a utilized laser. An exemplary sample is generated by mixing an onion tissue with a fluorophore, consistent with step 102 of method 100. The fluorophore includes fluorescein solved in deionized water with a 5 μM concentration. A laser (analogous to laser 202) is utilized to stimulate the sample which is of a type GaN diode with a 405 nm laser wavelength and a 10 mW power. FIG. 9A shows a concentration image of a sample including an onion tissue, consistent with one or more embodiments of the present disclosure. FIG. 8B shows a fluorescence image of a sample including an onion tissue, consistent with one or more embodiments of the present disclosure. As FIGS. 9A and 9B show, the concentration image and the fluorescence image differ for a single sample. Moreover, the concentration image provides a more detailed information about the sample.
PUM
 Abstract
Description
Claims
Application Information
 - R&D
- Intellectual Property
- Life Sciences
- Materials
- Tech Scout
- Unparalleled Data Quality
- Higher Quality Content
- 60% Fewer Hallucinations
Browse by: Latest US Patents, China's latest patents, Technical Efficacy Thesaurus, Application Domain, Technology Topic, Popular Technical Reports.
© 2025 PatSnap. All rights reserved.Legal|Privacy policy|Modern Slavery Act Transparency Statement|Sitemap|About US| Contact US: help@patsnap.com