Raman spectroscopy crystallization analysis method

a raman spectroscopy and crystallization analysis technology, applied in the direction of spectrometry/spectrophotometry/monochromators, instruments, optical radiation measurement, etc., can solve the problems of limited applicability, many crystallization reactions lacking adequate in situ monitoring, offline sampling cannot provide information in a timely manner

Inactive Publication Date: 2005-03-15
KAISER OPTICAL SYST INC
View PDF1 Cites 73 Cited by
  • Summary
  • Abstract
  • Description
  • Claims
  • Application Information

AI Technical Summary

Problems solved by technology

While it is conventional to utilize a turbidity meter to measure the amount of light scattering associated with the progression of crystallization, this has limited applicability owing to the fact that most of the critical events controlling crystallization have already occurred by the time crystallites are of a sufficient size to scatter light.
This, coupled with lack of additional sampling ports available to monitor especially in microreaction vessels, has left many crystallization reactions lacking adequate in situ monitoring.
Unfortunately, offline sampling cannot provide information in a timely manner to adjust crystallization parameters to drive the process toward a desired result.
Additionally, offline sampling is not necessarily indicative of material within a reaction vessel as polymorphic transformations and crystal growth may continue during sample filtration, drying and analytical sample preparation.

Method used


Image

  • Raman spectroscopy crystallization analysis method
  • Raman spectroscopy crystallization analysis method
  • Raman spectroscopy crystallization analysis method

Examples


example 1

A RamanRxn1 analyzer (Kaiser Optical Systems, Ann Arbor, Mich.) was interfaced to a two liter reaction vessel through the use of an 18 inch long fiber optic immersion probe sealed with a sapphire window (Kaiser Optical Systems). The Raman spectra were collected using approximately 100 milliwatts of 785 nanometer laser excitation. This setup yielded a spectral resolution of approximately four wave numbers. The reaction vessel was a two liter temperature controlled reaction vessel. The reaction vessel was charged with a saturated solution of tribehenin (1,2,3-propspanetriyl ester of docosanoic acid) dissolved in an equimolar solvent mixture of cyclomethicone and dimethicone. Reaction temperature and monitoring is performed with a reaction calorimeter.

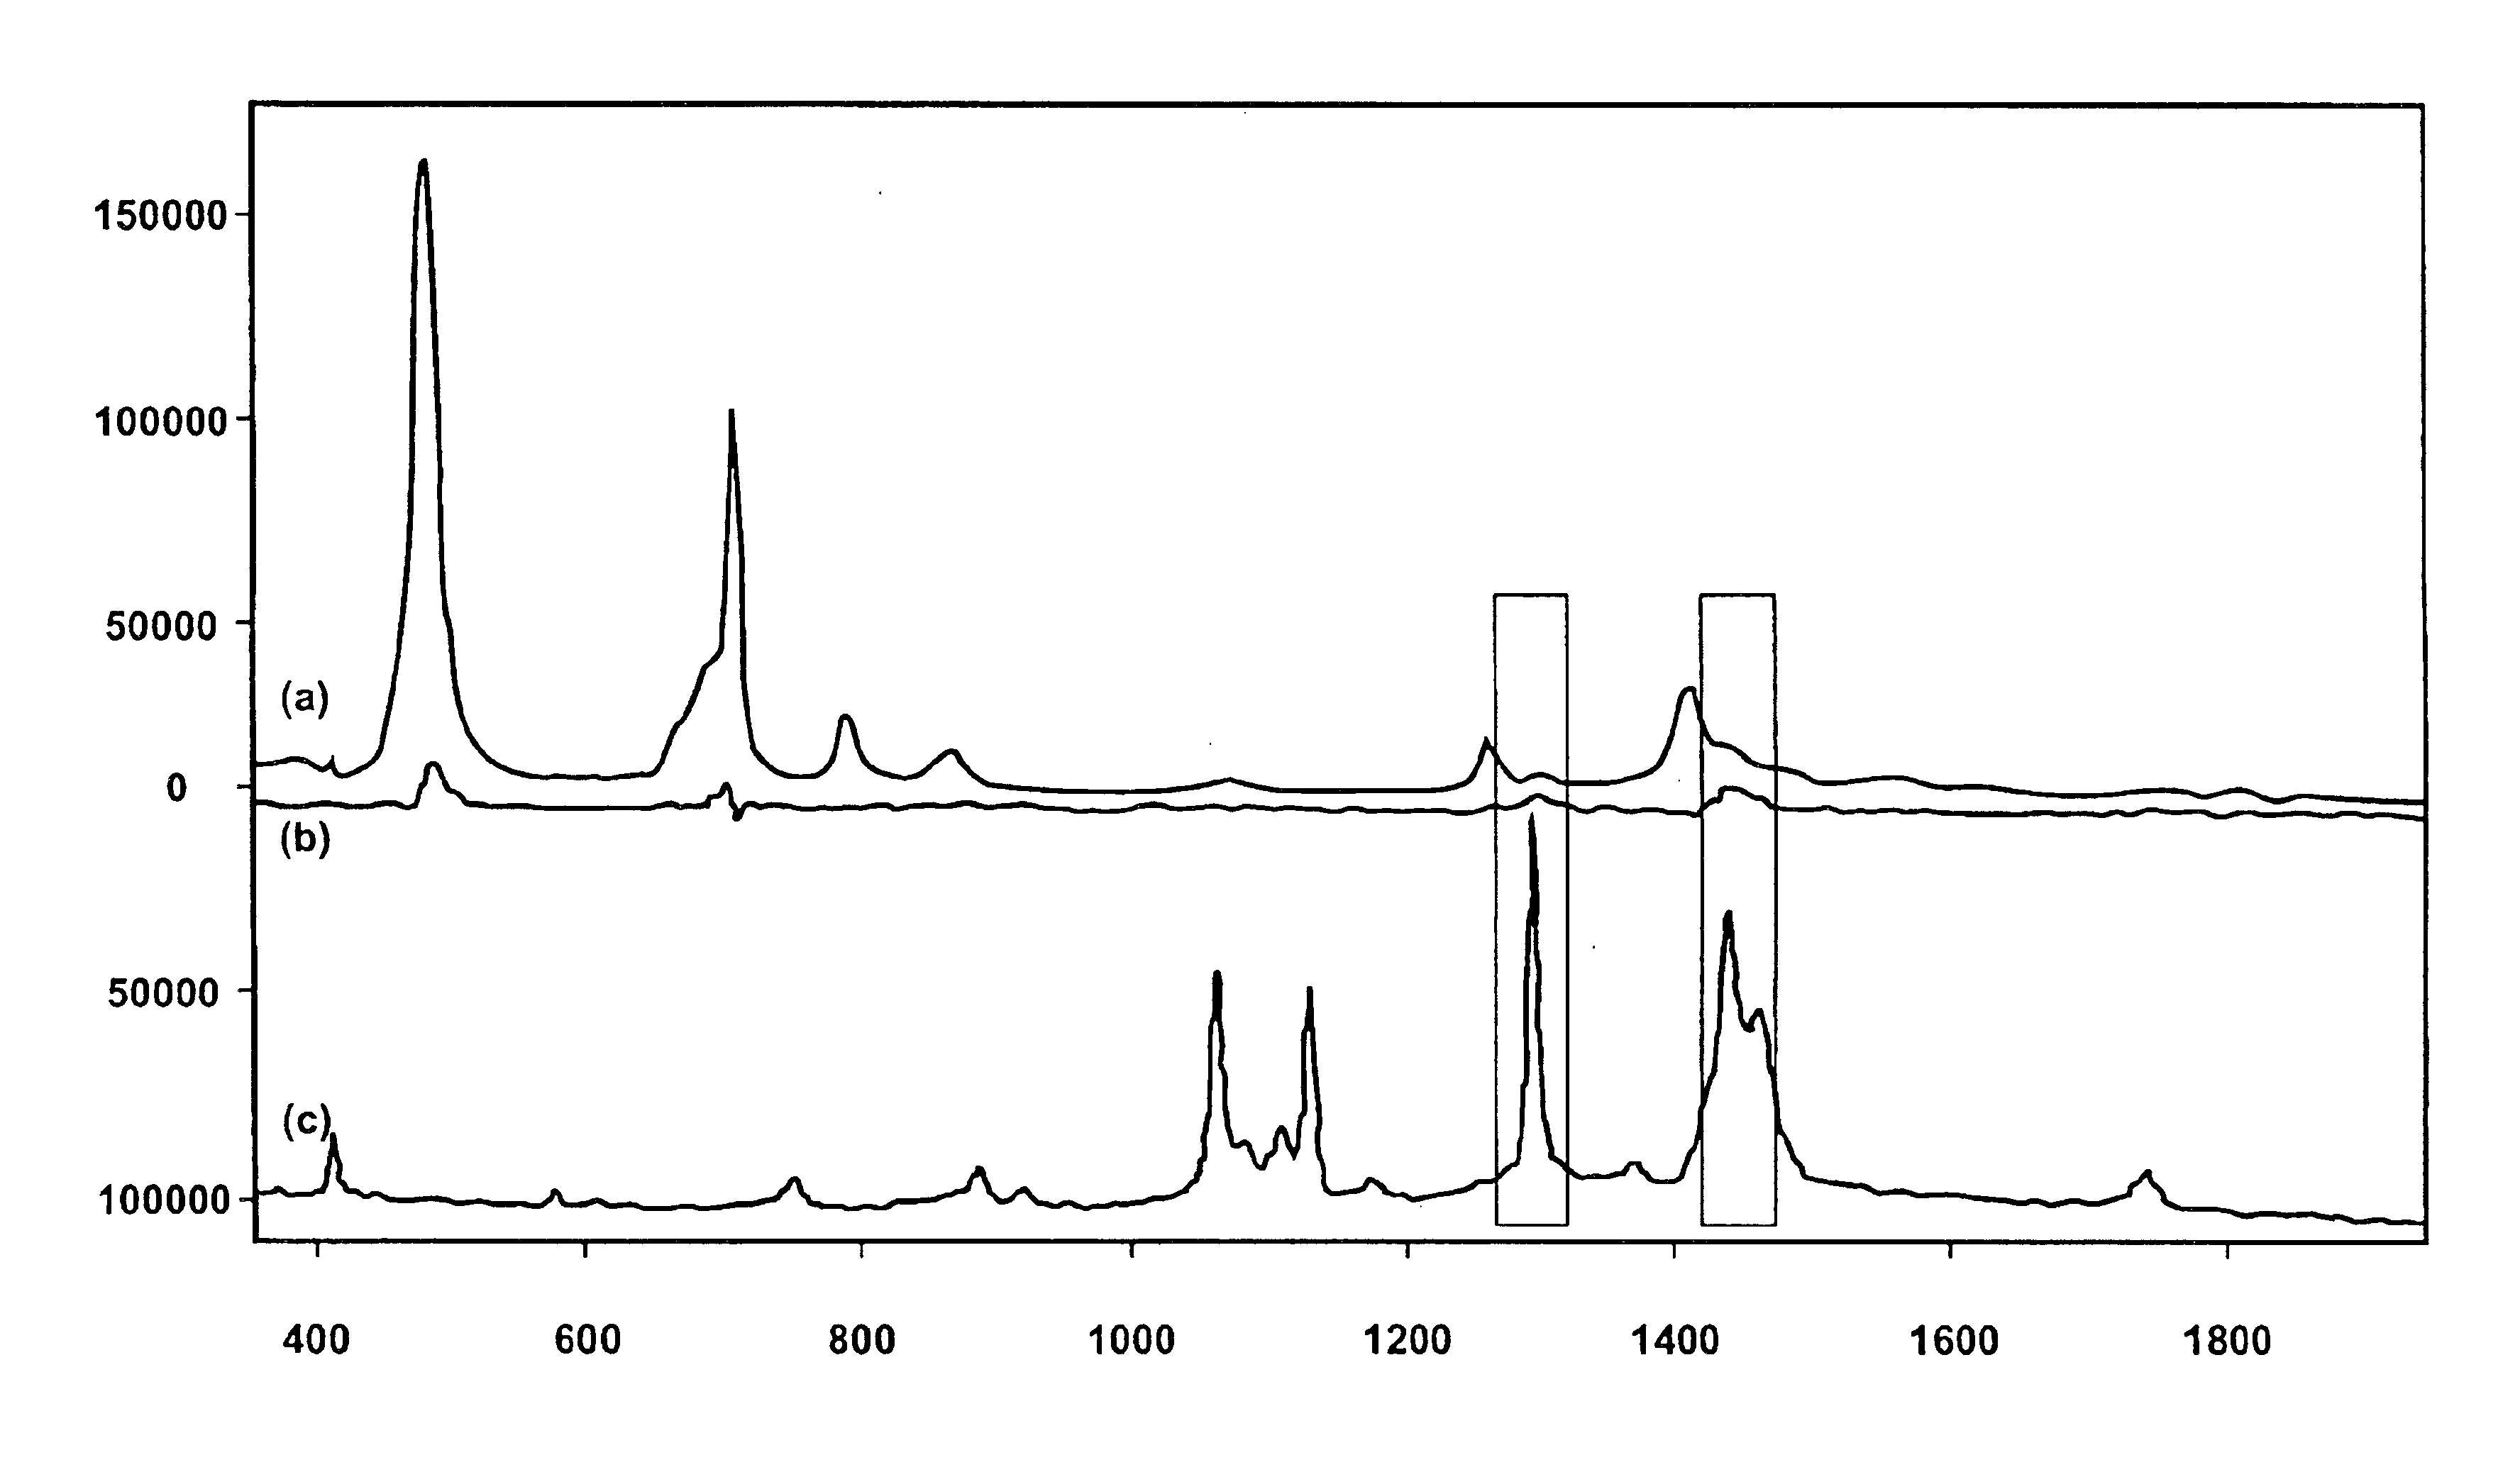
Before recording any crystallization data, Raman spectra in a low wave number spectral region are collected from the reactor contents of the saturated tribehenin solution, as shown in FIG. 1(a). The spectrum is also plotted in FIG. 1 afte...

example 2

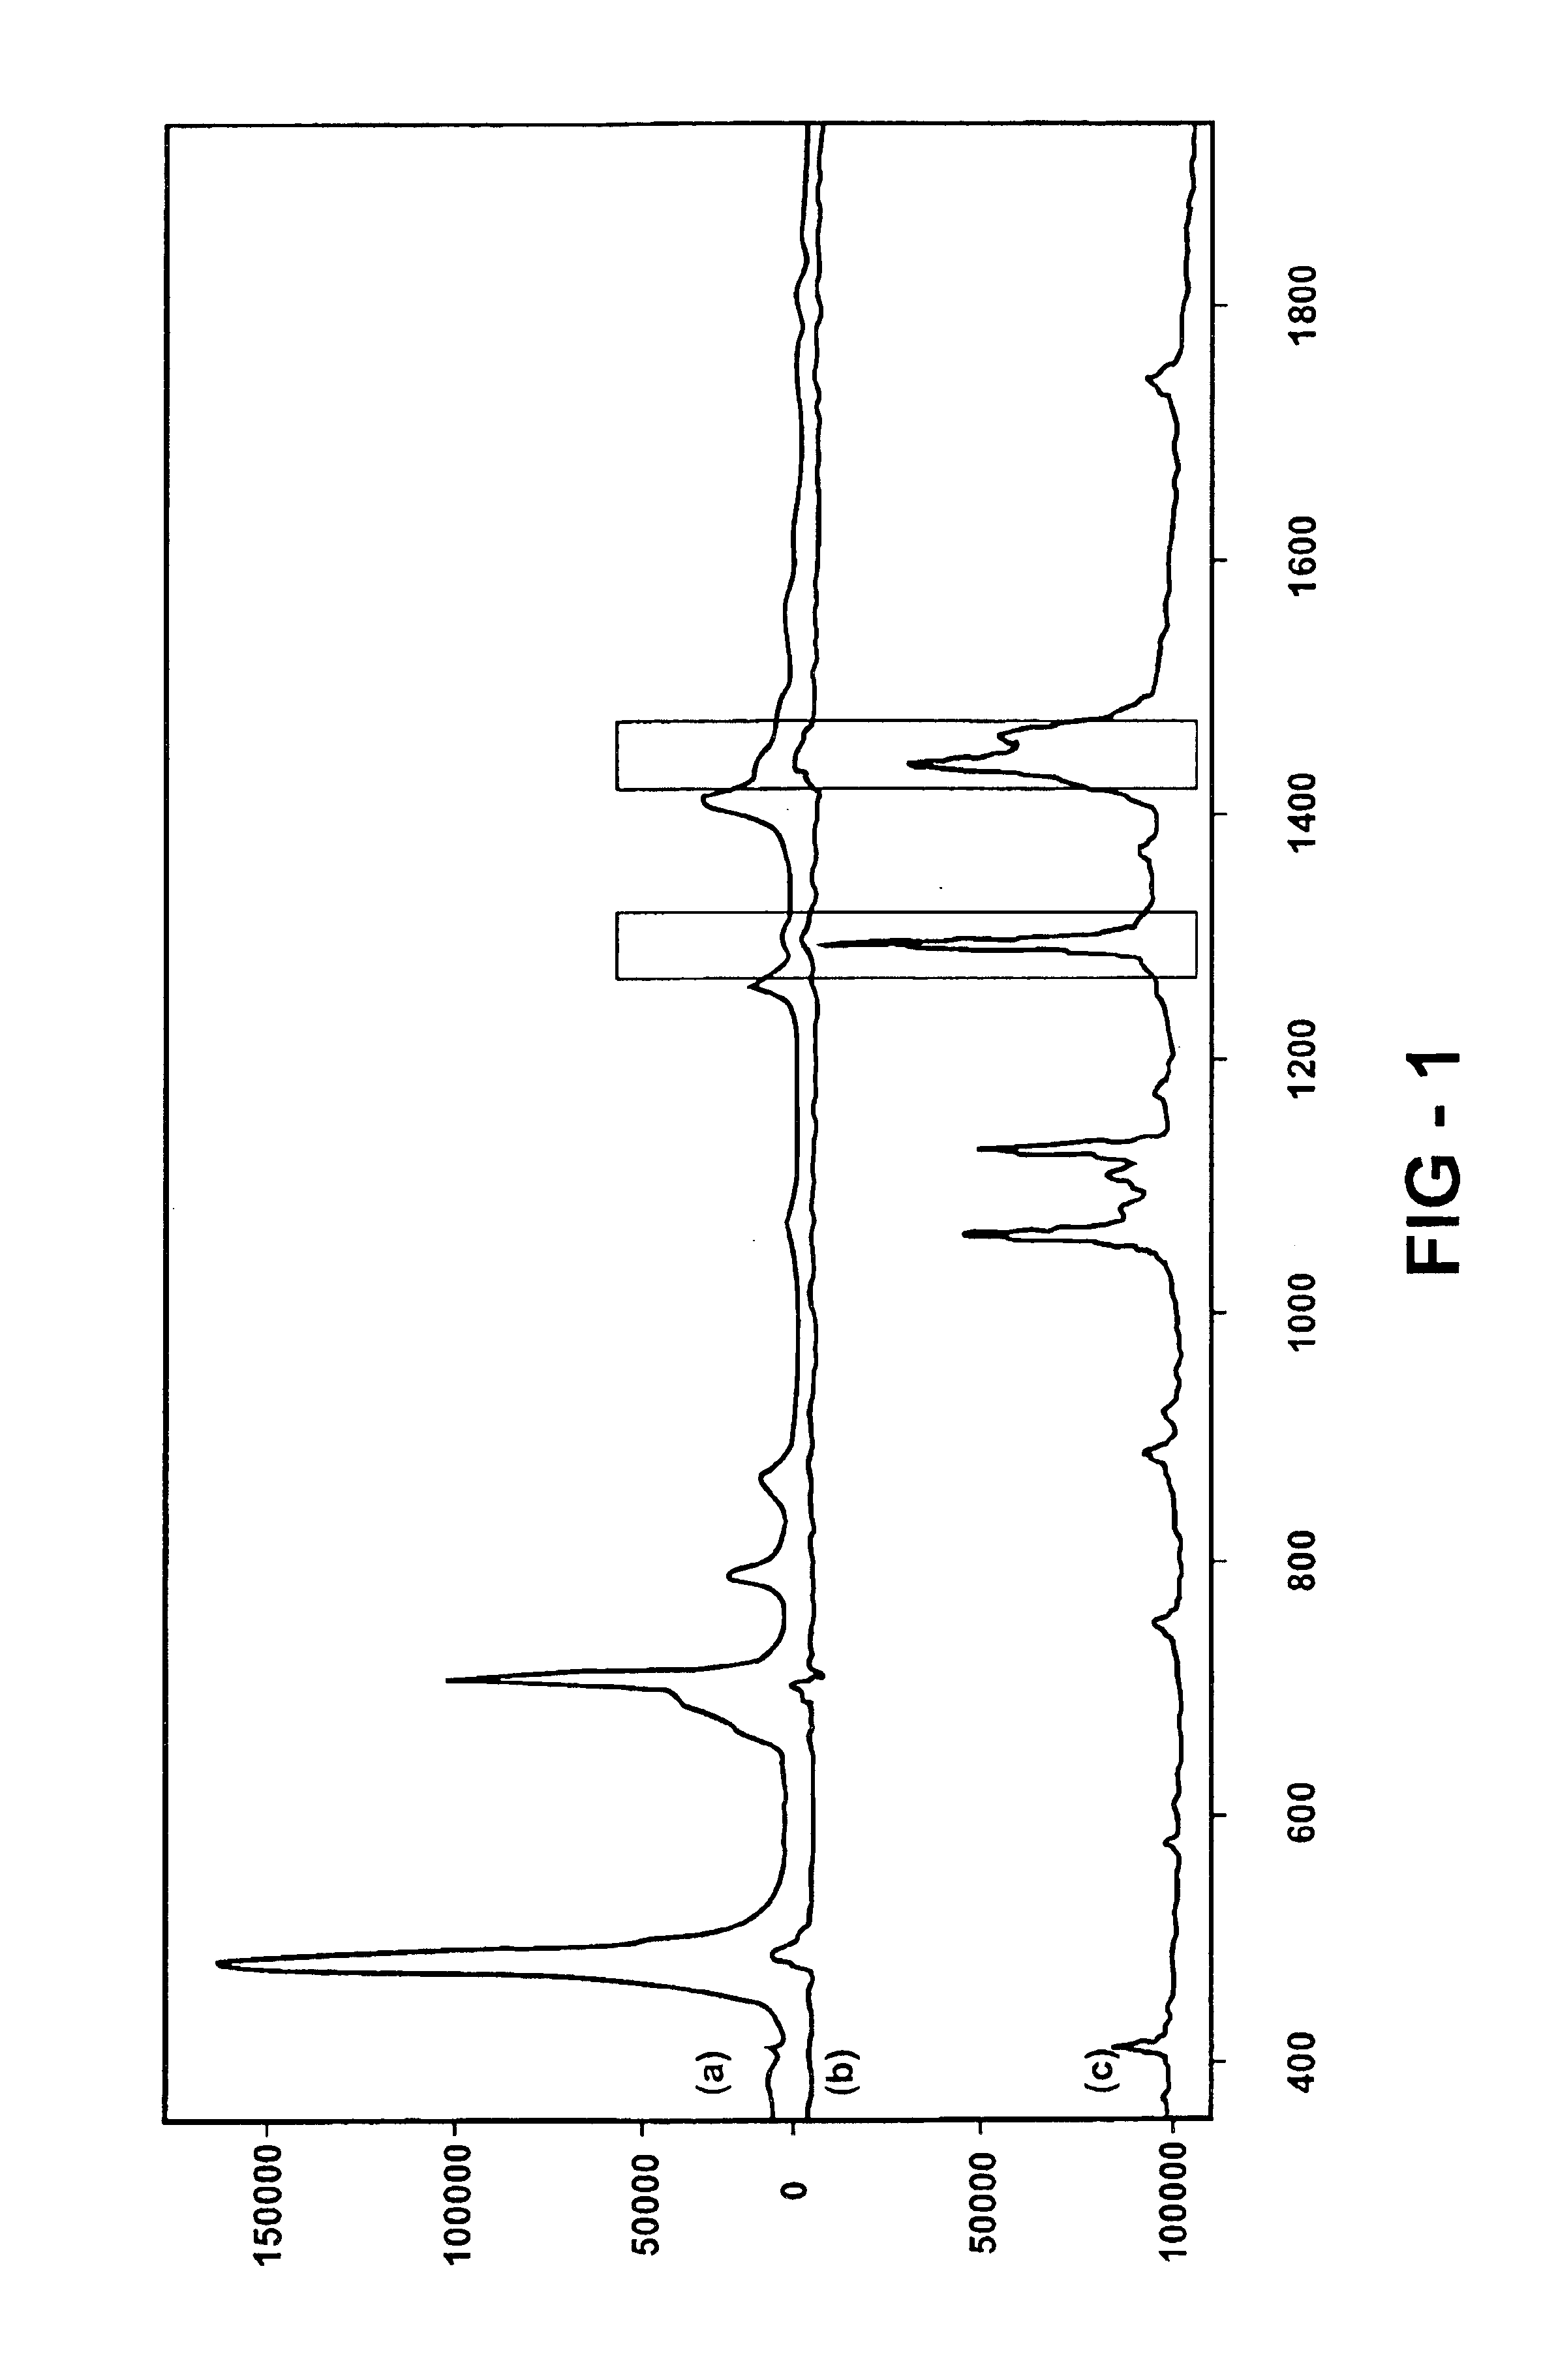
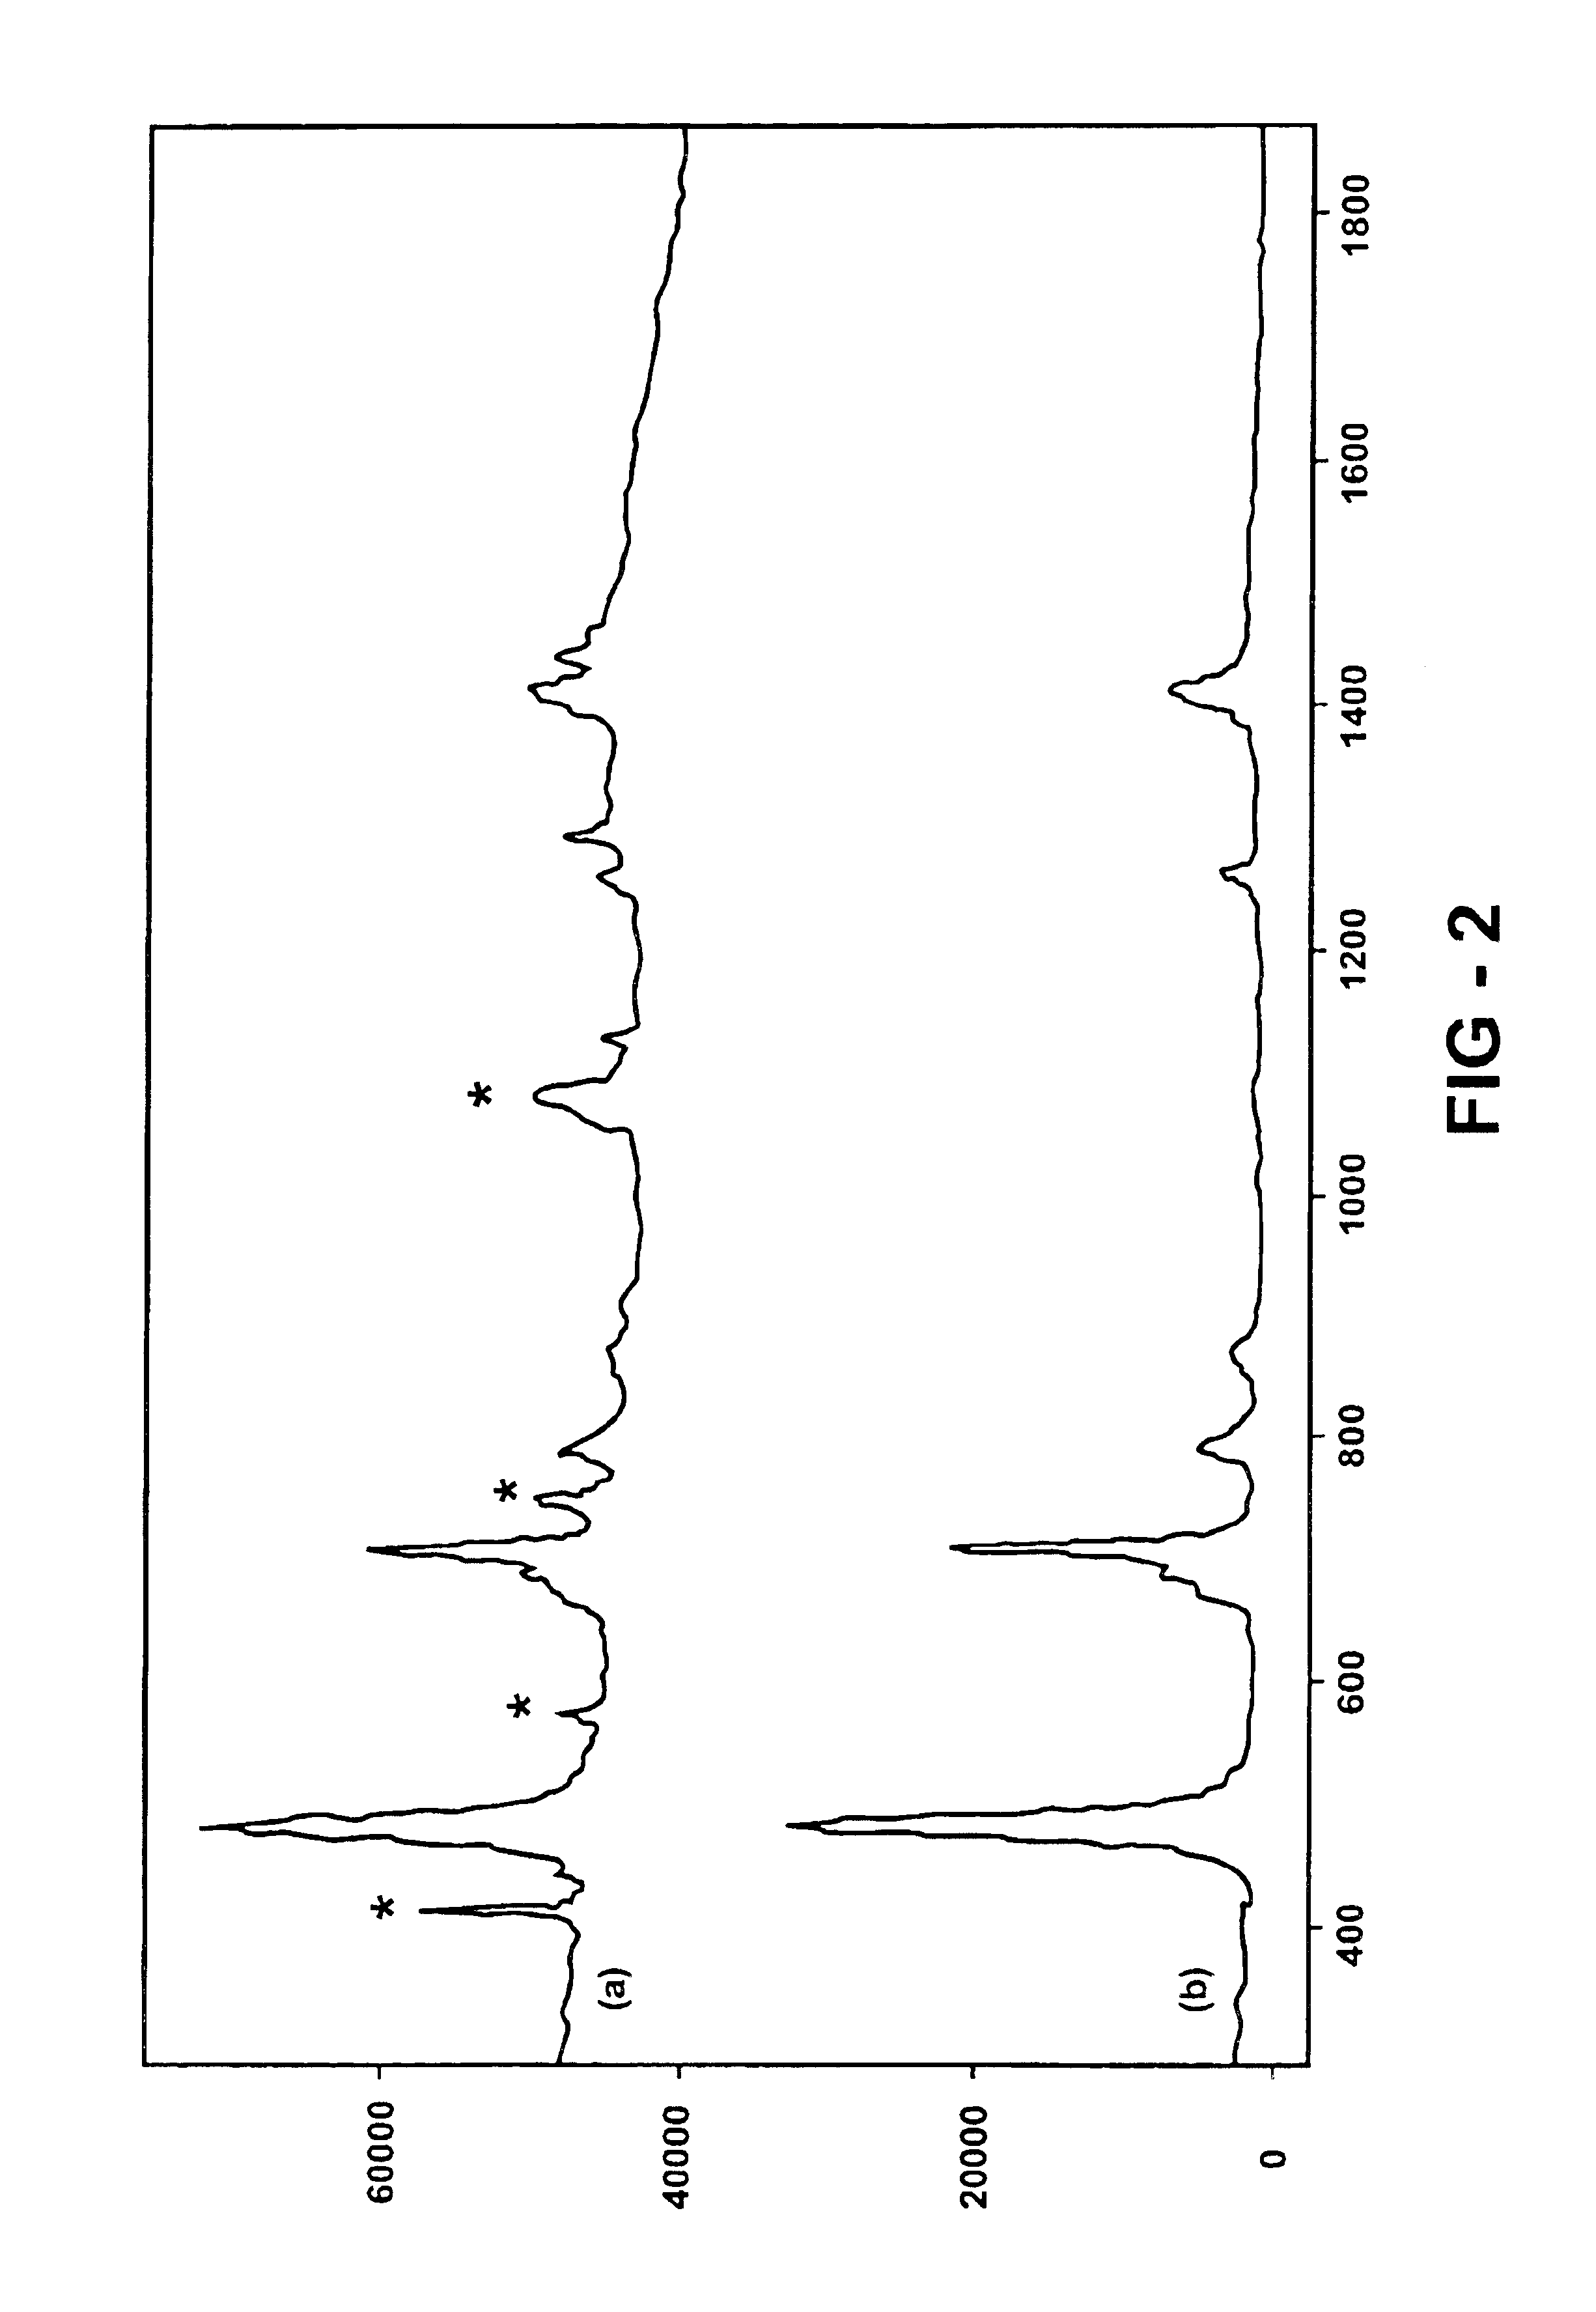
Raman spectra are collected at one minute intervals, with each recorded spectrum being a sum of five spectra each integrated for 10 seconds. The temperature profile is sampled in conjunction with the Raman spectrum collection rate using the reaction calorimeter and thermal controller, as shown in FIG. 4. The Raman spectra of the tribehenin product isolated from the reaction are shown in FIG. 2(a) while that of the solvent is depicted in FIG. 2(b). Those spectral bands of the tribehenin product delineated with an asterisk are associated with the sapphire window of the immersion optic. Integrating baseline subtracted peak area in the C—H stretch region of the tribehenin Raman spectrum from 2730 to 3055 wave numbers following baseline correction as shown in FIG. 3(a) is plotted as a relative intensity as a function of scan number in FIG. 3(b). An increase in integrated peak area is noted most dramatically in spectrum numbers 48-70 and corresponds to pre-nucleation tribehenin-tribehenin...

example 3

The experiment of Example 2 is repeated substituting brassidic anhydride (trans-13-docosanoic anhydride) for tribehenin. Brassidic anhydride is known to form needles upon crystallizing from ethanol and plates upon crystallizing from diethyl ether. The experiment of Example 2 is repeated with brassidic anhydride dissolved in anhydrous ethanol and repeated in anhydrous diethyl ether. Brassidic anhydride has a melting temperature of about 64° Celsius and as such the thermal profiles of Example 2 were reproduced. A comparison of Raman spectra data sets for brassidic anhydride crystallized from ethanol and diethyl ether spectral differences are noted that correlate to the differential cross section of the respective crystalline forms. Where the differential cross section is given by ∂σ∂Ω⁢(Q)=Np⁢Vp2⁡(Δ⁢ ⁢δ)2⁢P⁡(Q)⁢S⁡(Q)+Binc

where Np is the number concentration of scattering bodies (given the subscript “p” for “particles”), Vp is the volume of one scattering body, (Δδ)2 is the square of th...


PUM

PropertyMeasurementUnit
wavelengthaaaaaaaaaa

Abstract

A method of monitoring sample crystallization from a solution. The method includes the collection of multiple Raman spectra from a sample dissolved in a solvent as a function of time and under conditions promoting crystallization. Within each of the multiple Raman spectra, a first signal is identified corresponding to the sample associated with the solvent. A second signal corresponding to the sample in a microcrystallite state is also identified. Thereafter, the intensity of the multiple Raman spectra are measured for an increase relating to formation of the sample in a microcrystallite state. A method of monitoring sample crystallization from a solution as a function of turbidity is also disclosed. The method includes the collection of multiple Raman spectra from a sample dissolved in a solvent as a function of time under conditions promoting crystallization. A decrease in intensity is measured across the multiple Raman spectrum over time, the intensity decrease associated with macroscopic crystallization opacity. The decrease in intensity is finely correlated with the onset of macroscopic crystallization of the sample from the solvent.

Description

FIELD OF THE INVENTIONThe present invention generally relates to a method for monitoring a crystallization process, and in particular to a method of monitoring crystallization with a conventional Raman spectroscopy apparatus.BACKGROUND OF THE INVENTIONMany pharmaceutical and industrial processes rely upon crystallization to assure purity and polymorphic control of a product. Representative of such processes are selective polymorphic crystallization of progesterone and separation of hydrocarbon isomers. For such processes, the attainment of a specified level of purity is desired that does not vary between batches or over time in a continuous production mode. While it is conventional to utilize a turbidity meter to measure the amount of light scattering associated with the progression of crystallization, this has limited applicability owing to the fact that most of the critical events controlling crystallization have already occurred by the time crystallites are of a sufficient size t...

Claims


Application Information

Patent Timeline
Patent Type & Authority Patents(United States)
IPC IPC(8): G01N21/65G01N21/63G01J3/44
CPCG01N21/65G01J3/44
Inventor OWEN, HARRYWELCH, MARKPELLETIER, MICHAEL J.
Owner KAISER OPTICAL SYST INC
Why Eureka
Try Eureka