

Method for gene mapping from chromosome and phenotype data
a technology of applied in the field of gene mapping from chromosome and phenotype data, can solve the problems of affecting the accuracy of the method, the inability to know the effect of real data violations, and the inability to consider association of one region at a tim
- Summary
- Abstract
- Description
- Claims
- Application Information
AI Technical Summary
Benefits of technology
Problems solved by technology
Method used
Image

Examples
example 1
Simulated Data Sets
[0109]We evaluated the performance of the proposed HPM method with simulated data sets that correspond to a recently founded, relatively isolated founder subpopulation. Simulation of a population isolate was chosen, since it is recommended as the study population for LD studies. However, the method can be applied to any population that is suitable for LD analysis, since no assumptions are made about the population structure.
[0110]An isolated founder population which grows from the initial size of 300 to about 100,000 individuals in 500 years was simulated. Each individual was assigned to have one pair of homologous chromosomes. The genetic length of the chromosomes was 100 cM for both males and females. No chiasma interference was modeled. In all microsatellite-marker simulations, the information content (PIC) of each marker was fixed at 0.7, and the markers were spaced at intervals of 1 cM. In the SNP data, marker loci were simulated with a density of 3 markers p...
example 2
Parameters
[0122]We performed extensive gene localization experiments with different parameter values. For a basic setting, within which we compared the performance of the method in different data sets, we selected the following parameter values. The maximum length of haplotype patterns was restricted to seven consecutive markers, which corresponds to segments of 6-8 cM. This is close to the average length of shared haplotypes in a population of about 500 years of age. To allow for reasonable flexibility, at most two gaps were allowed per haplotype, and their lengths were limited to one marker. These parameter values prune patterns which are not biologically conceivable (unreasonably long haplotype patterns, or those consisting mainly of gaps) and, from a practical point of view, they allow faster execution and experimenting with the method than more flexible parameters. With these parameter values, localization time for one simulated data set on a 400-MHz Pentium PC was around one m...
example 3
Localization Accuracy
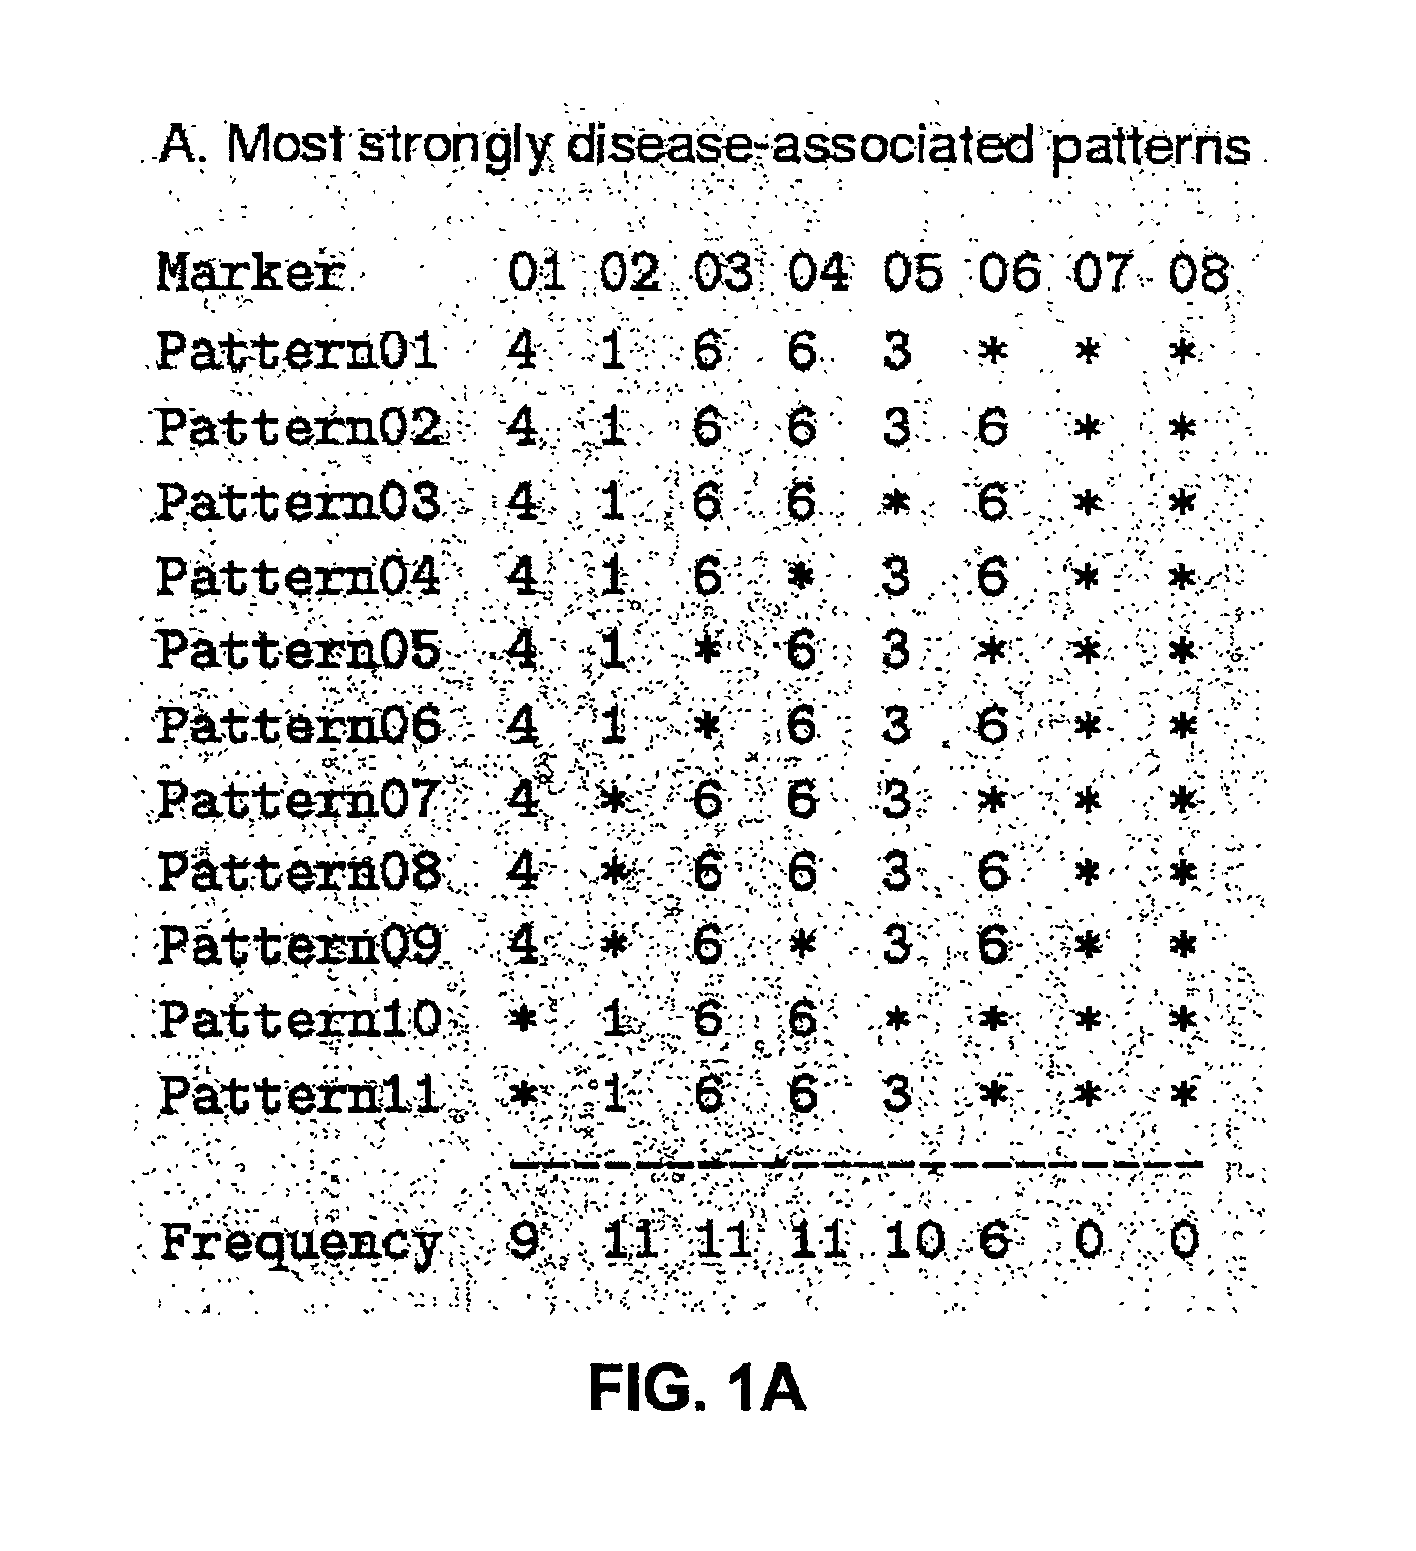
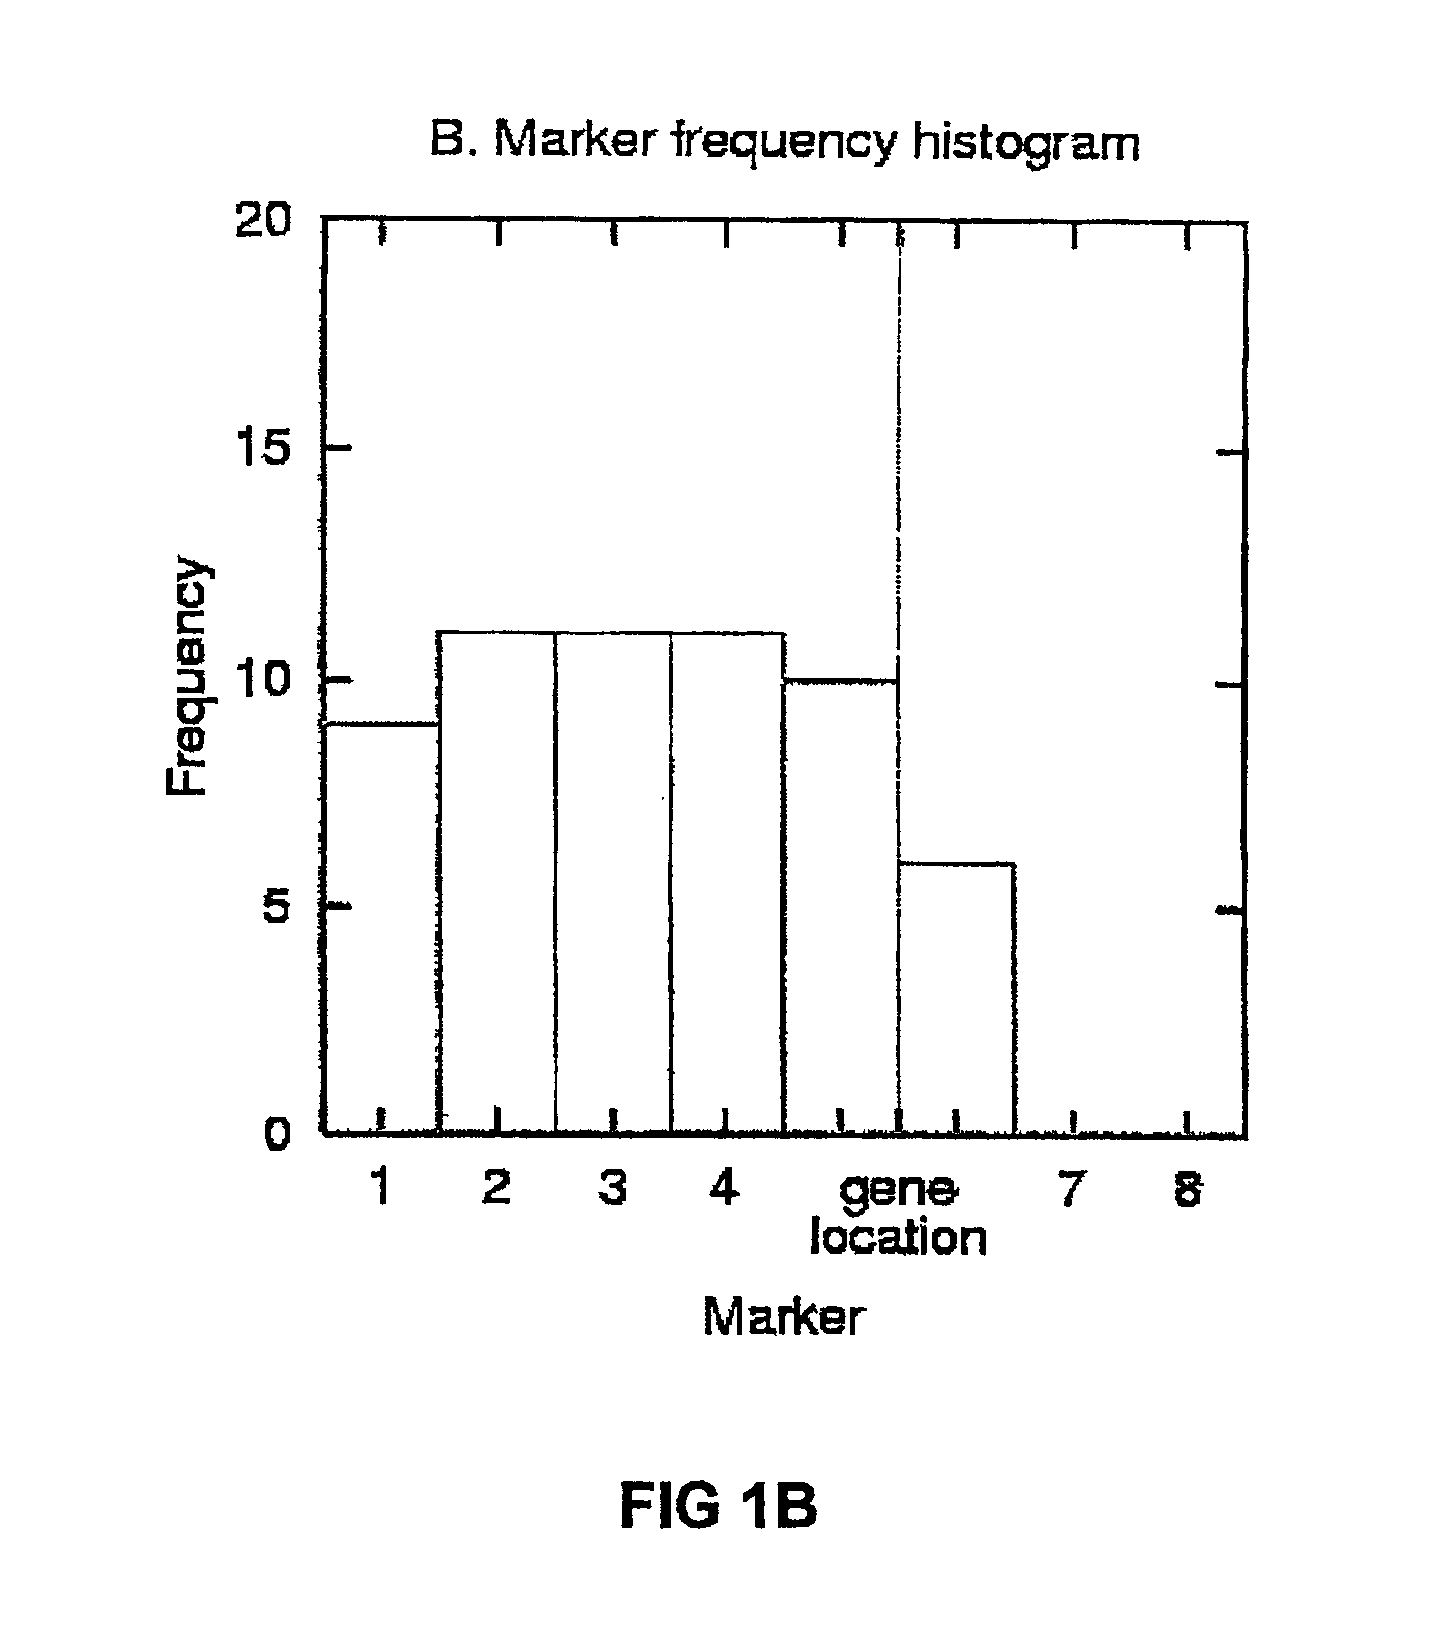
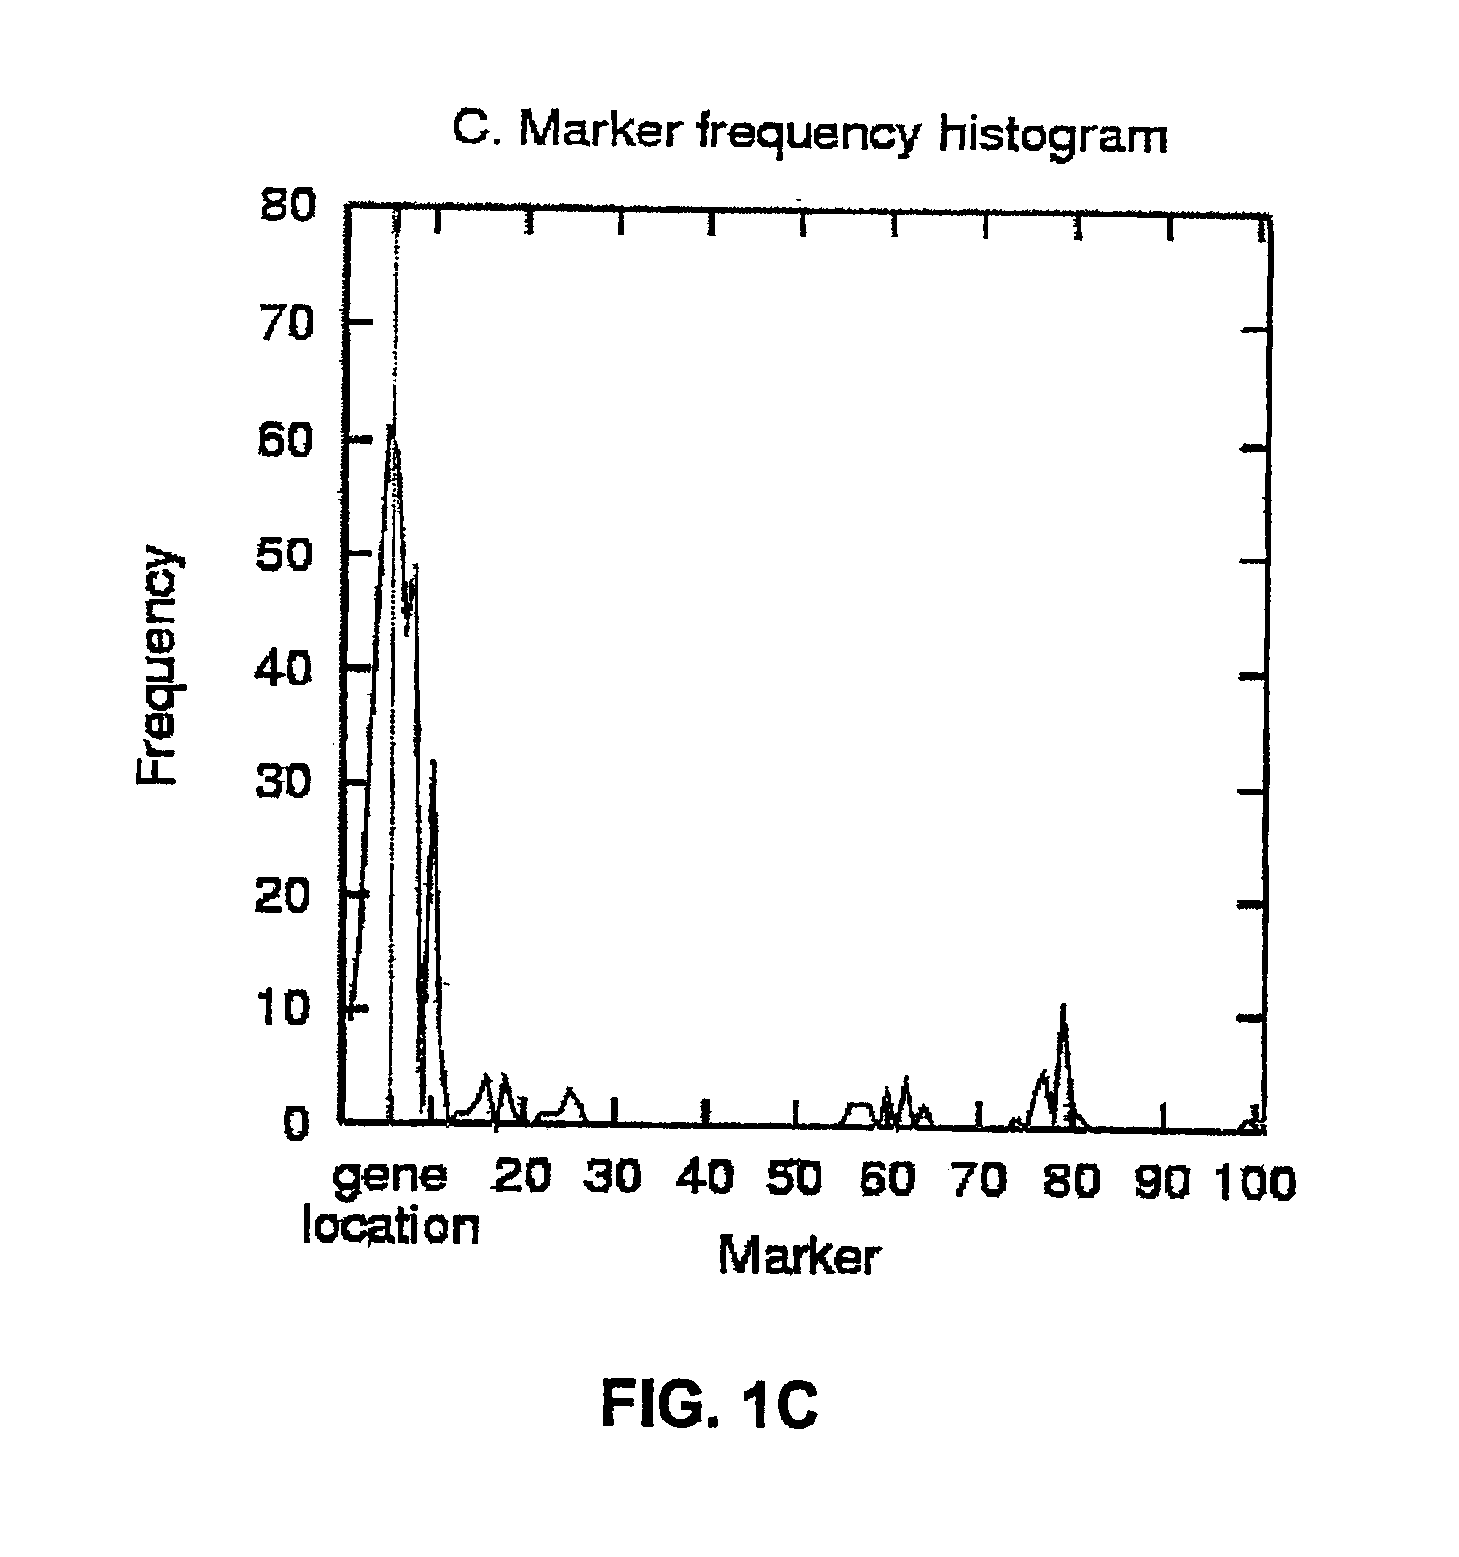
[0123]To illustrate the HPM method, FIG. 1A shows the list of 11 most strongly disease-associated haplotype patterns in a simulated data set with A=10% (10% of disease-associated chromosomes carry the mutation; no missing or corrupted data). The chromosome has 101 markers, but the patterns with strongest association occur between markers 1 and 6. The bottom line gives the marker frequencies for these markers, and the frequencies are also plotted as a histogram in FIG. 1B. Markers 2-4 have the highest frequency, closely followed by markers 5 and 1. The true gene location is in this data set halfway between markers 5 and 6 (depicted by a dashed vertical line). FIG. 1C shows a frequency histogram for the same data set, but this time with all haplotype patterns exceeding the association threshold of 9. Marker 5 has now the highest frequency and is therefore predicted as the gene location; a vertical line shows, again, the true location at position 5.5.
[0124]The true...
PUM
| Property | Measurement | Unit |
|---|---|---|
| Time | aaaaa | aaaaa |
| Time | aaaaa | aaaaa |
| Time | aaaaa | aaaaa |
Abstract
Description
Claims
Application Information