Bio-imaging and information system for scanning, detecting, diagnosing and optimizing plant health

a bio-imaging and information system technology, applied in the direction of luminescent dosimeters, optical radiation measurement, fluorescence/phosphorescence, etc., can solve the problems of plant death, affecting the efficiency of photosynthesis, reducing photosynthetic activity or efficiency, etc., and achieve the effect of accurately measuring the fluorescence intensity-time parameters of plant stress condition

Inactive Publication Date: 2006-09-26
LUSSIER ROBERT
View PDF9 Cites 41 Cited by
  • Summary
  • Abstract
  • Description
  • Claims
  • Application Information

AI Technical Summary

Benefits of technology

[0016]This invention emphasizes new techniques with chlorophyll fluorescence imaging and time-related fluorescence signatures for evaluating plant stress responses and photosynthesis pathways using multi-spectral video imaging with computer-based image, data and information processing. The invention's Chlorophyll Fluorescence Imaging method using sensitive video resolves spatially where the fluorescence emission is maximized on the plant, and processes the pixels at that location to more accurately measure the fluorescence-intensity-time parameters of the plant stress condition.
[0031]It is a further object of this invention to provide management information of the plants in the laboratory / field to optimize photosynthetic efficiency, yield and growth-rate.
[0032]It is a purpose of this invention to define a new method of imaging, quantifying and diagnosing plant stress that achieves the following; 1) the measure of plant health and the early detection of plant stress response from external plant stress stimuli before damage symptoms become visible, 2) the graphical measure of the plant's physiological response to stress that diagnoses the period or time of recoverable early and advanced plant stress damage and of non-recoverable critical or lethal plant stress damage, 3) the imaging and indication of where the plant stress is spatially located on plant leaves, and 4) the imaging and quantification of plant health together with computer processing of management information in the database, enabling the user to manage solutions to improve and optimize plant health, growth and productivity.
[0035]The CFIT method is advantageous in that it images chlorophyll fluorescence emissions to determine spatially where the plant stress is indicated on the leaf, then enables the user to interactively measure at the spatial x-y location in real-time the transient and variable chlorophyll fluorescence, photosynthetic efficiency or the plant's physiological response to plant stress and to diagnose the stages of stress. The invention has the further advantage to enable applications that include image processing, plant stress database and management information systems.

Problems solved by technology

Abnormal increased fluorescence emissions are caused by external plant stress stimuli that decrease photosynthetic activity or efficiency or damage photosynthesis pathways.
This disrupts the photosynthesis process where the yield and quanta of chlorophyll molecules decreases, exacerbating the condition to the Lethal stage with extreme visible symptoms) and causes plant death.
However, these metering methods do not account for fluorescence changes due to the natural variable distribution of chlorophyll fluorescence (located interveinal) or that caused by the plant stress condition.
A limitation of present metering instruments is the inability to spatially locate the varied distributed emission for accurate measurement.
An important limitation of solar passive reflectance is the variation in solar radiation in one location due to atmospheric conditions and / or sun angle and / or that caused by plant orientation.
The plant's diurnal changes due to transpiration in the morning are a cause of additional water stress.
These limitations account for the number of different vegetation indices and relate to the difficulty in correlating a spectral ratio number to the broad range of plant vegetation response.
The measure of low-level chlorophyll fluorescence in the field is difficult in daylight unless the plants or leaf parts are shrouded from ambient light scatter.
However, single number ratios provide no additional information related to the temporal-related values of fluorescence emission to diagnose the plant stress damage stage.

Method used


Image

  • Bio-imaging and information system for scanning, detecting, diagnosing and optimizing plant health
  • Bio-imaging and information system for scanning, detecting, diagnosing and optimizing plant health
  • Bio-imaging and information system for scanning, detecting, diagnosing and optimizing plant health

Examples


Embodiment Construction

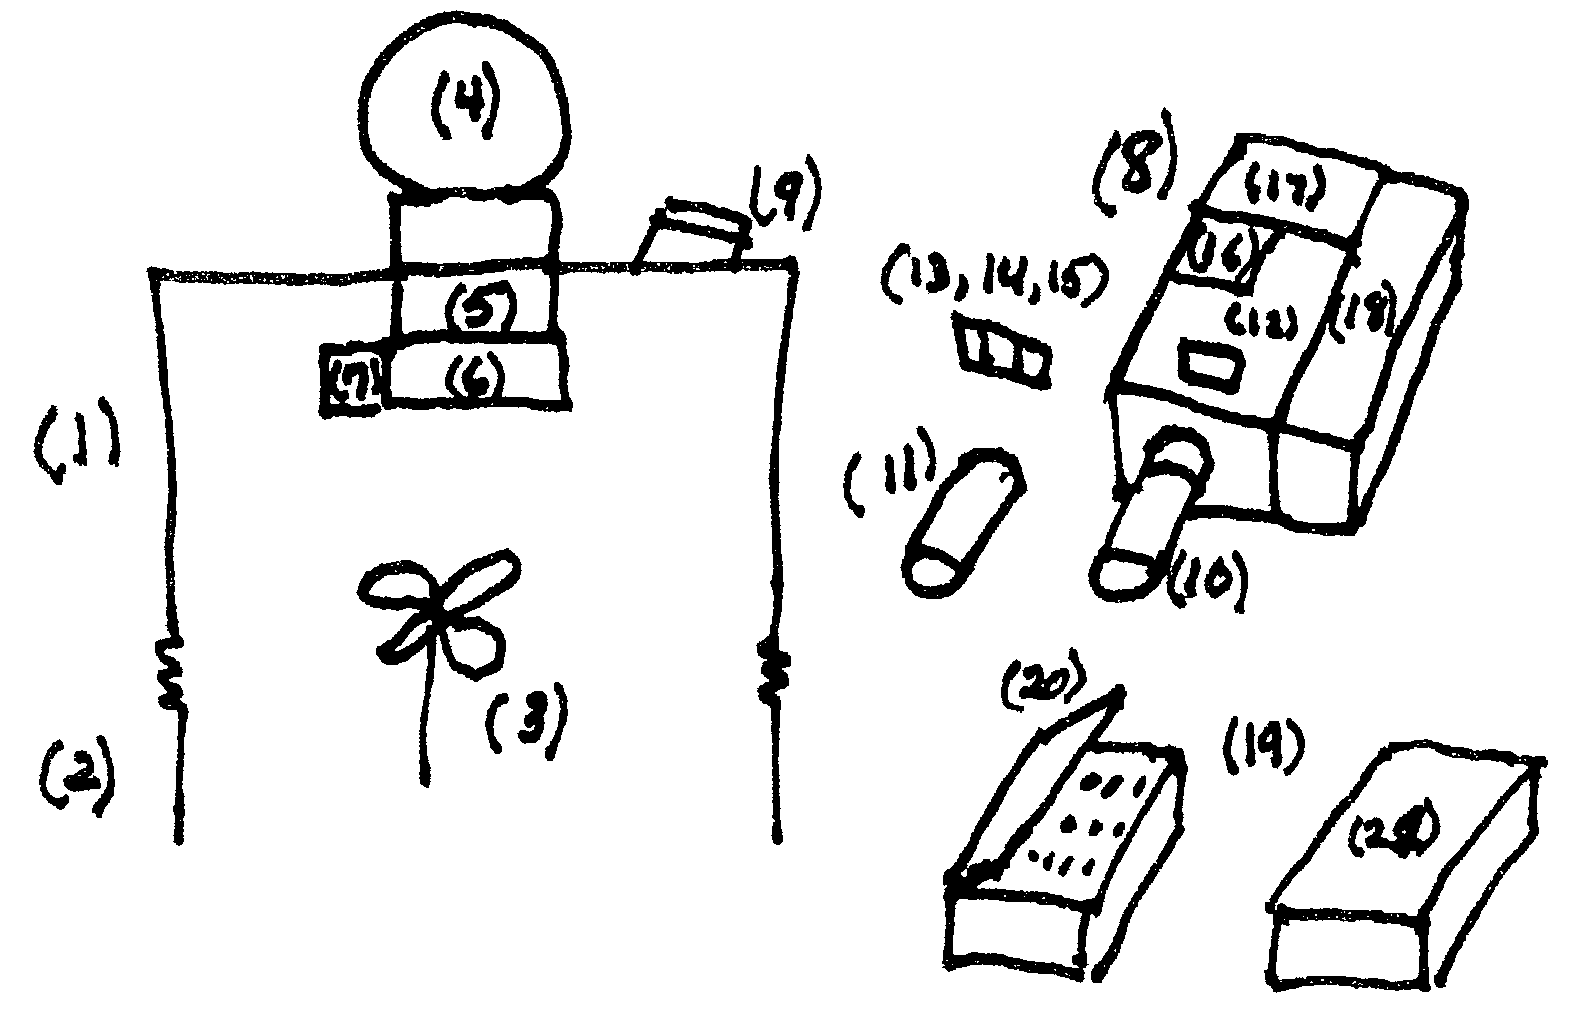
[0042]As shown in FIG. 1, the CFIT System, a closed box (1), is inserted into closed-side extenders (2) to accommodate varying plant height and is placed over the test plant (3) so that the plant has no incident ambient light except for the active light source (4) from either a NUV mercury lamp or a mercury halogen lamp with continuous visible light or from an array of light emitting diodes with blue, and / or blue-green, yellow spectra. The active light source is irradiated on the low-pass-band filters (5) to limit the spectral pass-bands to NUV 230 to 400 or from VIS 400 to 650 nm or from 650 nm to 1100 mm depending on the operation required. The spectral light is obstructed by shutter (6) that is opened by the shutter actuator (7) under control of the computer information processor (19) with embedded control program software to illuminate and control the test program for the plant specimen. The plant's physiological response to any plant stress stimuli that is present or introduced...


PUM

PropertyMeasurementUnit
Fraunhofer wavelengthsaaaaaaaaaa
distanceaaaaaaaaaa

Abstract

A portable Chlorophyll Fluorescence Imaging Time (CFIT) system for use in determining plant health. The system includes an enclosure for placement around a plant to be imaged in-situ. There is a controlled light source that controllably provides to the plant light of a desired wavelength range, to controllably irradiate the plant within the enclosure. The chlorophyll fluorescence emitted from the plant both spatially and temporally is captured, and the captured fluorescence information is analyzed to provide plant health information.

Description

CROSS REFERENCE TO RELATED APPLICATION[0001]This application claims priority of Provisional application Ser. No. 60 / 325,345, filed on Sep. 27, 2001.FIELD OF THE INVENTION[0002]This invention relates to an imaging system for inspecting and determining the status of plant health with the early detection, diagnosis and quantification of plant stress responses that indicate nutrient deficiency or disease in plants from either the environment or from pathogens and in so doing, manages and optimizes the photosynthetic efficiency and growth and yield in plants.BACKGROUND OF THE INVENTION[0003]Plant health and growth is affected by the chlorophyll pigments and their relationship to photosynthesis in plants. Plants are green because the chlorophyll pigments reflect visible green light and absorb blue and red light from the visible light spectrum. The photon absorbed energy is passed on to two photosynthetic reaction centers, Photosystem II (PSII) and Photosystem I (PSI). The photon absorbed ...

Claims


Application Information

Patent Timeline
Patent Type & Authority Patents(United States)
IPC IPC(8): G01N21/64
CPCG01N21/6456G01N21/6486G01N2021/8466G01N2021/635
Inventor LUSSIER, ROBERT
Owner LUSSIER ROBERT
Why Eureka
Try Eureka