Apparatus and method for concentrating and collecting analytes from a flowing liquid stream
- Summary
- Abstract
- Description
- Claims
- Application Information
AI Technical Summary
Benefits of technology
Problems solved by technology
Method used
Image
Examples
example 1
The HPLC-MALDI Interface
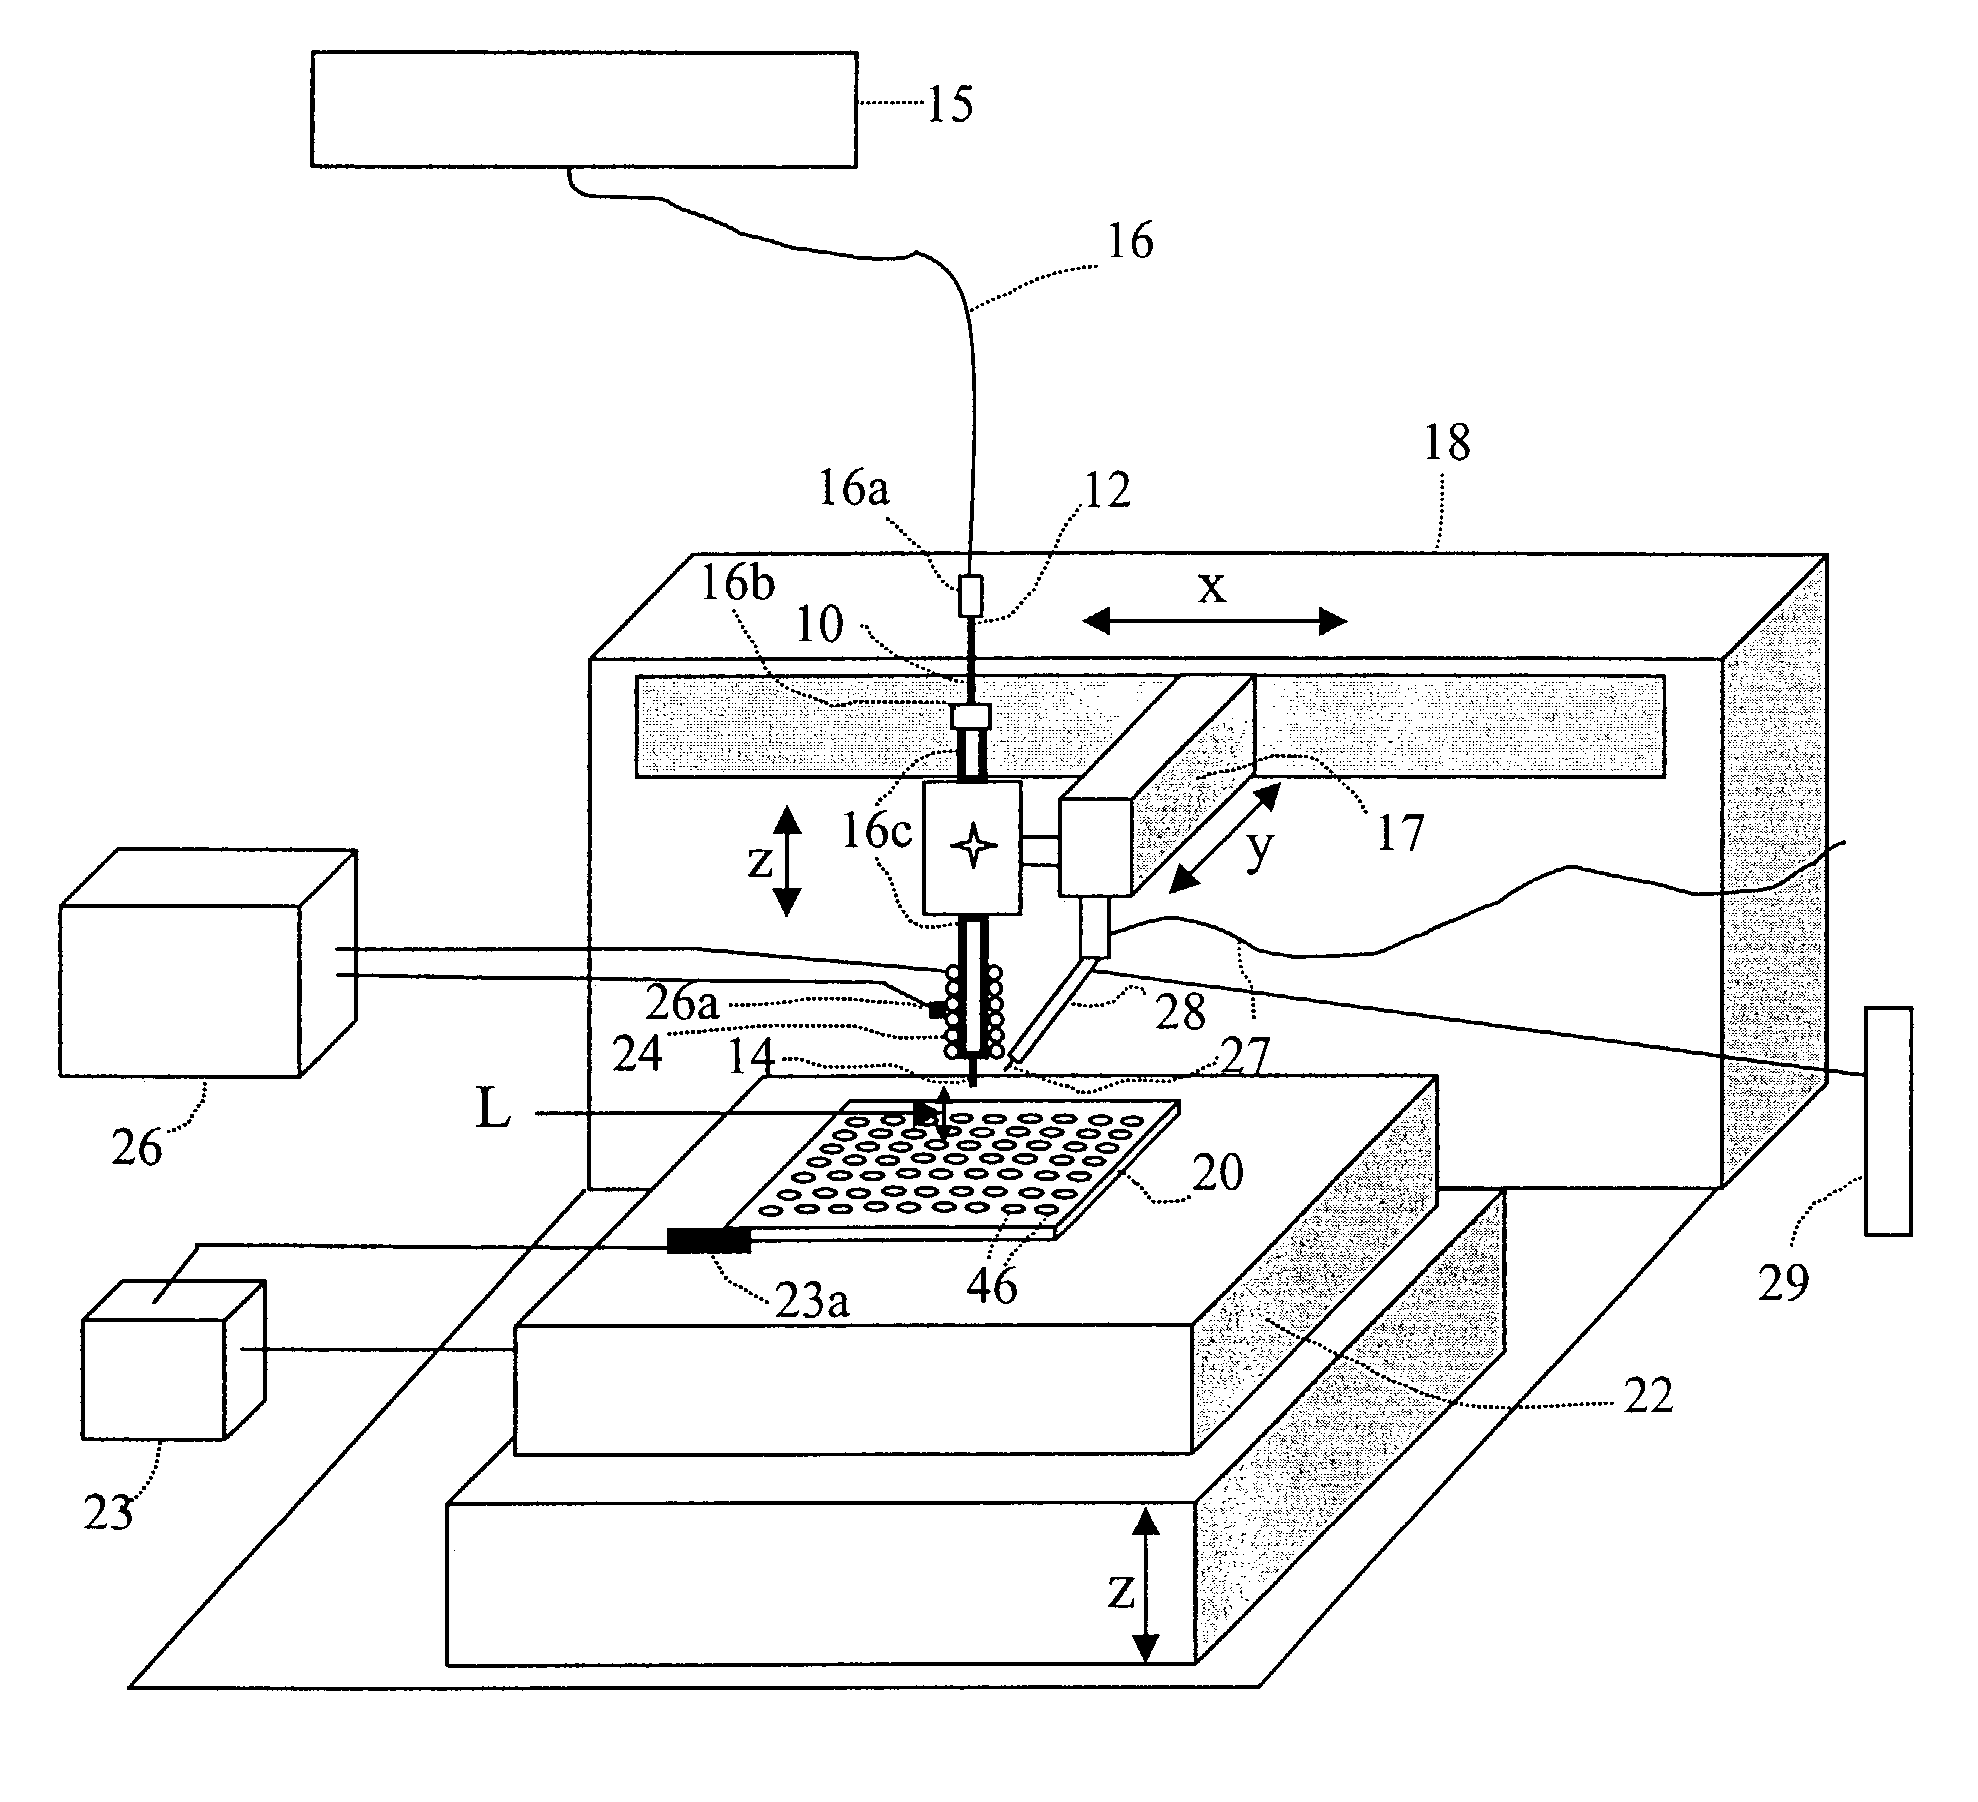
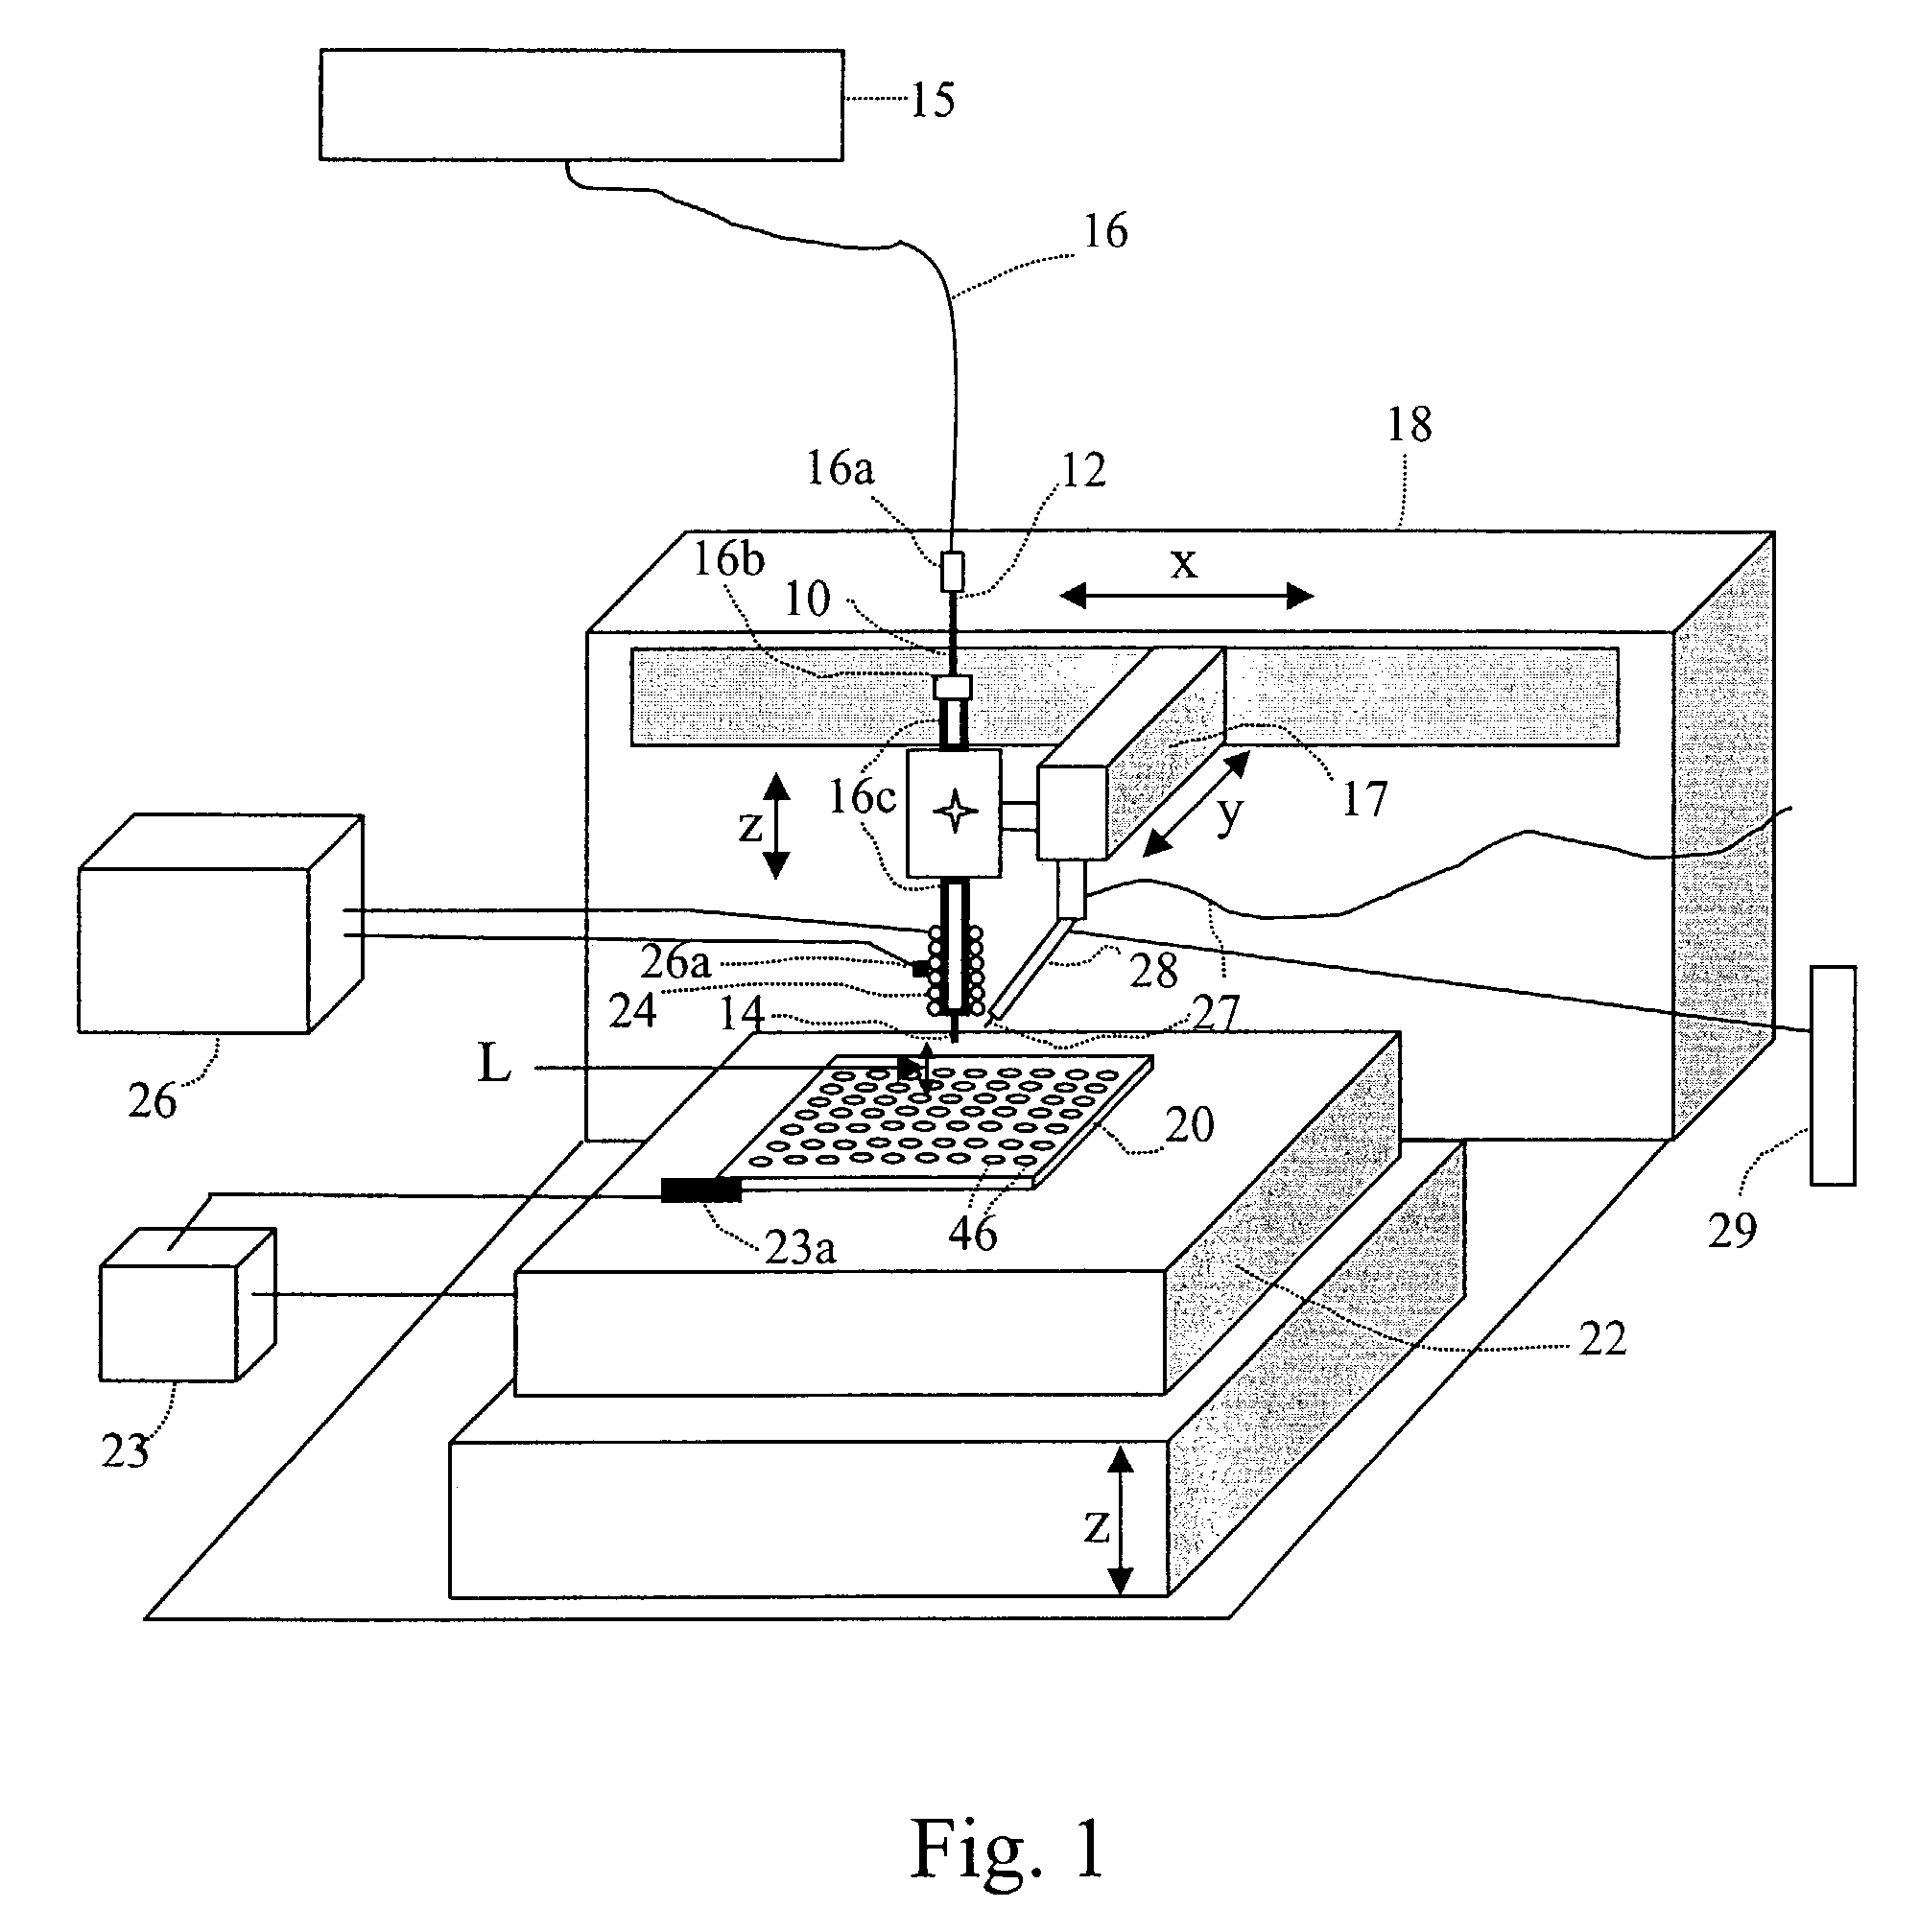
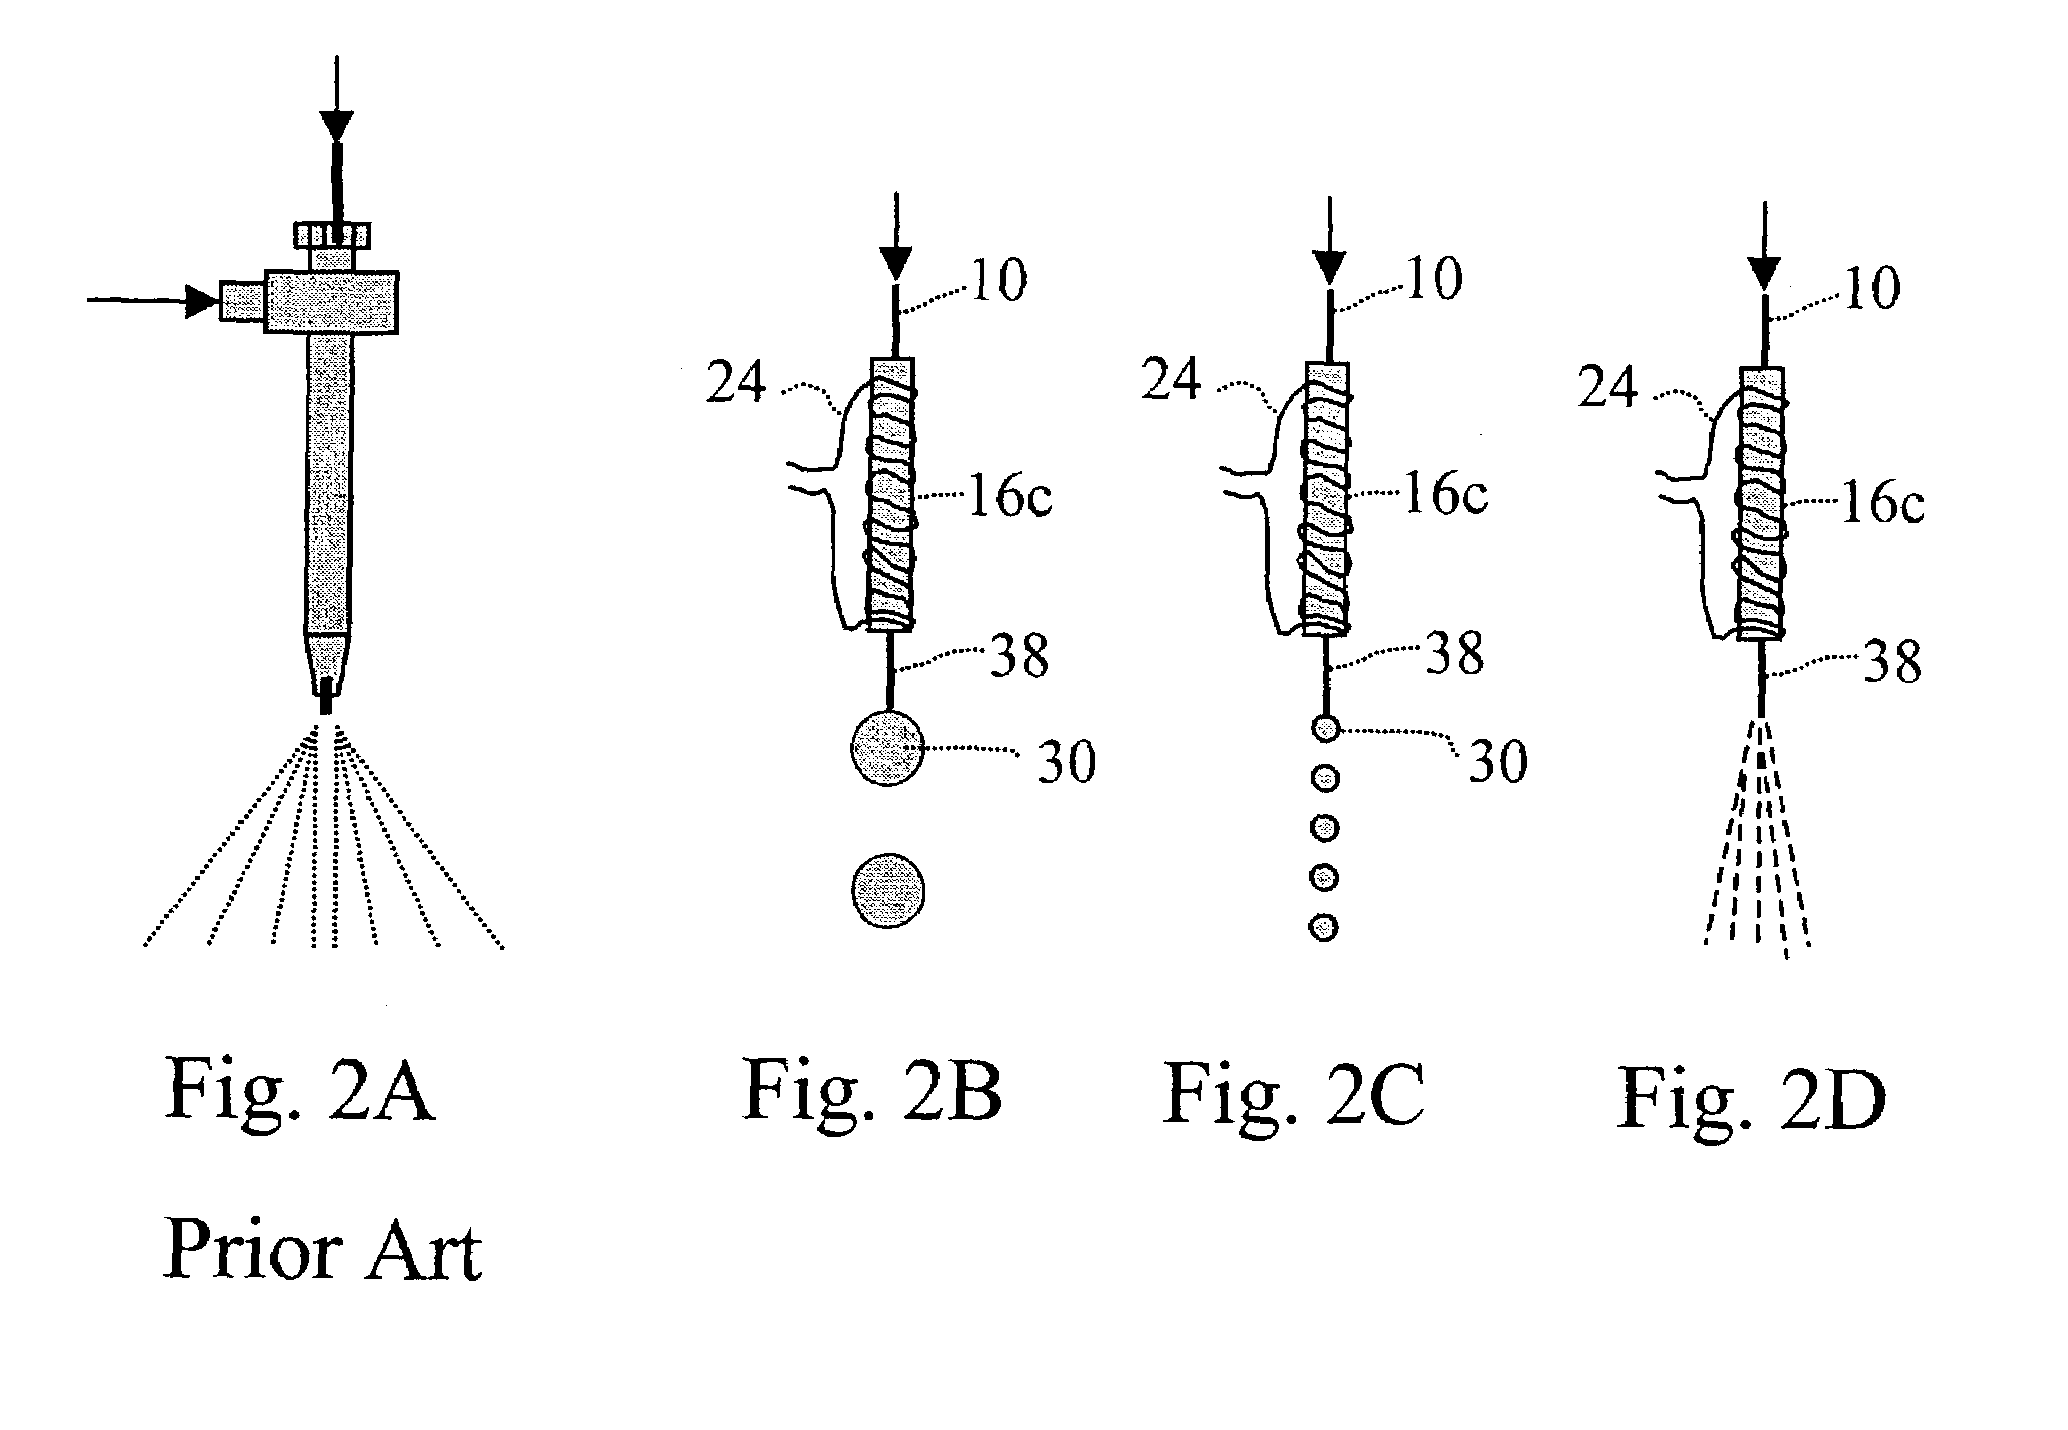
[0086]The extent of heat applied to the transfer tube is adjusted according to the solvent composition of the flow stream and flow rate. An example of temperature settings for the transfer tube is shown below. This experiment was done with a fixed flow rate of 40 μl / min and there was no nitrogen drying gas directed to the hanging droplets. At the carrier solvent composition of 10% acetonitrile and 90% water, the optimal heating coil temperature determined from the thermocouple sensor placed at the midway of the coil (FIG. 3A) was 270° C. The droplet temperature was measured by placing a thermocouple sensor below the transfer tube exit and, when the droplet lands to the sensor a temperature reading was recorded. The average droplet temperature was found to be 52° C. To determine the volume of effluent after the carrier solvent has been evaporated in the interface, the droplets were collected in a vial for 10 min and the solution volume was then measured. It wa...
example 2
Detection Sensitivity of Peptides by Off-Line MALDI-MS
[0090]The detection sensitivity of the HPLC-MALDI interface was demonstrated from the analysis of a dilute peptide mixture. The standard peptide mixture contained 1 ng / μl of each of the following: human angiotensin II, bradykinin, and Luteinizing Hormone-Releasing Hormone (LHRH) was diluted 1000 times with MilliQ water to a dilute peptide mixture contained 1 pg / μl of each peptide (about 1 fmol / μl). Either 20 μl, or 5 μl of said peptide mixture was subjected to RP-HPLC separation on a 0.3 mm I.D. C8 RP-HPLC column at a flow rate of 6 μl / min. The effluent was monitored by the integrated UV detector (214 nm) of the Agilent 1100 HPLC system. The effluent was then interfaced to the transfer tube and collected on the custom-built stainless steel target in 1-min fractions. FIG. 6A displays the UV trace between 27 min to 33 mm following injection of a 20-μl peptide mixture, and FIG. 6C is the corresponding UV trace at the same time inter...
example 3
Dynamic Range Test
[0091]The detection of a minor peptide component in the presence of high concentration of other components can be a challenging task. Although MALDI-TOF-MS is suitable for the analysis of complex mixtures, it is susceptible to ion suppression effects, which result in reduced detection sensitivity for minor components of the mixture. This effect was demonstrated in FIG. 7, which displays that direct MALDI-MS analysis of substance P (the minor component) in the presence of increasing amounts of Adrenocorticotropic Hormone (ACTH) 18-39. As shown in FIG. 7A, substance P (m / z at 1347, along with the oxidized derivative at m / z 1363) was easily detected by direct MALDI-TOF-MS in a ten-fold mole excess of ACTH 18-39. The substance P peak was still clearly seen at 100-fold excess of ACTH (FIG. 7B). However, at a 1000-fold excess of ACTH 18-39, the signal for substance P was totally suppressed (FIG. 7C). Even at higher loadings of 21 or 100 fmol of substance P (FIGS. 7D and ...
PUM
 Abstract
Description
Claims
Application Information
 - R&D
- Intellectual Property
- Life Sciences
- Materials
- Tech Scout
- Unparalleled Data Quality
- Higher Quality Content
- 60% Fewer Hallucinations
Browse by: Latest US Patents, China's latest patents, Technical Efficacy Thesaurus, Application Domain, Technology Topic, Popular Technical Reports.
© 2025 PatSnap. All rights reserved.Legal|Privacy policy|Modern Slavery Act Transparency Statement|Sitemap|About US| Contact US: help@patsnap.com


