Multiphase fluid characterization

a technology of fluid characterization and multiphase, which is applied in the direction of liquid/fluent solid measurement, specific gravity measurement, instruments, etc., can solve the problems of insufficient efficiency of such separators in achieving two pure streams of oil and water, water has no value, and becomes a disposal or environmental problem, etc., to achieve accurate determination of aqueous phase fraction, improve water percentage determination of crude petroleum oil, and reduce uncertainty

Active Publication Date: 2009-04-28
PHASE DYNAMICS
View PDF11 Cites 34 Cited by
  • Summary
  • Abstract
  • Description
  • Claims
  • Application Information

AI Technical Summary

Benefits of technology

[0011]Accordingly, the use of rapid on-line instruments such as densitometers, capacitance probes, radio frequency probes, and microwave analyzers to measure water content of petroleum products is becoming more common. In addition to providing increasingly accurate determinations of water content, real time water content results via on-line methods can provide beneficial operational advantages. Knowledge of when water becomes present in petroleum as it is being produced and the magnitude of the quantity of the water may provide an opportunity to remove the water before it reaches a transport pipeline, storage vessel, or shipping tanker. Additionally, the real time data may show if the water is detected in several short periods of time or if it is present across the entire load of the petroleum. Furthermore, real time analyzers may be used as a comparison to the results provide by composite samplers. Finally, on-line measurements of, for example, physical and electrical properties, via instrumentation reduces the need human involvement in the process of characterizing a multiphase fluid mixture.
[0051]Some of the disclosed inventions provide near-real-time reduction of errors and supply more accurate results to aid in near-real-time decision-making or automatic flow diversion, without requiring oil stream sampling or off-line lab-work conducted on such samples and thus eliminating the cost, lost opportunities, and hazards associated with such sampling.BRIEF DESCRIPTION OF THE DRAWINGS

Problems solved by technology

When water is pumped to the surface of the Earth along with crude petroleum oil, producers often attempt to physically separate the water from the oil, because the water can corrode pipes and damage down-stream processing equipment.
Further, the water has no value relative to the oil and in-fact can become a disposal or environmental problem wherever it is finally removed.
However, the efficiency of such separators in achieving two pure streams of oil and water is often not 100%, and free water is still frequently entrained in the crude petroleum oil as it enters storage, in the range of about 0.10% to about 5%.
The distillation and titration methods are relatively accurate, but are plagued by long analysis times and not suitable for use in the field or at the point of sale.
The centrifuge method is quicker, but almost always under-reports the amount of water present.
The American Society for Testing of Materials has reported the standard analytical errors for water content measurements using the three methods.
Note that composite petroleum samplers and the associated analytical methods have other kinds of problems and disadvantages other than, for example, meeting a desired accuracy for a given determination.
Additionally, the exposure of personnel to hazardous liquids associated with processing the samples is undesirable.
Further, the water encountered in oil well production is most often saline.
Thus, both the densitometer method (“WC by density”) and the permittivity method (“WC by permittivity”) are subject to uncertainties.
This assumption results in a maximum error rate of about 0.23% at about 5% WC.
Still further uncertainty in conducting characterizations of multiphase fluids such as crude petroleum oil can be caused by both the physical chemistry of each of the fluids and the multiphase fluid mixture itself.
Stratification of a lot of crude petroleum oil can lead to sampling difficulties.
Mixing of large volumes of stratified crude petroleum oil, say 4.1 million barrels contained in an ocean-going supertanker is impractical.
Auto-sampling of such stratified volumes is usually done, but with the attending problems as previously described, the least of which is not the fact that samples can get lost, destroyed, spilled, or consumed during repeat testing.
Thus, if one does not know the history of the multiphase fluid undergoing dispersion or emulsification, one will not always be able to predict the “state” of the dispersion or emulsion, i.e. which phase is continuous and which is dispersed, even if the proportions of the phases are accurately known at a particular point in time.
Additionally, further variations in the conductivity of the aqueous or water continuous phase caused, for example, by even relatively small changes in salinity, can significantly affect the measured permittivity results.
Such complex physical chemistry leads to numerous uncertainties with regards to permittivity-based composition determinations.

Method used


Image

  • Multiphase fluid characterization
  • Multiphase fluid characterization
  • Multiphase fluid characterization

Examples


example 1

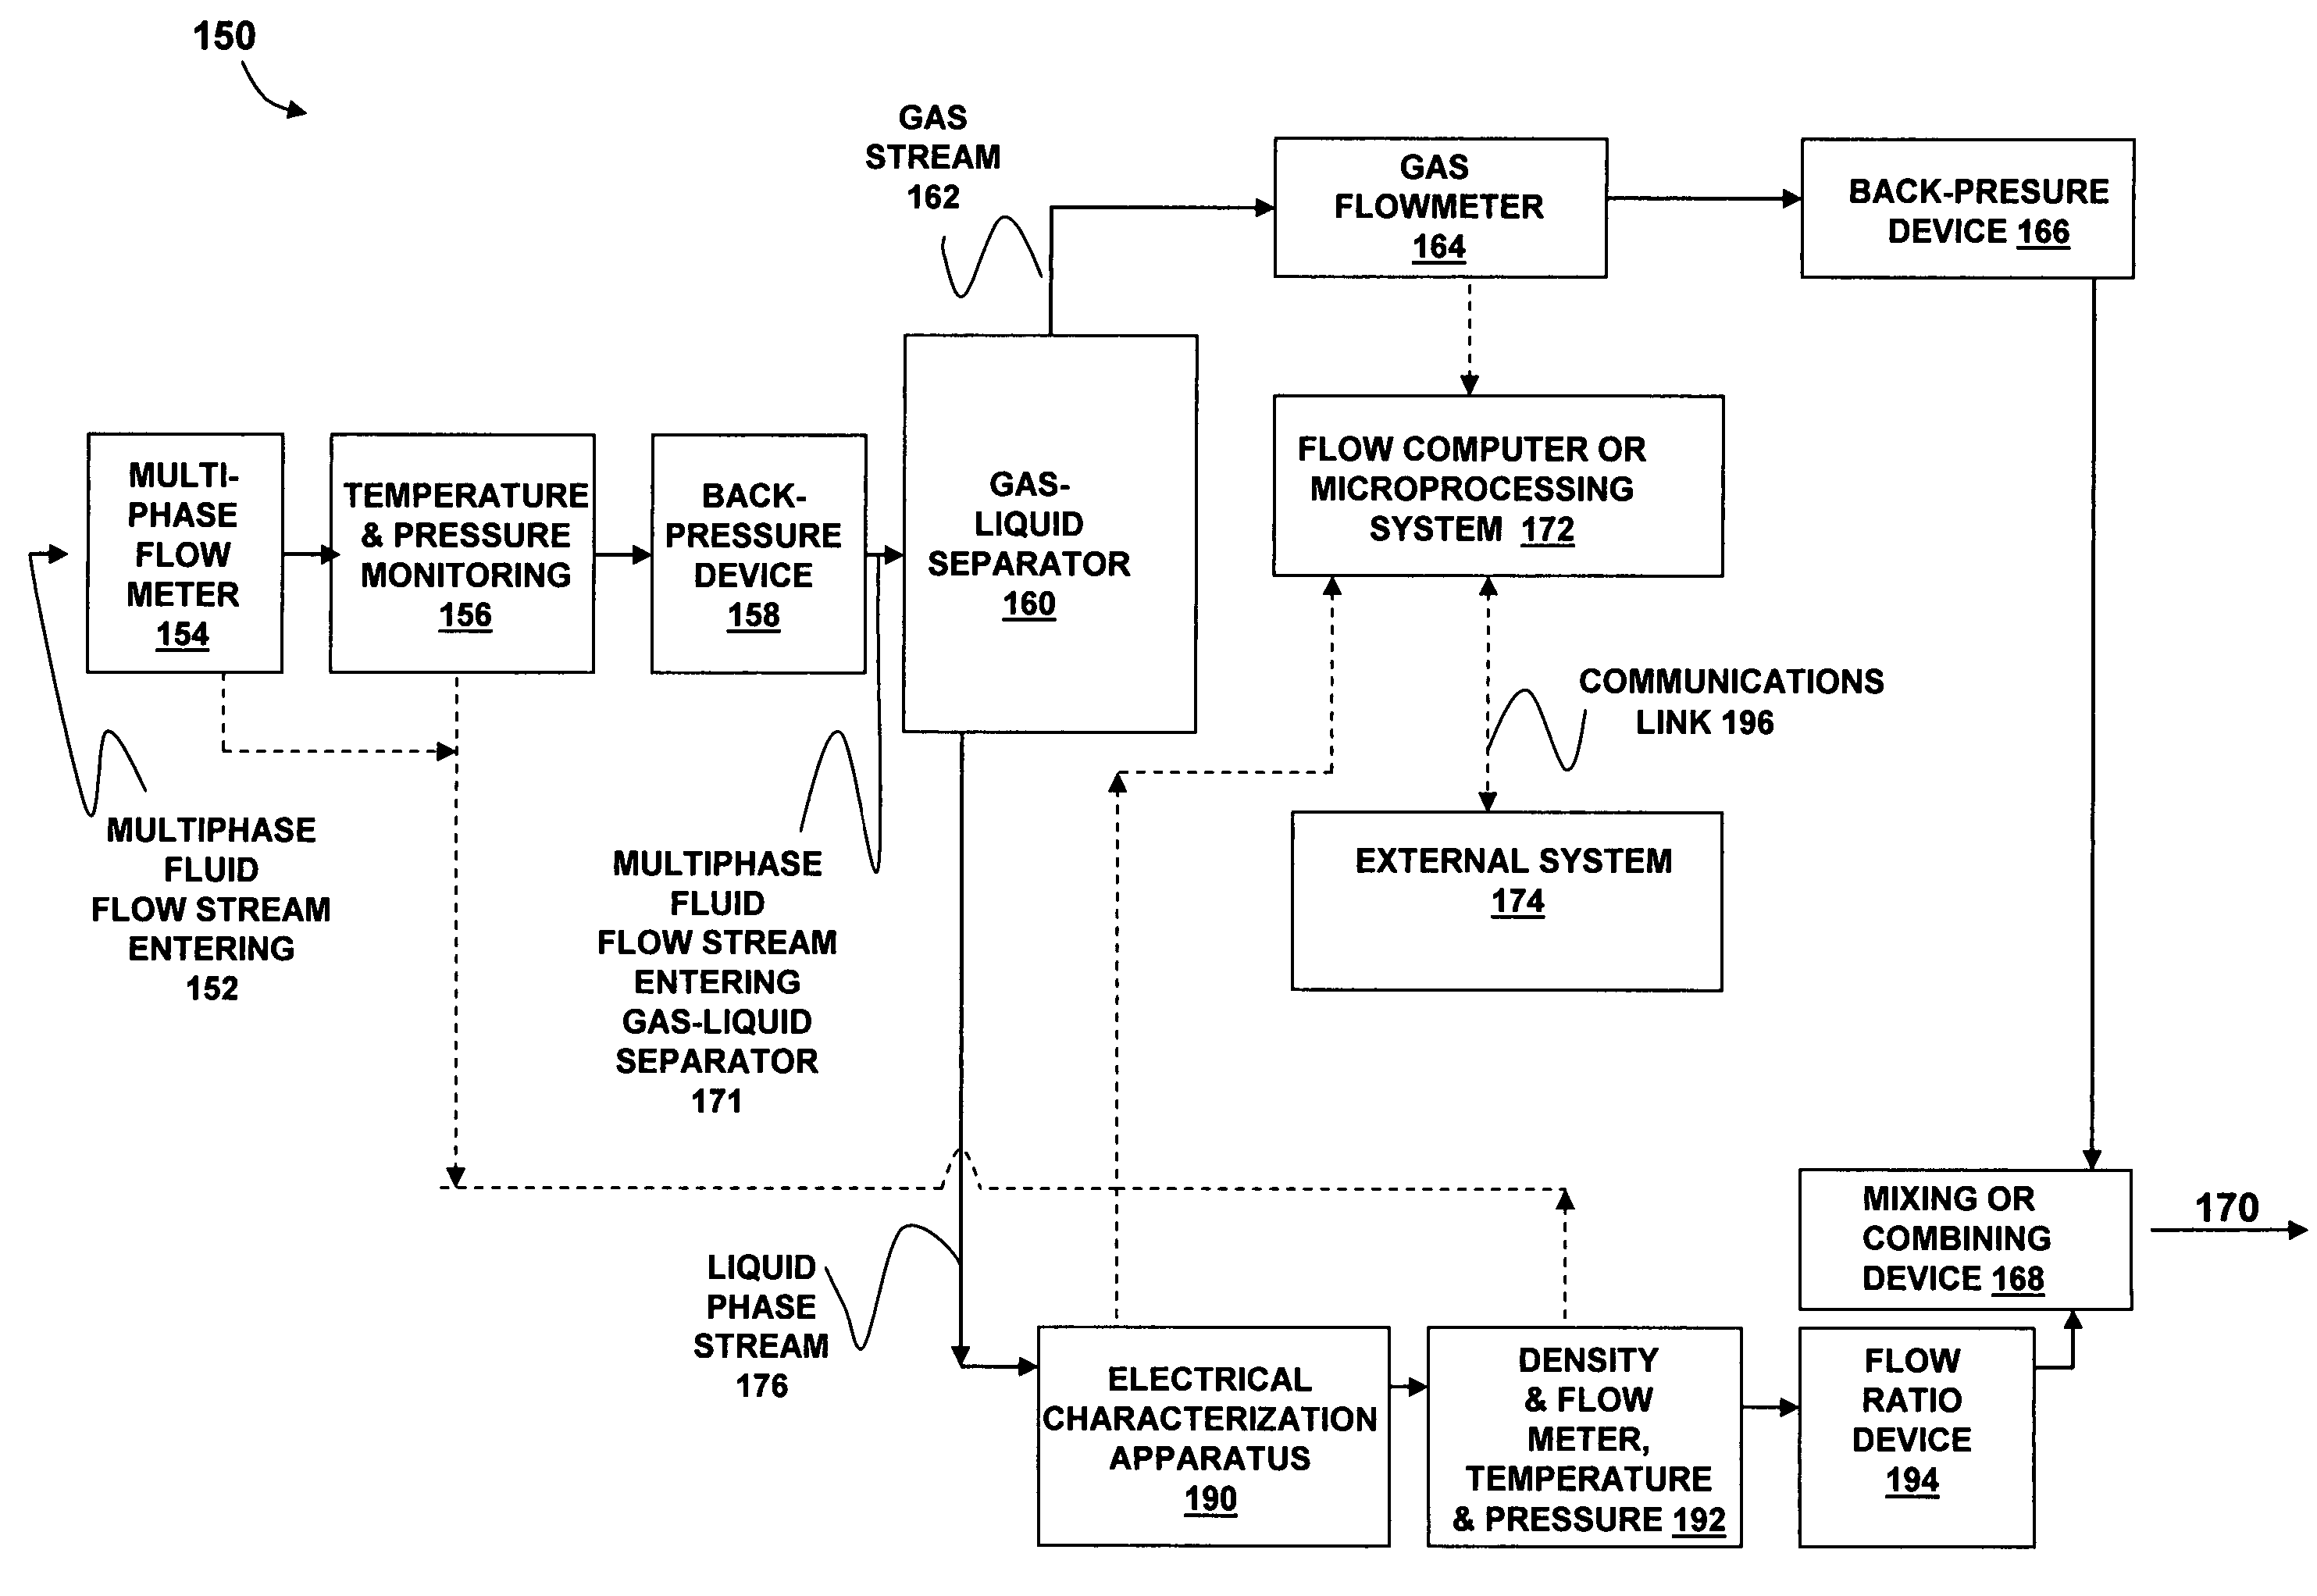
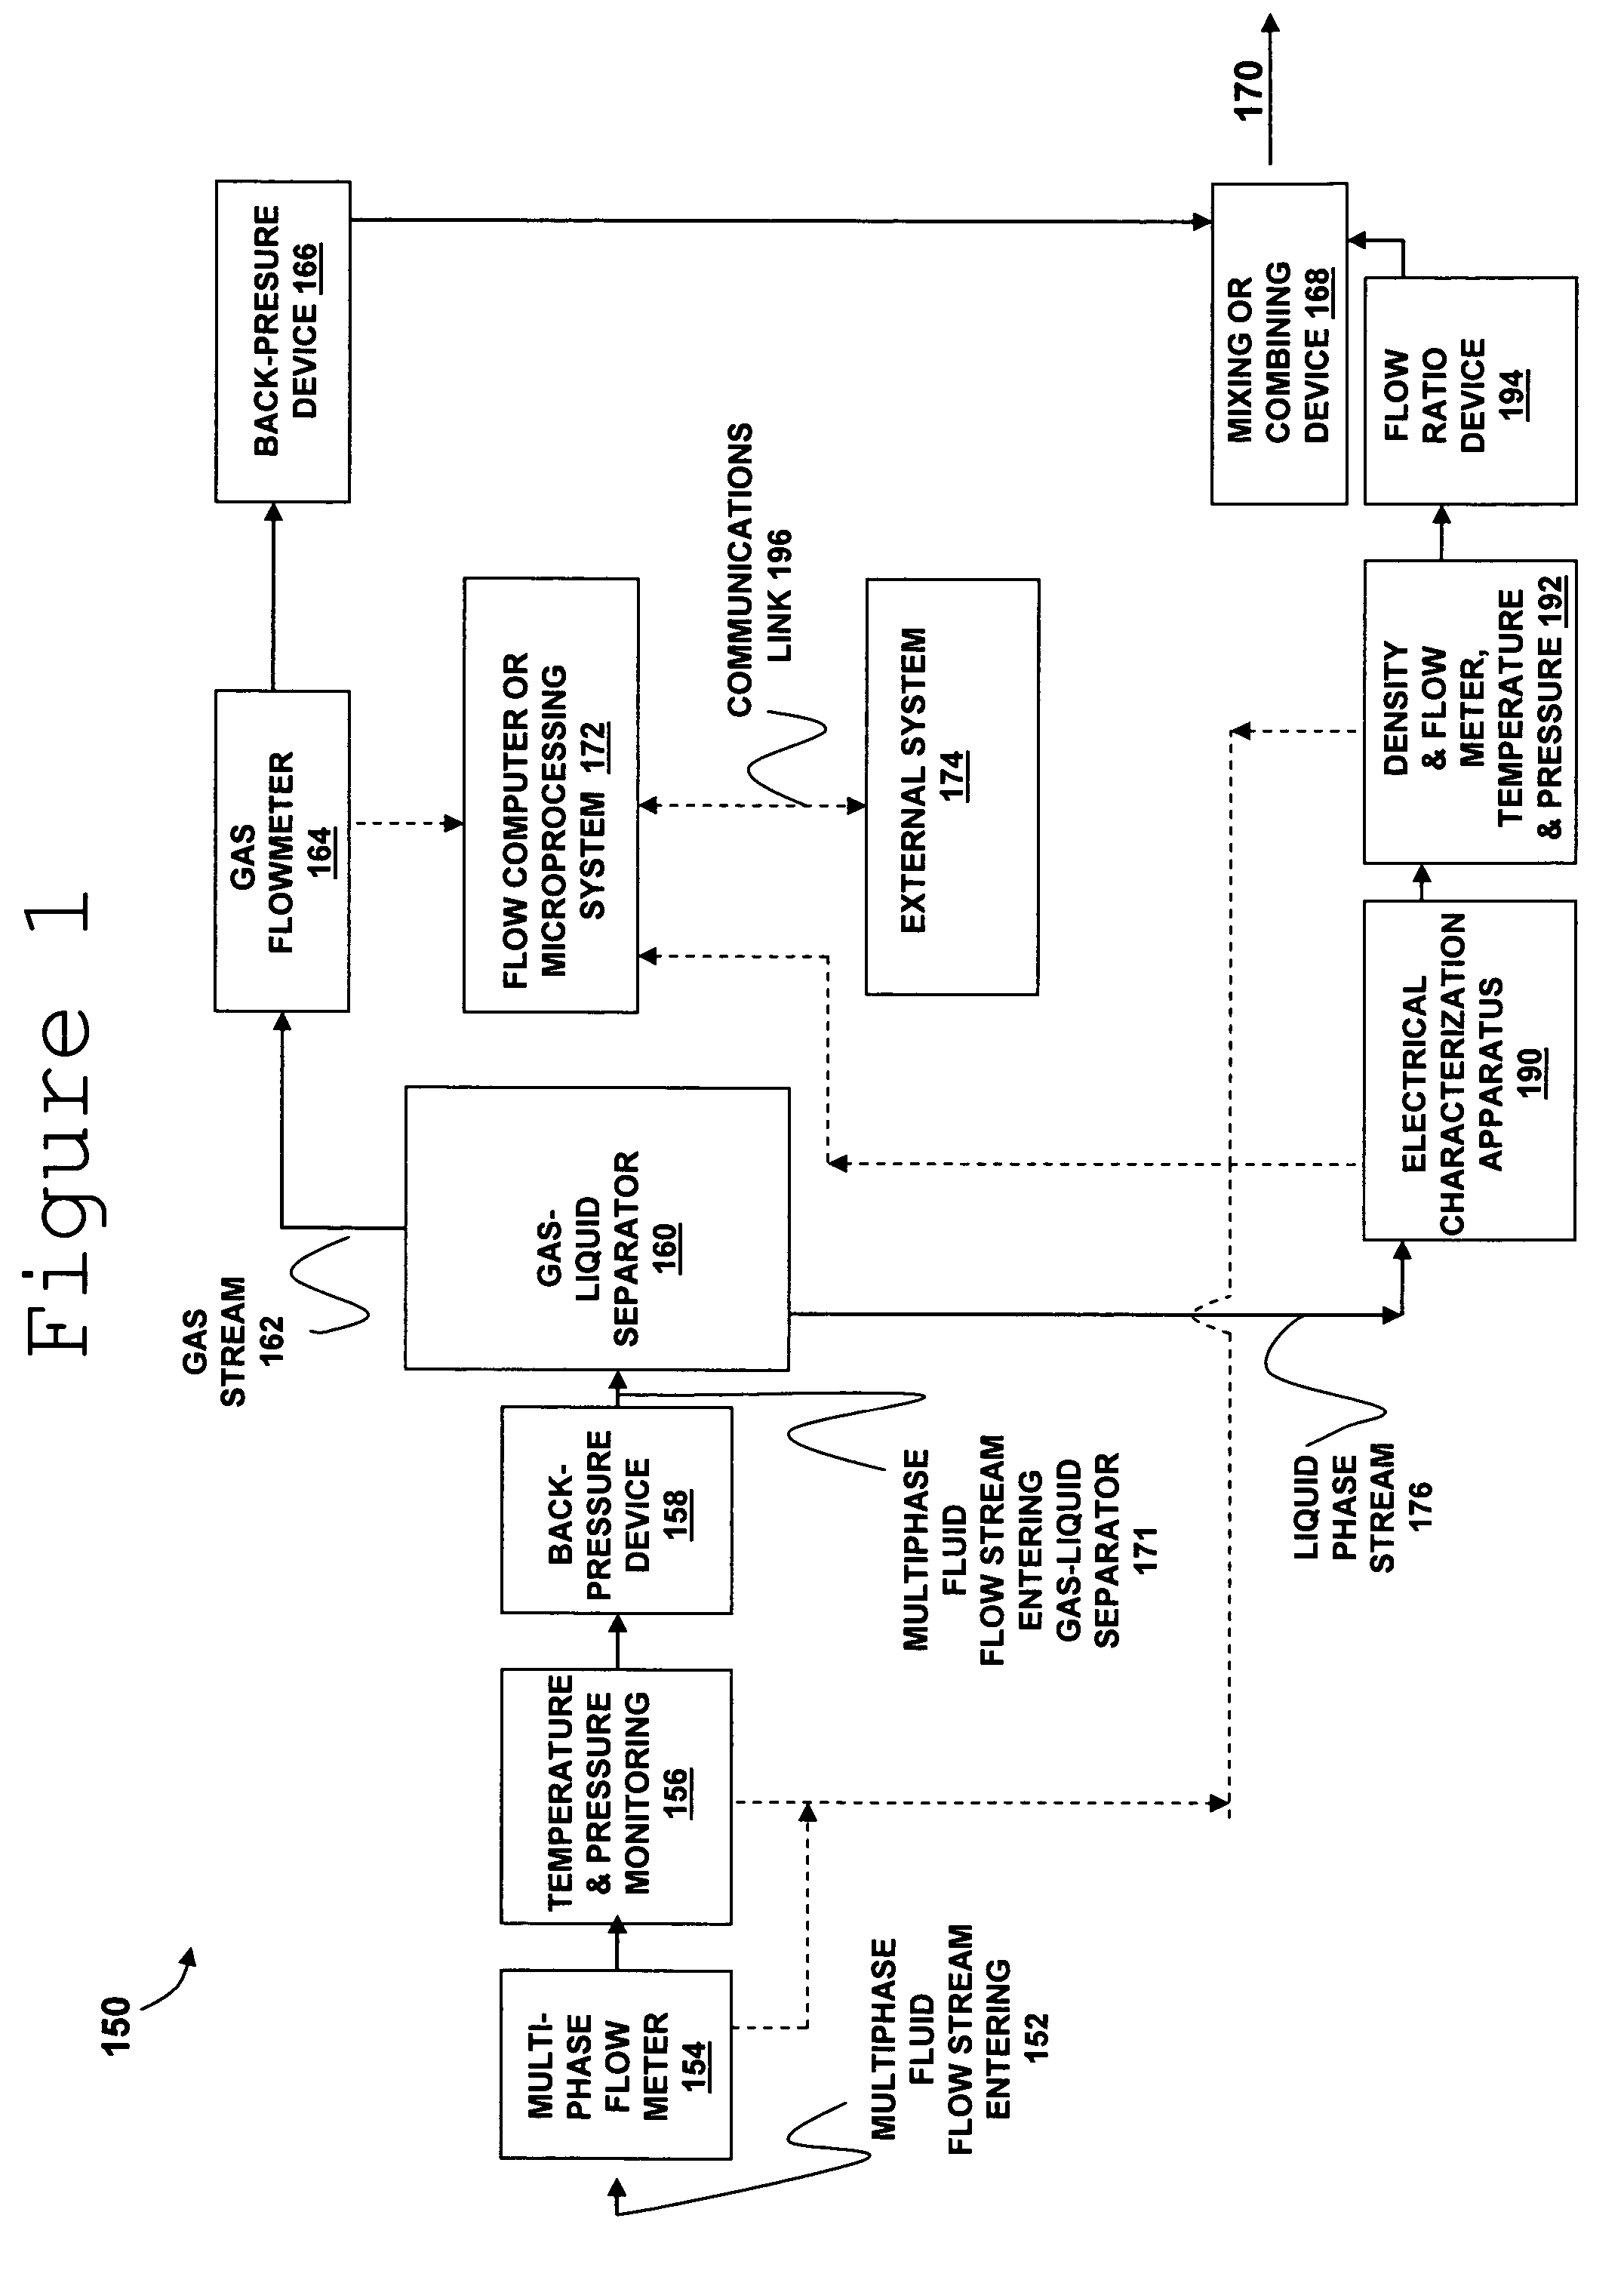
[0088]As an illustrative, non-limiting example, a preferred embodiment of the present invention can be applied to determine the water cut in 247,376 barrels of crude petroleum oil being off-loaded from an oil tanker 237. In this example, system 150 used the method of FIG. 5 and was located at point 239. An auto-sampler 226B was also present and the sample from the off-loading was analyzed using Karl Fischer titration as previously described, and arrived at a value of 0.32% water. In the ship unloading profile of FIG. 6, the flow started and stopped as shown in line 602, ran at half the rate for several hours, and had some very large spikes of water content in the oil, as shown in line 604, at points 606, 608, 610, and 612. Data was collected as per step 506. In normal ship unloading, it is expected to see water contents above 5% at some times during the unloading process FIG. 6A is the same unloading event with the no flow rate cases removed and the remaining data sorted by density ...

example 2

[0090]This example is the generally the same experimental design as Example 1 except that heavy crude petroleum oil (API density of 21 degrees) was used instead of light crude petroleum oil (API density of 32 degrees) because it was known that this crude was from Argentina with a history of this density.

[0091]A total of 225,565 barrels of oil were transferred from a ship as shown in FIG. 7 over a 15 hour period. During the unloading, spikes of water content 702 can be seen on the instantaneous water cut from electrical characterization apparatus 190. FIG. 7A shows the sorted densities per step 508 and the sorted water cuts corrected for the density of the oil shipped per step 514. The flow-weighted average water cut by permittivity was 0.21% per step 520. The flow-weighted average water cut by density was 0.47% per step 518. The composite water cut by offline titration was 0.75%. Later, it was found that the titration value of 0.75% water was an invalid number due to interference wi...


PUM

PropertyMeasurementUnit
densityaaaaaaaaaa
densityaaaaaaaaaa
frequencyaaaaaaaaaa

Abstract

Methods for determining and validating a first phase fraction of a gravitationally-separated multiphase fluid by conducting physical and electrical property measurements on samples of the fluid. The water content of crude petroleum oil is determined after the oil and water have begun to separate into phase layers such as occurs during un-agitated holding of the crude petroleum oil. A series of measurements of electrical properties such as permittivity and physical properties such as density is collected. The density minima can be used to generate hindsight determinations of average properties, such as the dry oil phase density, which in turn can be used to increase the accuracy of the water percentage in the oil determined by the permittivity and density methods. Flow weighted averages of water percentages by each method can be used to determine and validate the water content of the crude petroleum oil.

Description

CROSS-REFERENCE TO RELATED APPLICATIONS[0001]This application claims priority from U.S. Provisional Patent Application 60 / 698,056 filed on Jul. 11, 2005 and U.S. Provisional Patent Application 60 / 721,235 filed on Sep. 28, 2005.BACKGROUND AND SUMMARY OF THE INVENTION[0002]The present application generally relates to methods for measuring the amount of one phase in a mixture of phases, more particularly to measuring the amount of water present in crude petroleum oil, and most particularly to low water cut crude petroleum oils.[0003]The following paragraphs contain some discussion, which is illuminated by the innovations disclosed in this application, and any discussion of actual or proposed or possible approaches in this Background section does not imply that those approaches are prior art.[0004]Background: Water Cut Analyses in Oil Processing[0005]The chemical and physical characterization of crude, partially refined, and fully refined petroleum products is a common practice in the p...

Claims


Application Information

Patent Timeline
Patent Type & Authority Patents(United States)
IPC IPC(8): G01N33/20
CPCG01N9/36G01N22/00G01N33/28G01N33/2823G01N22/04G01N2009/006G01N9/24
Inventor SCOTT, BENTLEY N.
Owner PHASE DYNAMICS
Why Eureka
Try Eureka