
Fluorescent material, scintillator using same, and radiation detector using same

a fluorescence material and scintillator technology, applied in the direction of fluorescence/phosphorescence, conversion screens, optical radiation measurement, etc., can solve the problems of reducing the use efficiency of x-rays, vibration from the exterior vibrating the electrode plate, and high internal pressure of the xenon gas filled chamber, so as to reduce the afterglow level and reduce the scan time. , the effect of increasing resolution

Active Publication Date: 2013-04-02
HITACHI METALS LTD
View PDF19 Cites 7 Cited by
  • Summary
  • Abstract
  • Description
  • Claims
  • Application Information

AI Technical Summary

Benefits of technology

[0086]A fluorescent material according to the present invention is able to provide a scintillator having a low level of afterglow 1 to 10 ms after the termination of X-ray radiation, as compared with a conventional fluorescent material of GGAG:Ce. A radiation detector according to the present invention, formed using such a fluorescent material as a scintillator, has a shorter scan time. The detector may contribute thereby to increased resolution. The detector may also have stable detection performance.BEST MODE FOR CARRYING OUT THE PRESENT INVENTION
[0087]The inventor studied in detail the causes of the above problem. It was thereby found that when a fluorescent material of GGAG:Ce was excited by a predetermined light, thereby producing an afterglow spectrum, the long wavelength component of 750 to 850 nm therein was correlated with the short term afterglow of the fluorescent material. This enabled the inventor to achieve the present invention.
[0088]The afterglow from X-ray excitation is proportional to the afterglow from ultraviolet ray excitation. In view of this, a study was conducted to find out why the level of afterglow increases by use of a fluorescence spectrophotometer (F4500 manufactured by Hitachi Co. Ltd.).
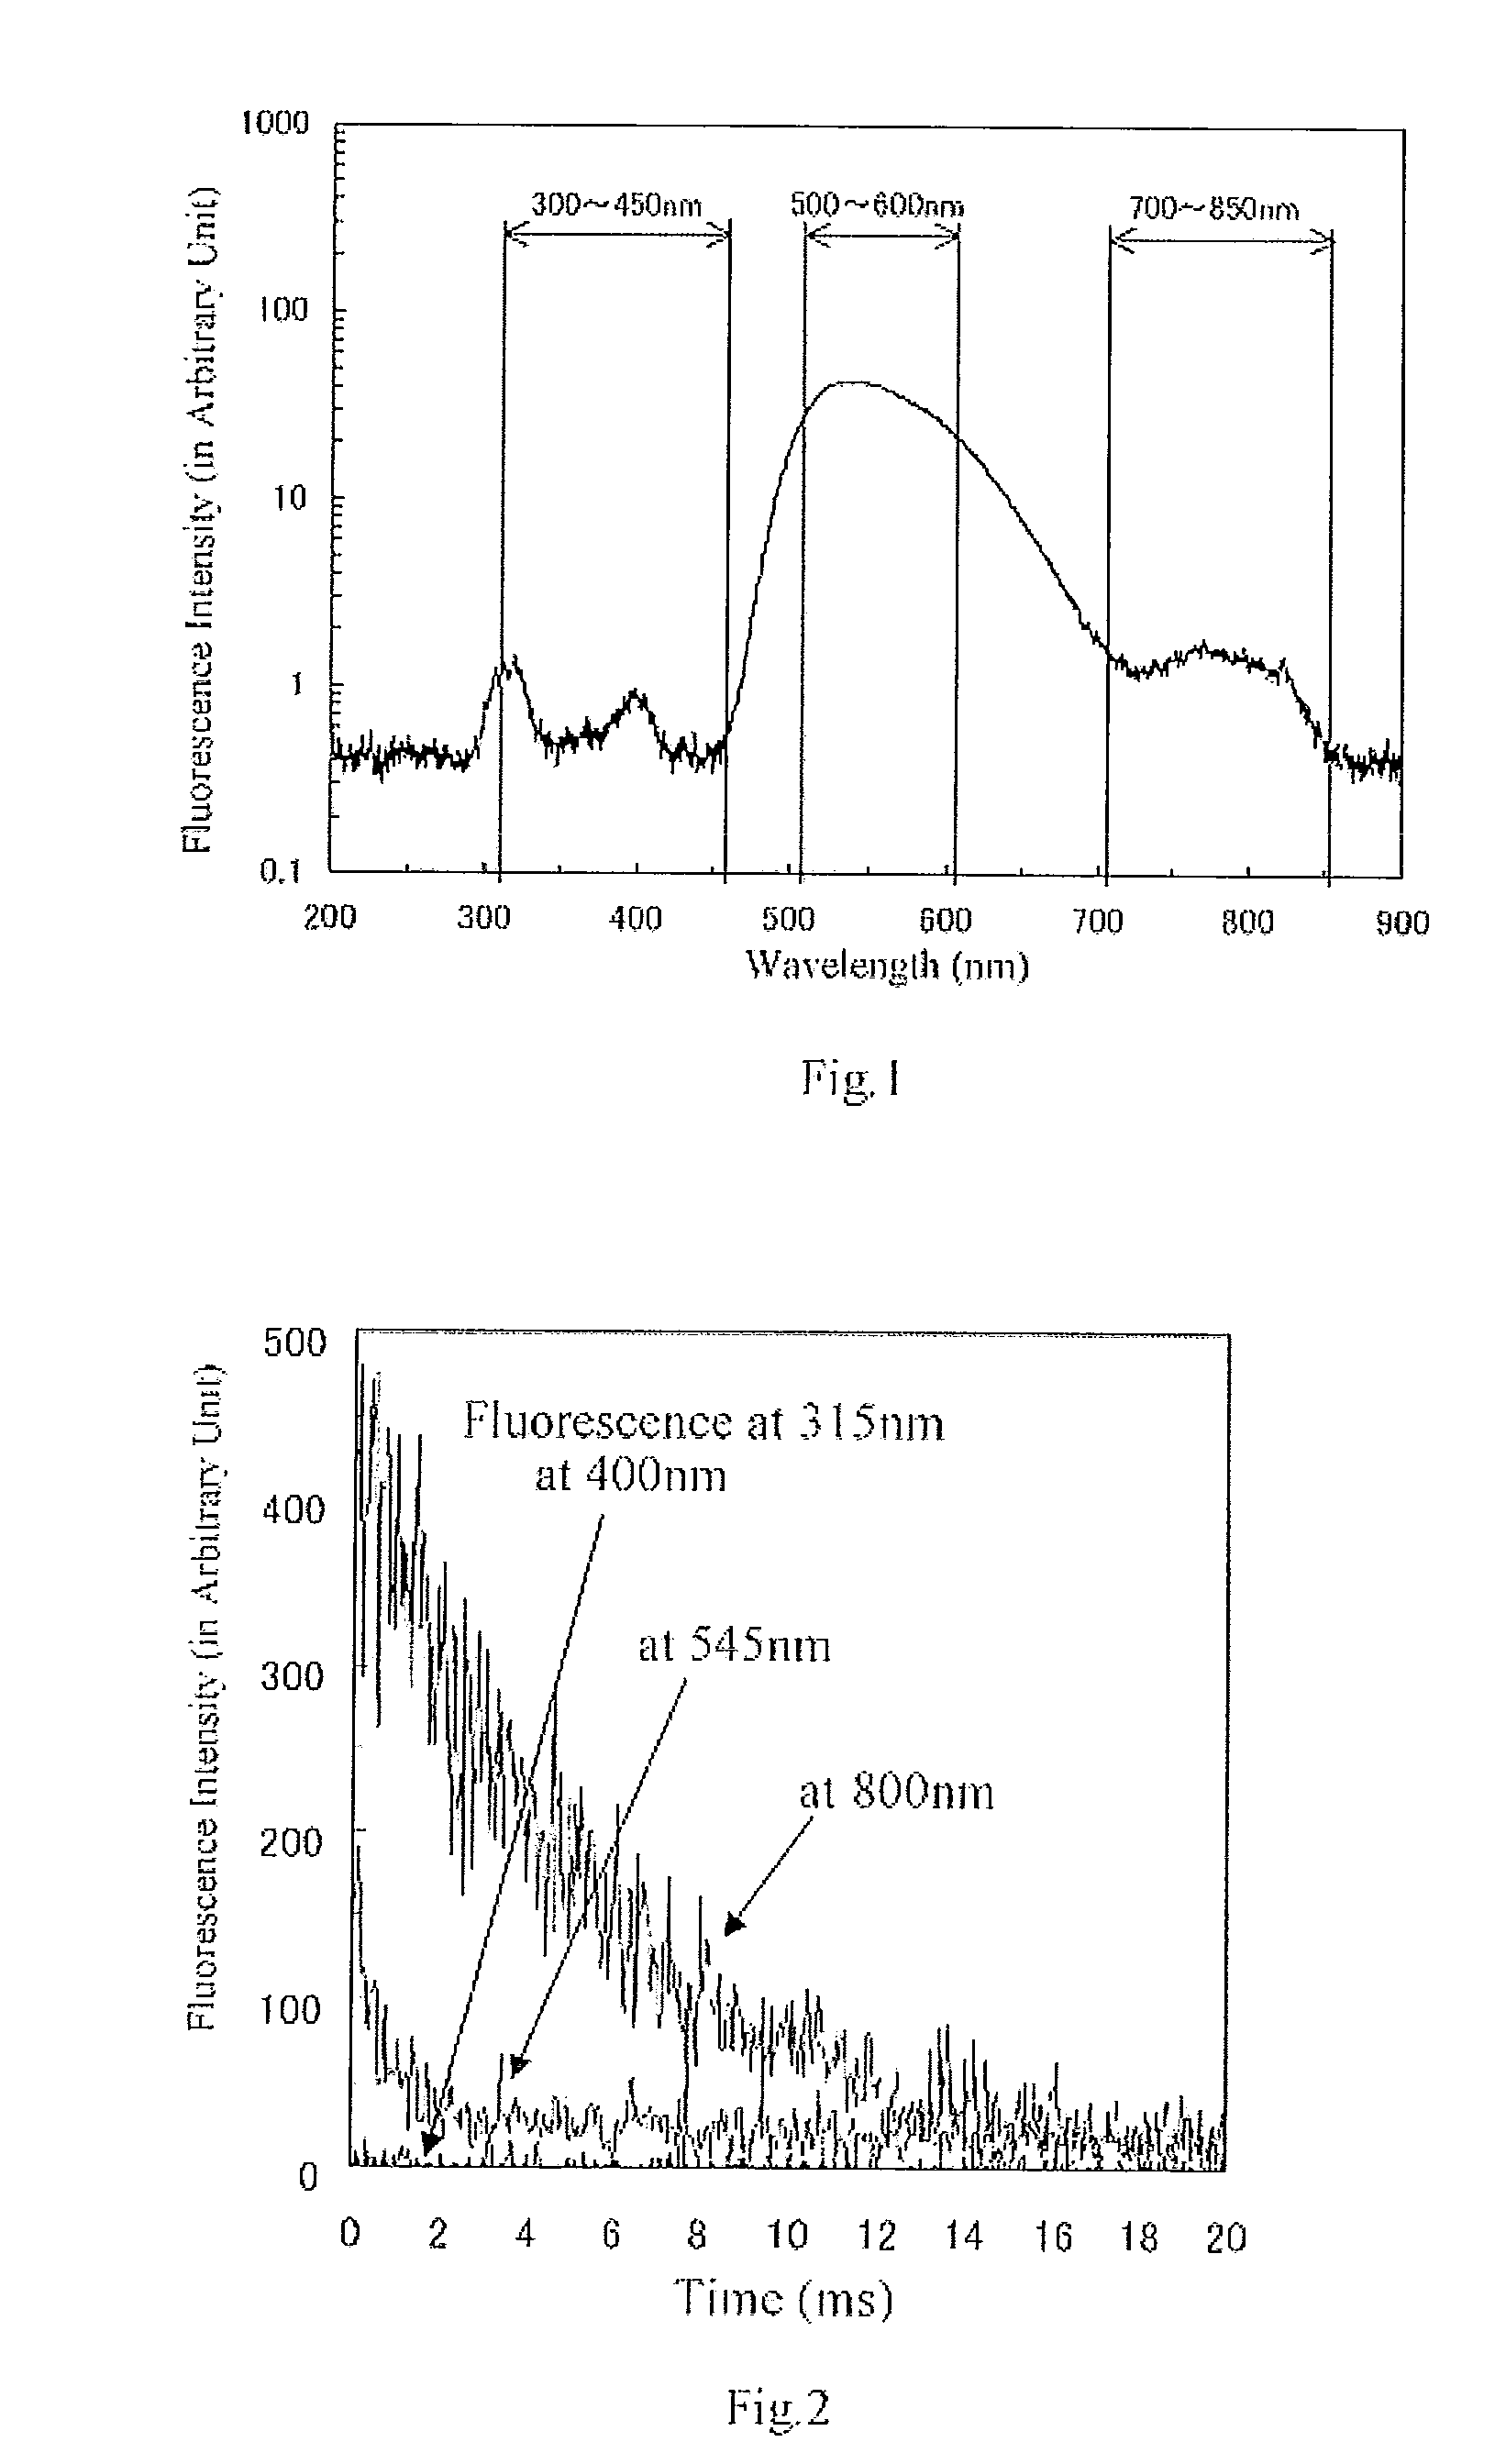
[0089]FIG. 1 is directed to the case in which a GGAG:Ce single crystal grown using a CZ method is excited using an ultraviolet light at a wavelength of 260 nm as an excitation light. FIG. 1 is a schematic diagram of a fluorescent spectrum in this case. The GGAG:Ce single crystal contains an ion Ce3+. This ion Ce3+ exhibits a smoothly curved fluorescent spectrum. The spectrum peaks at a wavelength of 540 nm. The fluorescence around a wavelength of 315 nm and the fluorescence around a wavelength of 400 nm are thought to be due to defects in the lattice. On the other hand, a weak, broad fluorescence is observed in the range of wavelengths of 700 to 850 nm.
[0090]FIG. 2 is a schematic diagram of afterglow profiles for each wavelength in this fluorescent material. That is, FIG. 2 shows change in the fluorescence intensity after stopping emitting excitation light. As can be seen from the figure, the fluorescence at the wavelength of 315 nm causes a very low level of afterglow. Similarly, the fluorescence at the wavelengths of 400 nm causes a very low level of afterglow. However, the fluorescence at the wavelength of 800 nm causes a very high level of afterglow.
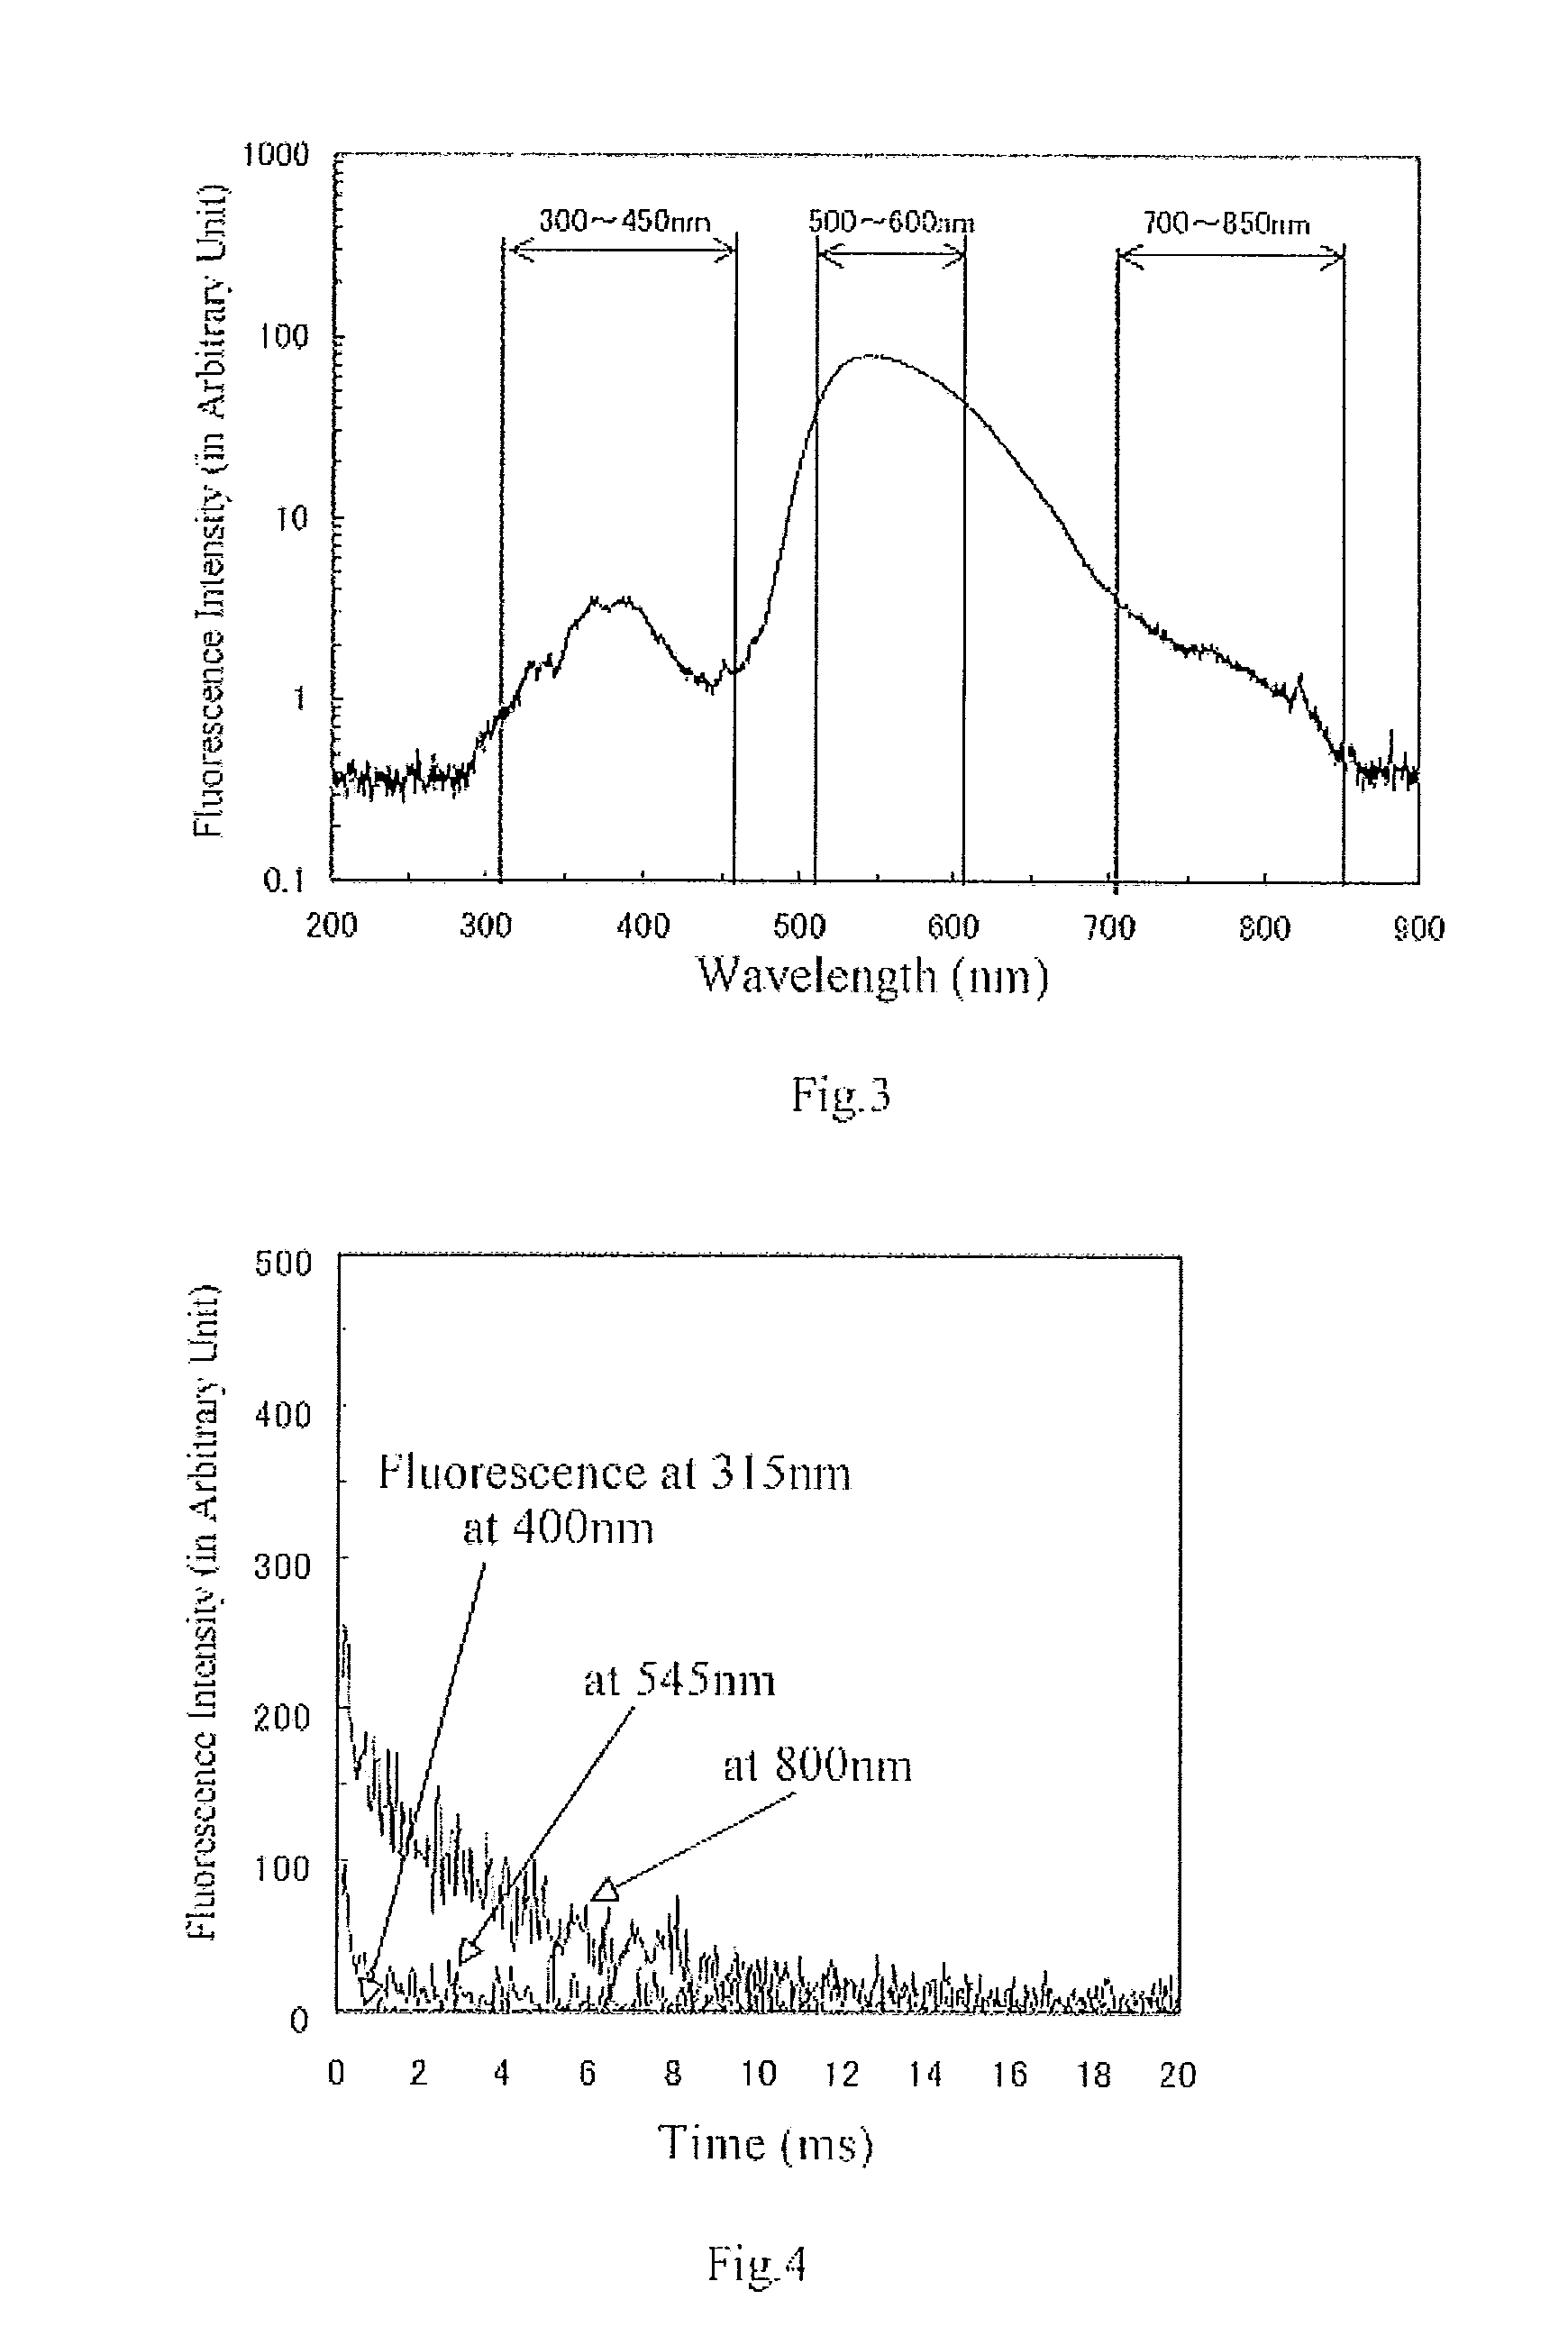
[0091]FIG. 3 is directed to the case in which a sample of a GGAG:Ce polycrystal sintered by using an HIP sintering method is excited using an ultraviolet light at a wavelength of 260 nm as a excitation light. FIG. 3 is a schematic diagram of a fluorescent spectrum in this case. The GGAG:Ce material contains an ion Ce3+. This ion Ce3+ exhibits a smoothly curved fluorescent spectrum. The spectrum peaks at a wavelength of 540 nm. The fluorescence around a wavelength of 380 nm is thought to result from an overlap of the fluorescence due to defects in the lattice and the fluorescence caused by Ce3+ incorporated in a perovskite phase constituting a heterogeneous phase in the GGAG:Ce polycrystal. When a perovskite phase is detected using an X-ray diffraction method, the fluorescence at this wavelength of 380 nm appears strongly. However, even when a perovskite phase is not detected at all, this fluorescence appears. On the other hand, a weak, broad fluorescence is observed in the range of wavelengths of 700 to 850 nm.

Problems solved by technology

However, the interior pressure of the xenon gas filled chamber is high.
This decreases use efficiency of X-rays.
However, if the electrode plate is thin, vibration from the exterior vibrates the electrode plate.
This generates noise.
This constitutes a problem.
This causes noise in a silicon photodiode.
This in turn decreases the sensitivity.
However, an increase in the thickness thereof hinders miniaturization of an X-ray detecting element.
This increases the cost.
All this causes an X-ray detecting element to have a shortened integration time.

Method used


Image

  • Fluorescent material, scintillator using same, and radiation detector using same
  • Fluorescent material, scintillator using same, and radiation detector using same
  • Fluorescent material, scintillator using same, and radiation detector using same

Examples


example 1

[0176]A resin pot having a volume of 1 liter was provided. An amount of 200 g of a raw material, 1300 g of a high-purity alumina ball having a diameter of 5 mm, and 200 cc of ethanol were placed into the pot. After mixing the contents for 12 h, change in the mass of the alumina ball was 0.06 g. In view of this, and considering that Al2O3 from the ball of a ball mill will enter into the mixture, in order to achieve the composition of example 1 in table 2, 126.91 g of Gd2O3 (Fe: 0.4 mass ppm), 0.363 g of CeO2, 40.62 g of Al2O3 (Fe: 0.2 mass ppm), and 32.05 g of Ga2O3 (Fe: 0.2 mass ppm) were weighed. Regarding a powder made of a Gd2O3 raw material, a powder having an average particle size of 2 μm was used (the average particle size refers to an median particle diameter herein). Regarding a powder made of an Al2O3 raw material, a powder having an average particle size of 0.6 μm was used. Regarding a powder made of a Ga2O3 raw material, a powder having an average particle size of 3 μm wa...

example 2

[0179]A resin pot having a volume of 1 liter was provided. An amount of 180 g of a calcined power having a temperature of 1400° C., 1300 g of a high-purity alumina ball having a diameter of 5 mm, and 200 cc of ethanol were placed into the pot. After mixing the contents for 12 h, change in the mass of the alumina ball was 0.20 g. In view of this, and considering that Al2O3 from the ball of a ball mill will enter into the mixture powder (if the abrasion loss of the alumina ball produced by the milling and mixing operation is added thereto, the sum is 0.26 g), in order to obtain the composition in example 2 in table 2, 122.19 g of Gd2O3 (Fe: 0.1 mass ppm), 0.105 g of CeO2, 30.77 g of Al2O3 (Fe: 0.1 mass ppm), and 46.68 g of Ga2O3 (Fe: 0.2 mass ppm) were weighed. Regarding a powder made of a Gd2O3 raw material, a powder having an average particle size of 2 / U m was uses. Regarding a powder made of an Al2O3 raw material, a powder having an average particle size of 0.6 μm was used. Regardi...

example 3

[0180]In order to obtain the composition in example 3 in table 2, 115.96 g of Gd2O3 (Fe: 0.4 mass ppm), 1.337 g of CeO2, 21.95 g of Al2O3 (Fe: 4 mass ppm), and 60.69 g of Ga2O3 (Fe: 0.2 mass ppm) were weighed. Only the Ga2O3 powder that had been in advance heat treated at 1400° C. for 3 h under a vacuum of approximately 10 Pa was used. This decreased the content of Fe from 1 mass ppm to 0.2 mass ppm. Otherwise, the method similar to that in example 1 was applied to obtain a scintillator by use of a polycrystalline fluorescent material as a sample.


PUM

PropertyMeasurementUnit
mass %aaaaaaaaaa
wavelength rangeaaaaaaaaaa

Abstract

A fluorescent material for a scintillator to be used in a radiation detector is provided. The fluorescent material is designed to have a high fluorescent intensity and a low level of afterglow a short term of 1 to 300 ms after the termination of X-ray radiation.The above fluorescent material contains Ce as an activator. In addition, the material must contain at least Gd, Al, Ga, O, Fe, and a component M. The component M is at least one of Mg, Ti, and Ni. In addition, the composition of the material must be expressed by the general formula:(Gd1-x-zLuxCez)3+a(Al1-u-sGauScs)5−aO12 wherein 0≦a≦0.15, 0≦x≦0.5, 0.0003≦z≦0.0167, 0.2≦u≦0.6, and 0≦s≦0.1, and wherein, regarding the concentrations of Fe and M, Fe: 0.05≦Fe concentration (mass ppm)≦1, and 0≦M concentration (mass ppm)≦50.

Description

TECHNICAL FIELD[0001]The present invention relates to a fluorescent material configured to absorb radiation such as X-rays and emit fluorescence. The present invention also relates to a scintillator using such a fluorescent material. The present invention also relates to a radiation detector using such a fluorescent material.BACKGROUND ART[0002]One example of an X-ray diagnostic device is an X-ray CT (Computed Tomography) scanner. This CT scanner is composed of an X-ray tube and an X-ray detector. The tube is designed to emit a fan-shaped beam of X-rays, i.e., an X-ray fan beam. The detector is composed of many X-ray detecting elements arrayed side-by-side. The scanner operates as follows: The X-ray tube emits a series of X-ray fan beams one after another onto the X-ray detector. Each fan beam incident on the surface a tomographic layer is oriented at a predetermined angle, for example, 1 degree, from the previous one. The scanner collects thereby data on absorptions of X-rays. Subs...

Claims


Application Information

Patent Timeline
Patent Type & Authority Patents(United States)
IPC IPC(8): G01T1/20G01J1/58
CPCC01F17/0018C01G15/006C04B35/01C04B35/44C04B35/6261C04B35/6455C09K11/7774G01T1/20G21K4/00C01G15/00G21K2004/06C04B2235/3206C04B2235/3224C04B2235/3229C04B2235/3232C04B2235/3272C04B2235/3279C04B2235/3286C04B2235/5436C04B2235/5445C04B2235/608C04B2235/661C04B2235/725C04B2235/764C04B2235/77C01F17/32
Inventor NAKAMURA, RYOUHEIUEDA, SHUNSUKE
Owner HITACHI METALS LTD
Learn More