Cost-effective remote monitoring, diagnostic and system health prediction system and method for vapor compression and heat pump units based on compressor discharge line temperature sampling

a technology of diagnostic and system health prediction and compressor discharge line, which is applied in the direction of lighting and heating apparatus, instruments, heating types, etc., can solve the problems of equipment owners either failing, increasing energy consumption, and insufficient cooling of living spaces, so as to reduce the cost of monitoring system, eliminate expensive sensors, and improve the effect of cos

Active Publication Date: 2015-10-27
MAINSTREAM ENG
View PDF16 Cites 69 Cited by
  • Summary
  • Abstract
  • Description
  • Claims
  • Application Information

AI Technical Summary

Benefits of technology

[0019]The HVAC service provider also benefits from an RMS by distributing service calls more evenly. Currently, when the first hot days arrive and the unit's degraded capacity becomes apparent, the equipment owner will call a HVAC technician to service the A/C unit. However, the service provider is usually overwhelmed with similar calls on the first hot day where system degradation becomes obvious. For the large service contractor firms with tens of thousands of service contracts, an RMS that can predict failures before they occur or determine inefficient operation has important benefits. The RMS also assists in the scheduling of service calls by providing detailed information regarding the severity of the problem and by offering remote diagnosis. This allows the service provider to dispatch the appropriate repair technician to the site and cluster similar service calls to a technician specialized in that repair.
[0020]There are many complex monitoring system approaches, such as the one disclosed in U.S. Pat. No. 7,469,546 that includes the use of temperature,

Problems solved by technology

Eventually, an undetected equipment problem might lead to a costly system failure, such as a compressor motor burnout, or simply lead to increased energy consumption, and failure to cool living spaces adequately during the next hot day.
Although the energy bill is higher due to this degraded performance, equipment owners either fail to notice the energy increase or fail to relate the high energy bill to the A/C unit's degraded efficiency.
However, the service provider is usually overwhelmed with similar calls on the first hot day where system degradation becomes obvious.
Using pressure and flow sensors dramatically increases the cost of the monitoring system and makes this type of monitoring system unfeasible for residential or small commercial A/C units.
Flow meters and pressure transducers with sufficient accuracies that are included with the complex monitoring system are too expensive for this application.
The in-loop temperature sensors are significantly more expensive than surface mount sensors due to the increased cost of a refrigerant-compatible and pressure-tolerant sensor and the additional cost to install these temperature sensors into the refrigeration flow circuit.
In addition, for the typical split A/C unit or heat pump system, where the evaporator and blower are located inside the conditioned building (and referred to as the air handler or evaporator section) and the condenser and compressor are located outside the conditioned space (and referred to as the condensing unit), it is more difficult to monitor refrigerant pressures, temperatures or flow rates on both the evaporator section and the condenser unit locations since they are not collocated.
Using the system's designed airflow rate can, however, introduce a significant amount of error as the air handler airflow rate is a function of the pressure differential across the blower.
Therefore, we reco

Method used


Image

  • Cost-effective remote monitoring, diagnostic and system health prediction system and method for vapor compression and heat pump units based on compressor discharge line temperature sampling
  • Cost-effective remote monitoring, diagnostic and system health prediction system and method for vapor compression and heat pump units based on compressor discharge line temperature sampling
  • Cost-effective remote monitoring, diagnostic and system health prediction system and method for vapor compression and heat pump units based on compressor discharge line temperature sampling

Examples


example 2

Demonstrating the Capability to Identify Low Run Capacitance

[0096]FIG. 9 shows the variation in winding voltage ratio as a function of current at different run capacitances for a condensing unit. The particular condensing unit used in this example specified a 45 uF run capacitor. The normalized winding voltage ratio of a 45 μF capacitor was used as the baseline data. In this example, the equation for the baseline curve was

Baseline=−0.0004I2−0.15I+1.2203

where I is the current draw of the unit. The current draw used to establish the coefficients of the second order polynomial are determined from initial operating data during the learning process and either the compressor current draw or the current draw of the entire outdoor unit can be utilized as long as the current being measured is consistent. That is the current draw being used to learn must be the same as the current draw used during subsequent monitoring

The non-critical and critical alarm curves are at normalized winding values...

example 4

Experimental Demonstration of the Faulty Condenser Airflow Detection Method

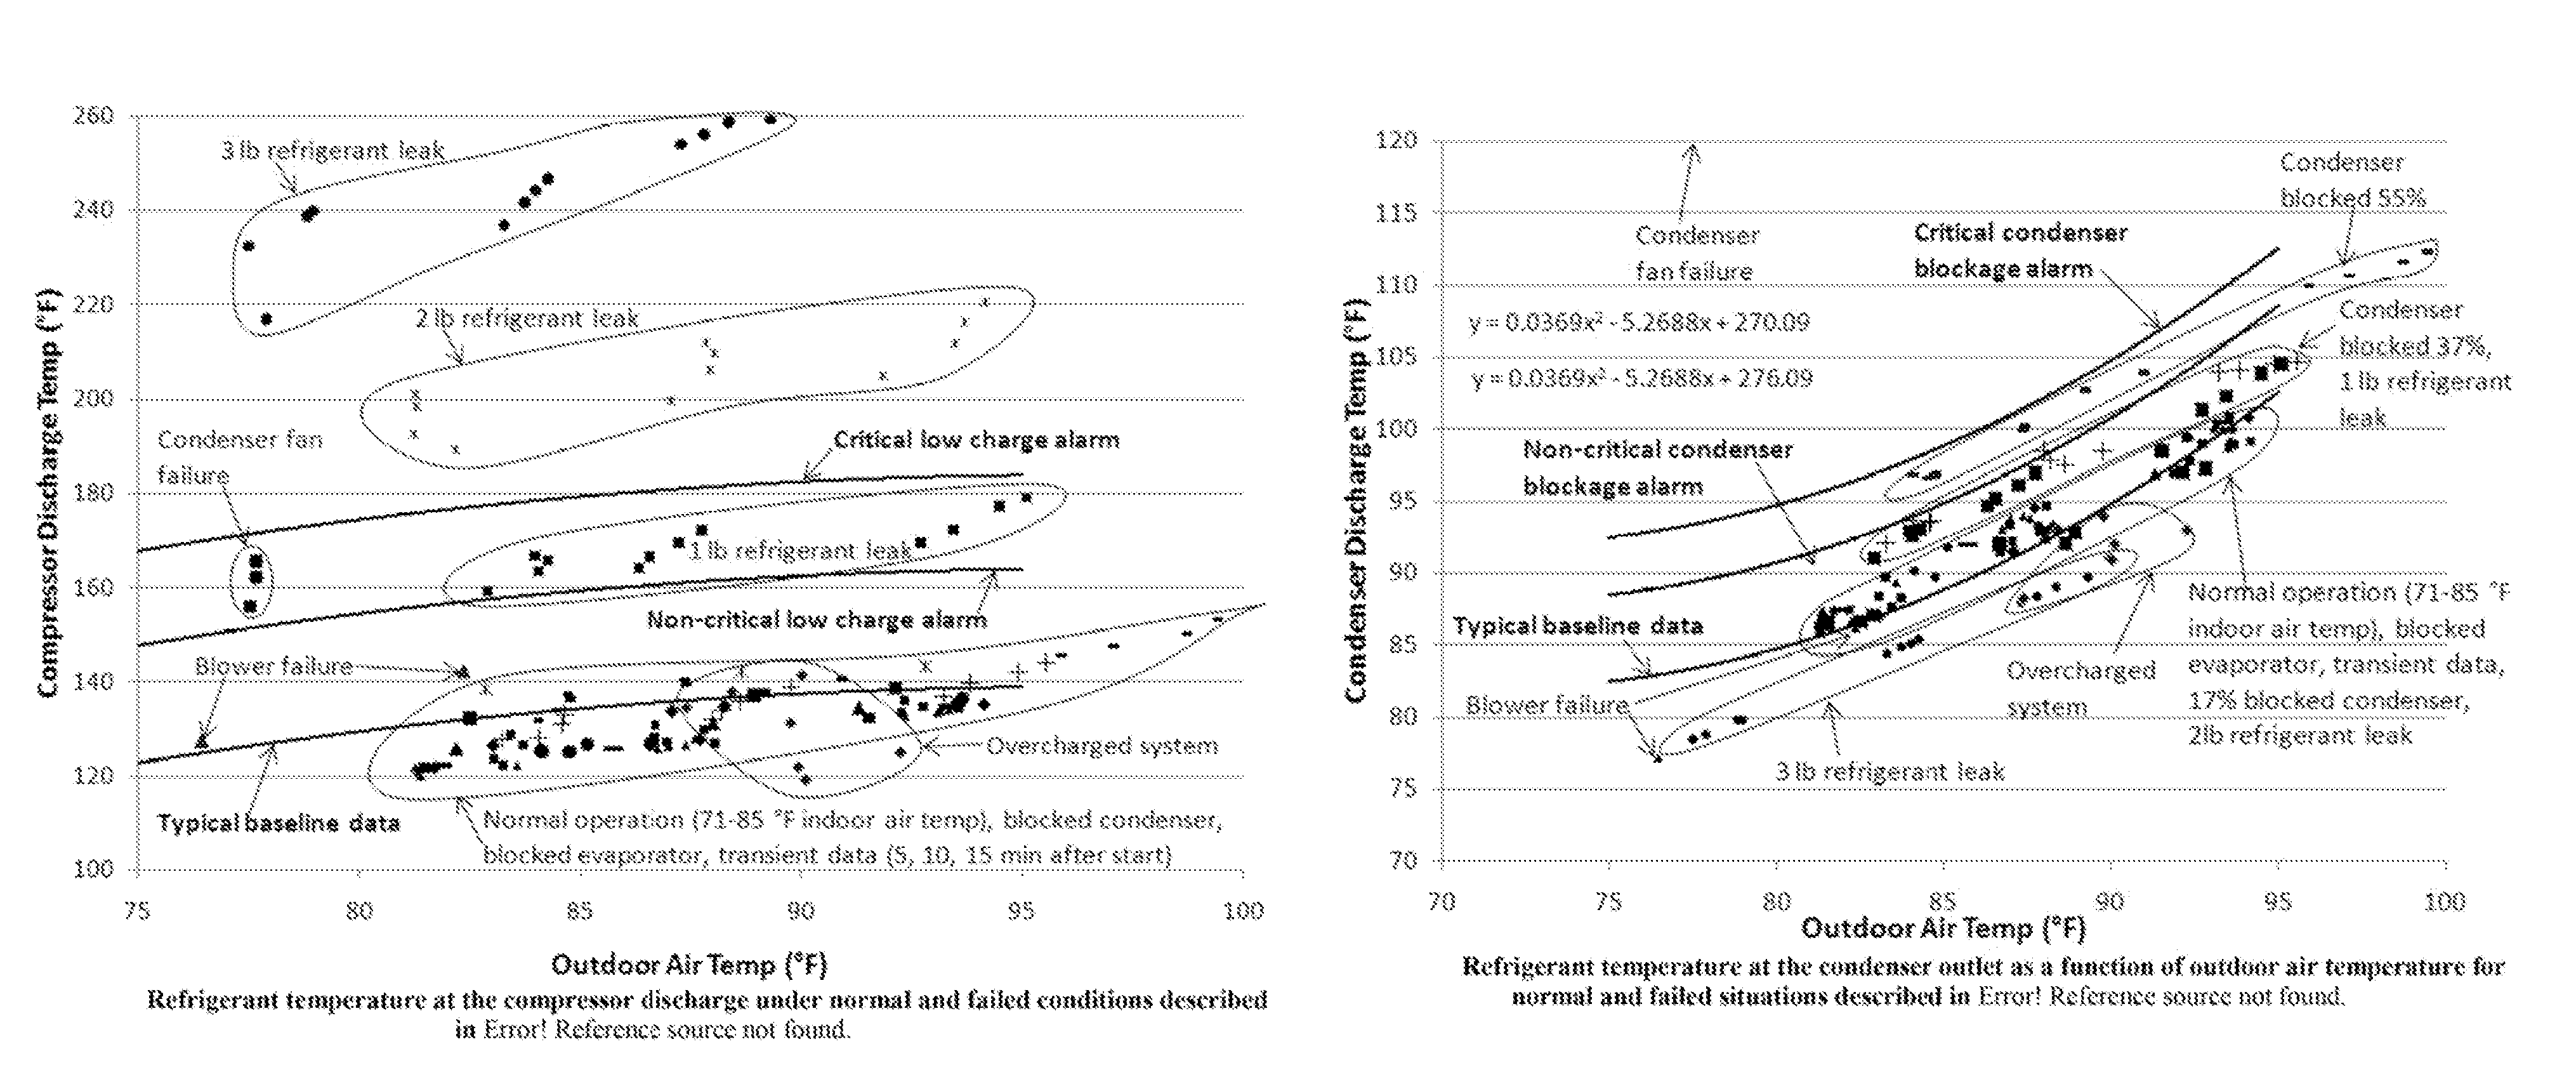
[0102]FIG. 8 displays the baseline, non-critical alarm, and critical alarm curves for condenser blockages which were calculated after baseline data collection. The baseline curve equation in this example is

Baseline=0.0369Tamb2−5.27Tamb+270.10

where Tamb is the outdoor air temperature.

[0103]The non-critical condenser blockage alarm curve and critical condenser blockage alarm curve values are 6° F. and 10° F. greater than the baseline curve y-intercept.

Non-Critical Condenser Air Blockage=Baseline+6

or

Non-Critical Condenser Air Blockage=0.0369Tamb2−5.27Tamb+276.10

Critical Condenser Air Blockage=Baseline+10

or

Critical Condenser Air Blockage=0.0369Tamb2−5.27Tamb+280.10

[0104]FIG. 8 displays the measured values obtained when operating with each of the failure modes identified in Table 1 and how they compare to the thresholds for non-critical and critical arm notifications. As shown in FIG. 8 a condenser coil that is 37...


PUM

PropertyMeasurementUnit
Currentaaaaaaaaaa
Temperatureaaaaaaaaaa
Flow rateaaaaaaaaaa

Abstract

A diagnostic monitoring system and method is employed for one or more vapor compression systems such as air conditioners and heat pumps having a compressor, an indoor air handler fan coil and an outdoor condensor. Temperature, voltage and current sensors are provided at the outdoor condensor to determine that at least one vapor compression system is operating properly. Data obtained from the sensors is wirelessly transmitted to a receiving-device for use by the systems' custodian or repair service provider and includes information concerning an occurrence of periods when one or more of the vapor compression systems are operating at an abnormal state.

Description

BACKGROUND AND SUMMARY OF THE INVENTION[0001]The following terms and their acronyms are used hereinafter in the description of the invention:[0002]Quality—the ratio of the mass of vapor to the total mass of a saturated substance (see G. Van Wylen and R. Sonntag, Fundamentals of Classical Thermodynamics, p. 37, (John Wiley & Sons, 2nd ed., SI version 1978)).[0003]Flow Quality—the ratio of the vapor mass flow rate to the total mass flow rate.[0004]Access Point (AP)—The device connected to the Internet to transmit data between the Internet and any ED.[0005]End Device (ED)—Any control or monitoring device located remotely from the AP, which sends data or receives commands from the AP.[0006]OCU-ED—An Outdoor Condensing Unit End Device and sensors which monitor performance of a split air-conditioning or heat pump thermal control system.[0007]IAH-ED—An Indoor Air Handler Unit End Device and associated sensors which monitors interior air temperature, and also can monitor performance of the ...

Claims


Application Information

Patent Timeline
IPC IPC(8): F25B45/00A61K48/00
CPCA61K48/00F25B2700/2102F25B2700/21162F25B2600/05F25B2500/24F25B2700/04F25B2700/21163F25B2345/003F25B2700/21152F25B2600/19F25B49/005F25B2600/07F25B2700/151F25B2700/2106F25B2700/21151F24F11/30F24F11/62F24F11/36F24F11/58F24F11/63F24F11/38F24F2140/00F25B49/02F25B2500/08F25B2500/222G06N5/04F25B49/022F25B49/027F25B2500/07F25B2700/2116G08B21/187
Inventor SCARINGE, ROBERT P.ROTH, ROBERT PAULLAMBERT, DANIEL L.THOMAS, ERIK P.CARFF, CHAD L.
Owner MAINSTREAM ENG
Why Eureka
Try Eureka