Thermal analysis method for measuring glass transition temperature of amorphous alloy
A glass transition and thermal analysis technology, applied in the field of amorphous alloys and thermal analysis and testing, can solve problems such as single function and narrow application area, and achieve the effect of great application prospects.
- Summary
- Abstract
- Description
- Claims
- Application Information
AI Technical Summary
Problems solved by technology
Method used
Image
Examples
Embodiment 1
[0023] 1. The master alloy was smelted in a non-consumable arc melting furnace, and the Fe-B-Y-Nb bulk amorphous sample was prepared by a water-cooled copper mold suction casting method;
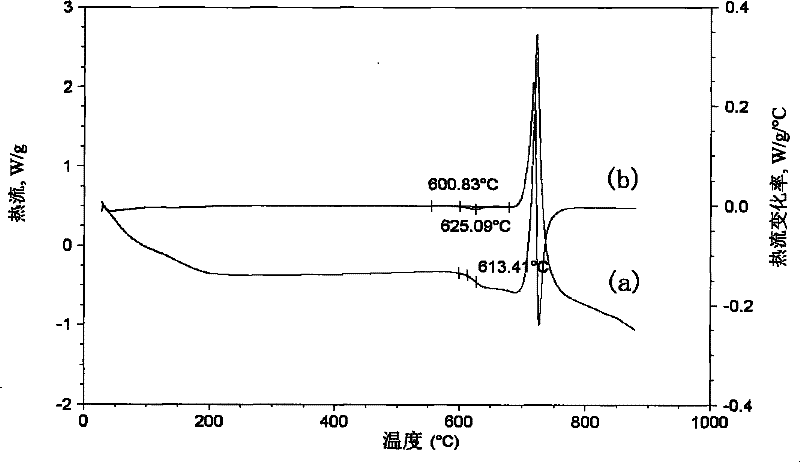
[0024] 2. Use a differential thermal analyzer to measure the heat flow-temperature curve of the sample obtained in step 1 under nitrogen atmosphere, 20°C / min, and DSC mode, see figure 1 the a curve;
[0025] 3. The heat flow-temperature curve obtained in step 2 is derived from the temperature to obtain the heat flow rate-temperature curve, see figure 1 the b-curve;
[0026] 4. On the heat flow rate-temperature curve obtained in step 3, find out the peak corresponding to the glass transition, and determine the onset temperature (T i ) is 600.83℃, the peak temperature (T P ) is 625.09°C, thus determining the reference temperature range [1] as: from the initial temperature of 600.83°C (T i ) to a peak temperature of 625.09°C (T P );
[0027] 5. On the heat flow-temperature curve, within a...
Embodiment 2
[0029] 1. The master alloy was smelted in a non-consumable arc melting furnace, and the Fe-B-Y-Nb bulk amorphous sample was prepared by a water-cooled copper mold suction casting method;
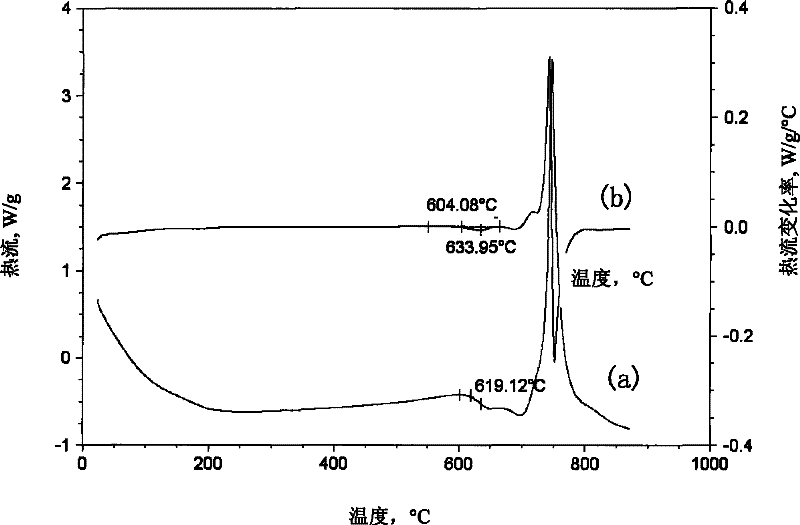
[0030] 2. Use a differential thermal analyzer to measure the heat flow-temperature curve of the sample obtained in step 1 under the conditions of nitrogen atmosphere, 30°C / min, and DSC mode, see figure 2 the a curve;
[0031] 3. The heat flow-temperature curve obtained in step 2 is derived from the temperature to obtain the heat flow rate-temperature curve, see figure 2 the b-curve;
[0032] 4. On the heat flow rate-temperature curve obtained in step 3, find out the peak corresponding to the glass transition, and determine the onset temperature (T i ) is 604.08℃, the peak temperature (T P ) is 633.95°C, thus determining the reference temperature range [1] as: from the initial temperature of 604.08°C (T i ) to a peak temperature of 633.95°C (T P );
[0033] 5. On the heat flow-tempera...
Embodiment 3
[0035] 1. The master alloy was smelted in a non-consumable arc melting furnace, and the Fe-B-Y-Nb bulk amorphous sample was prepared by a water-cooled copper mold suction casting method;
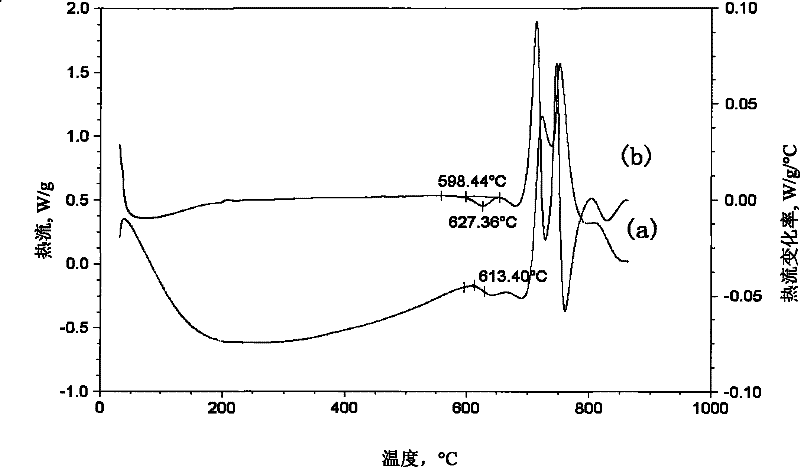
[0036] 2. Use a differential thermal analyzer to measure the heat flow-temperature curve of the sample obtained in step 1 under nitrogen atmosphere, 40°C / min, and DSC mode, see image 3 the a curve;
[0037] 3. The heat flow-temperature curve obtained in step 2 is derived from the temperature to obtain the heat flow rate-temperature curve, see image 3 the b-curve;
[0038] 4. On the heat flow rate-temperature curve obtained in step 3, find out the peak corresponding to the glass transition, and determine the onset temperature (T i )598.44℃, peak temperature (T P)627.36°C, thus determining the reference temperature range [1] as: from the initial temperature of 598.44°C (T i ) to a peak temperature of 627.36°C (T P );
[0039] 5. On the heat flow-temperature curve, within a slightly wid...
PUM
 Abstract
Description
Claims
Application Information
 - R&D
- Intellectual Property
- Life Sciences
- Materials
- Tech Scout
- Unparalleled Data Quality
- Higher Quality Content
- 60% Fewer Hallucinations
Browse by: Latest US Patents, China's latest patents, Technical Efficacy Thesaurus, Application Domain, Technology Topic, Popular Technical Reports.
© 2025 PatSnap. All rights reserved.Legal|Privacy policy|Modern Slavery Act Transparency Statement|Sitemap|About US| Contact US: help@patsnap.com


