

Novel Kit for fluorescence quantitative PCR detection of influenza A H1N1 viruses and detecting method therefor
A detection method and fluorescence quantitative technology are applied in the detection field of a new type A H1N1 virus by fluorescence quantitative PCR, and can solve the problems of high detection cost, detection specificity, limited sensitivity and low sensitivity detection.
- Summary
- Abstract
- Description
- Claims
- Application Information
AI Technical Summary
Problems solved by technology
Method used
Image

Examples
Embodiment 1
[0036] Example 1: Detection of Primer Sensitivity
[0037] 1) Select the full length of the known sample HA gene as a standard, and increase its viral RNA concentration from 10 -1 sequentially diluted to 10 -10 ;
[0038] 2) Negative control: nuclease-free water;
[0039] 3) The reaction system was prepared according to Table 3.
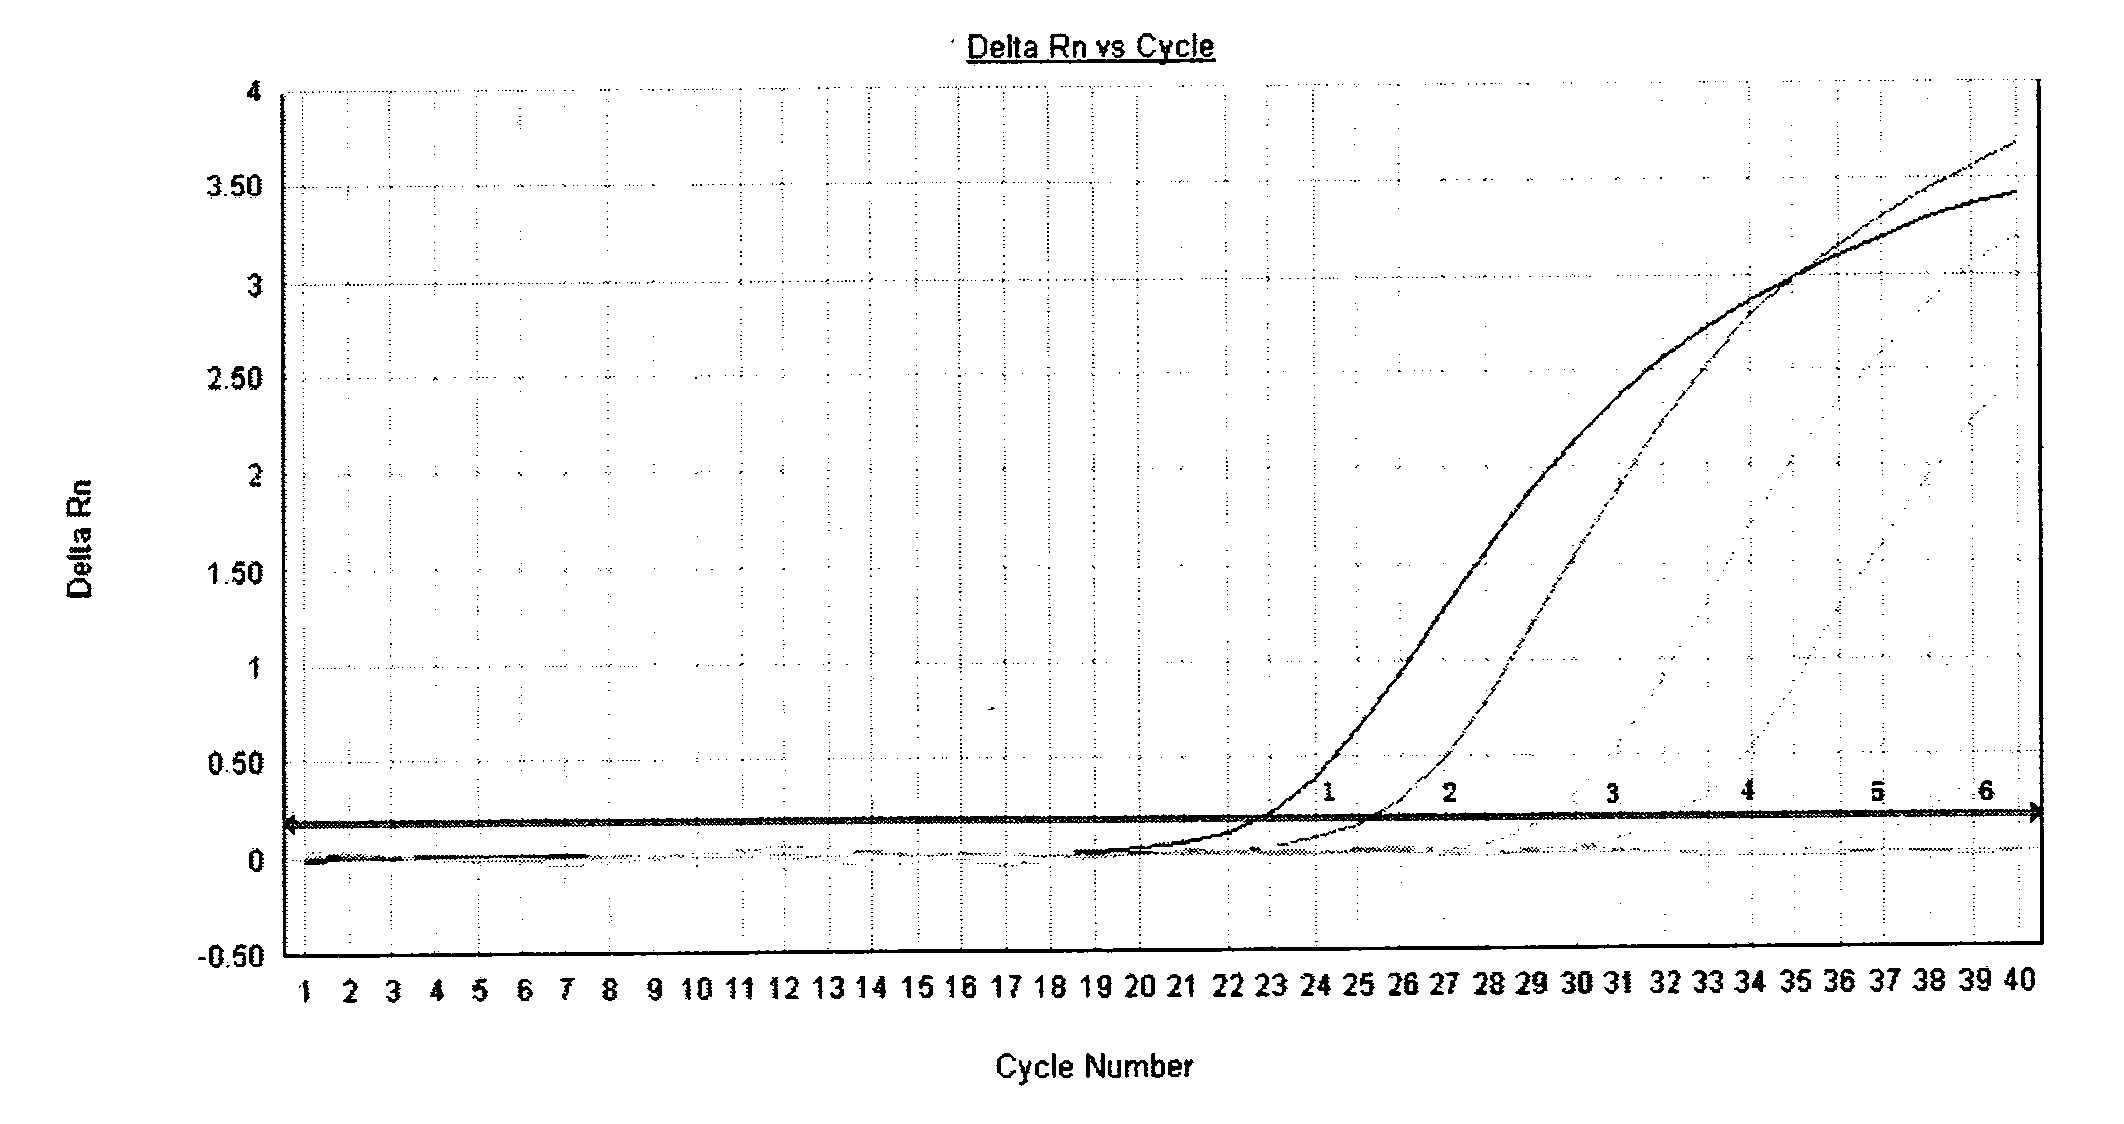
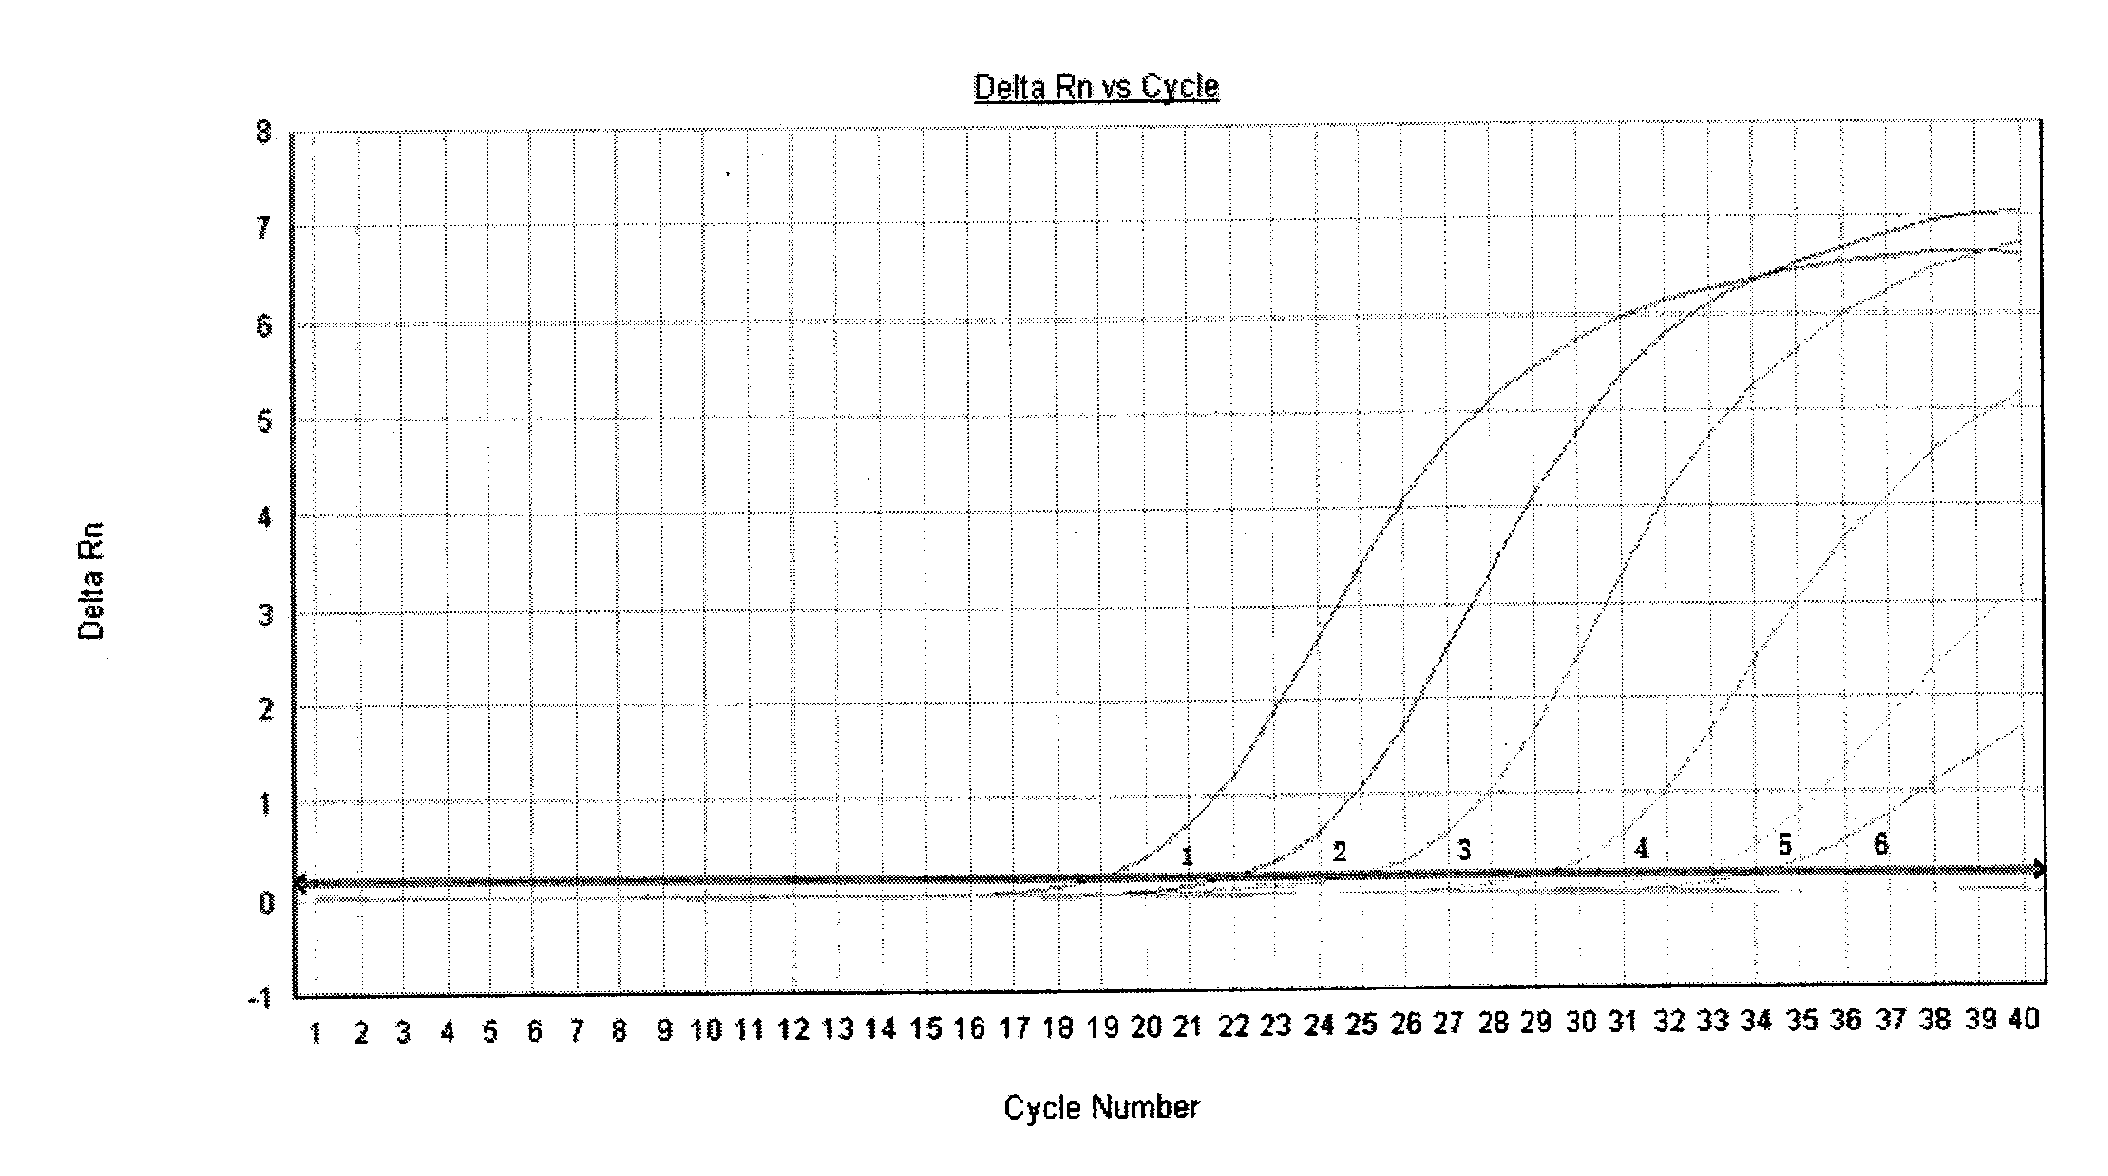
[0040] Test results such as figure 2 , 3 shown.
[0041] figure 2 The curves 1-6 in the middle are respectively the concentration dilution of the standard substance is 10 -4 -10 -10 Amplified curve with primer WHO-SWH1. image 3 The curves 1-6 in the middle are the concentration dilution of the standard substance in order of 10 -4 -10 -10 Curve amplified with primer YHANEW. we start from figure 2 and image 3 It can be seen from the figure that the curve of the amplification result of the YHANEW primer is earlier than the curve of the amplification result of the WHO-SWH1 primer.
[0042] Table 4SWH1, YHANEW primer sensitivity detect...
Embodiment 2
[0045] Example 2: Primer non-characteristic detection
[0046] 1) Non-specific detection of common seasonal influenza H1N1, swine influenza H1N1, avian influenza H5N1, H9N2;
[0047] 2) Positive control: viral HA fragment RNA;
[0048] 3) Negative control: nuclease-free water;
[0049] 4) The reaction system was prepared according to Table 2.
[0050] See the test results Figure 4 and Table 5.
[0051] Figure 4 The results showed that only the positive control HA numbered 1 showed an amplification curve. The curves of the remaining samples were all below the baseline, and there was no amplification reaction.
[0052] Table 5 Human, poultry and swine influenza virus detection results
[0053]
[0054] The data in Table 5 shows that the primers have a CT value of "-" for gene amplification of common seasonal influenza H1N1, swine influenza H1N1, avian influenza H5N1 and H9N2. It shows that the primer has no amplification reaction to its viral RNA.
Embodiment 3
[0055] Embodiment 3: detection of patient's throat swab
[0056] 1) Detect the throat swabs collected from suspected cases to screen for the new type A H1N1 influenza virus;
[0057] 2) Positive control: viral HA fragment RNA;
[0058] 3) Negative control: nuclease-free water;
[0059] 4) The reaction system was prepared according to Table 3.
[0060] See the test results Figure 5 and Table 6.
[0061] Figure 5 Only one amplification curve appeared in the positive control, and the rest of the samples had no amplification. The reaction was negative.
[0062] Table 6 Throat swab test results
[0063]
[0064] The results of the data in Table 6 show that the results of the patients' throat swabs were all negative.
[0065] Result analysis:
[0066] After the amplification reaction completed 40 cycles, the primer sensitivity detected that the viral RNA concentration dilution was 10 -8 ; There is no cross-reaction with common seasonal influenza H1N1, swine influenza ...
PUM
 Abstract
Description
Claims
Application Information