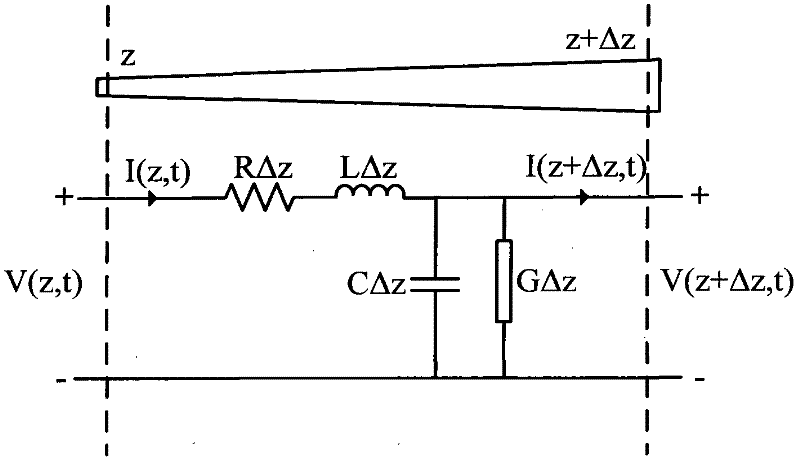
Time domain analysis method for transient response of lossy nonuniform multi-conductor transmission lines
A multi-conductor transmission line, transient response technology, applied in special data processing applications, instruments, electrical digital data processing, etc., can solve problems affecting the accuracy of transient response analysis, divergence of analysis results, and inability to analyze transmission lines.
- Summary
- Abstract
- Description
- Claims
- Application Information
AI Technical Summary
Problems solved by technology
Method used
Image
Examples
Embodiment 1
[0059] The software MATLAB is used for simulation, and the simulated excitation voltage source is added to the attack line in the lossy non-uniform multi-conductor transmission line. For the signal waveform of the excitation source, see Figure 4 .
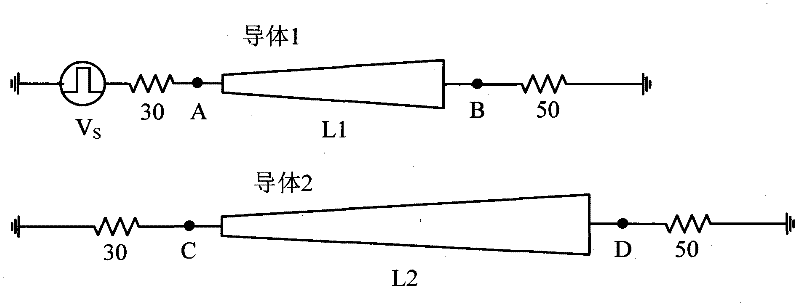
[0060] The total number of lossy non-uniform multi-conductor transmission lines analyzed must be greater than or equal to 3, of which at least one is an infinite flat metal transmission line as a reference conductor, and there are two transmission lines that are coupled and interfered as signal lines. See image 3 , image 3 It is a simulation model of a transmission line with unequal length and non-uniform lossy conductors terminated with resistive loads. Conductor 1 and Conductor 2 are two transmission lines that are coupled and interfered with each other as signal lines, but image 3 An infinite metal flat plate transmission line as a reference conductor is not shown. The transmission line that interferes with other transmission lin...
Embodiment 2
[0076] The transient response time-domain analysis method of lossy non-uniform multi-conductor transmission line is the same as that in Example 1. image 3 The simulation model shown is a 3-conductor lossy non-uniform transmission line terminated with a resistive load. In the figure, both conductor 1 and conductor 2 are signal lines, conductor 3 is not shown in the figure, and conductor 3 is an infinite metal flat plate as a reference conductor. L1 and L2 are the lengths of conductor 1 and conductor 2, respectively. Endpoints A, B, C, and D represent the ends of conductors 1 and 2, respectively. The distribution parameters of the transmission line are:
[0077] L = L ( z ) Lm ( z ) Lm ( z ) L ( z ) C = C ( z ) Cm ( z ) Cm ( z ) C ( z ) R = R ( z ) 0 0 R ( z ) G = G ( z ) 0 0 ...
Embodiment 3
[0106] The transient response time-domain analysis method of lossy non-uniform multi-conductor transmission line is the same as that of embodiment 1-2, and the simulation model and conditions are also the same as that of embodiment 1-2. image 3 The lengths of conductor 1 and conductor 2 in the simulation model are 0.1m and 0.2m, respectively. The voltage transient response waveforms of the transmission line endpoints A and B obtained by using the FDTD method are as follows: Picture 9 As shown, the voltage transient response waveforms of the transmission line endpoints C and D are as follows Picture 10 Shown. Under the same simulation conditions, the voltage transient response waveforms of the transmission line endpoints A and B obtained by using the time domain analysis method proposed by the present invention are as follows: Picture 11 As shown, the voltage transient response waveforms of the transmission line endpoints C and D are as follows Picture 12 Shown. Observed Pic...
PUM
 Abstract
Description
Claims
Application Information
 - R&D
- Intellectual Property
- Life Sciences
- Materials
- Tech Scout
- Unparalleled Data Quality
- Higher Quality Content
- 60% Fewer Hallucinations
Browse by: Latest US Patents, China's latest patents, Technical Efficacy Thesaurus, Application Domain, Technology Topic, Popular Technical Reports.
© 2025 PatSnap. All rights reserved.Legal|Privacy policy|Modern Slavery Act Transparency Statement|Sitemap|About US| Contact US: help@patsnap.com


