Acoustic emission device and method for detecting destructive failure of carbon fiber composite material

A composite material, acoustic emission technology, applied in the direction of material analysis using acoustic emission technology, can solve the problems of expensive equipment, low sensitivity of small defects, inclusions, etc., to achieve the effect of simple operation, continuous real-time signal feedback, and high sensitivity

Inactive Publication Date: 2012-06-20
ZHEJIANG UNIV
3 Cites 23 Cited by

AI-Extracted Technical Summary

Problems solved by technology

Because the composite material is microscopically inhomogeneous, the fiber/matrix dispersion is large, and there are various random defects inside the material (the main defects are: air holes, delamination, looseness, cross-layer cracks, interface separation, inclusions, poor resin curing and drilling damage, etc.), the generation, accumulation and expansion of micro-cracks inside the material will reduce the strength and stiffness of the material, thereby reduci...

Method used

Determine the spacing of two sensors by the pencil lead analog acoustic emission signal device, two sensors are fixed on the carbon fiber composite material surface, fill coupling agent between sensor...

Abstract

The invention discloses an acoustic emission device for detecting destruction failure of a carbon fiber composite material. The acoustic emission device comprises two sensors, a pre-amplifier, a band-pass filter and an acoustic emission detector, wherein the two sensors are respectively connected with the pre-amplifier; and the pre-amplifier, the band-pass filter and the acoustic emission detector are sequentially connected with each other. The acoustic emission device provided by the invention has the advantages of continuous real-time signal feedback, high sensitivity, convenient operation and the like, can dynamically extract and feed back the destructive failure information of the composite material in the loading process, can integrally detect and evaluate defect state of the entire composite material structure, and is suitable for early stage monitoring of the composite material structure or approaching failure characteristic prediction. Based on an amplitude-time diagram, an energy-time diagram, a counting-time diagram and an amplitude-position curve diagram acquired through acoustic emission detection, the method provided by the invention can accurately and rapidly determine dominant failure mode and failure mechanism of the composite material in each loading stage so as to provide technical support for deeply studying performance degradation mechanism of the composite material.

Application Domain

Technology Topic

Image

  • Acoustic emission device and method for detecting destructive failure of carbon fiber composite material
  • Acoustic emission device and method for detecting destructive failure of carbon fiber composite material
  • Acoustic emission device and method for detecting destructive failure of carbon fiber composite material

Examples

  • Experimental program(1)

Example Embodiment

[0034] Example
[0035] The method for detecting failure and failure of the carbon fiber composite material by acoustic emission includes the following steps:
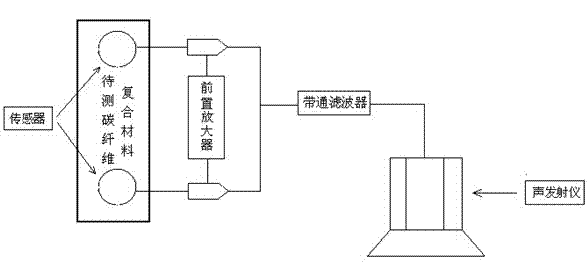
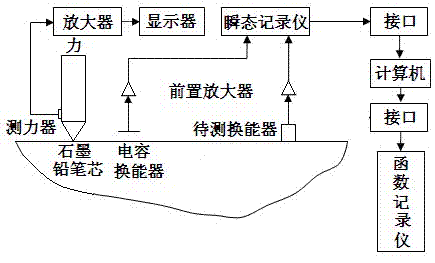
[0036] 1. Determination and installation of sensor spacing
[0037] The pencil lead simulating acoustic emission signal device determines the distance between the two sensors. The two sensors are fixed on the surface of the carbon fiber composite material, and the coupling agent is filled between the sensor and the carbon fiber composite material to be measured, so that there is a good acoustic coupling between the two. The coupling agent may be petroleum jelly, but is not limited thereto.
[0038] 2. Obtain the acoustic emission signal of composite material failure
[0039] Use electro-hydraulic servo material testing system (MTS810-25ton) to match [0o/90o], [45o/-45o], [0o/45o/90o/-45o] and [90o/45o/0o/-45o], etc. Laminate samples with different opening angles and different opening sizes were subjected to tensile tests, and the 48-channel acoustic emission instrument produced by the American PAC company was used to monitor the entire loading failure process of the composite material to obtain acoustic emission signals, energy-time diagrams, and count- Time graph, amplitude-time graph and amplitude-position curve graph.
[0040] 3. After processing by the signal acquisition and processing system, the real-time amplitude-time graph, energy-time graph, count-time graph and amplitude-position curve graph will be displayed in the recording and display system.
[0041] 4. Analysis of failure modes of composite materials based on acoustic emission signals
[0042] Based on the real-time amplitude-time diagram, energy-time diagram, count-time diagram and amplitude-position curve obtained during the loading process, the failure mechanism and dominant failure modes of composite materials are analyzed. From the amplitude-time graph and energy-time graph curve, the acoustic emission signal generated by fiber fracture reaches 80dB or more, and the energy value is higher, which has the greatest impact on the degree of damage to the material, but the number is small and mainly concentrated in adjacent fractures Stage: The signal amplitude from the crack damage of the matrix is ​​around 50-60dB, and the energy value is low, which has little effect on the overall mechanical properties of the material; the signal amplitude from the interface damage is mainly around 60-70dB, the number of signals is large, and the energy value is The changes have a certain impact on the mechanical properties of the material; the signal amplitude from fiber pull-out and fiber breakage is mainly around 70-80dB, which has a greater impact on the mechanical properties of the material. From the count-time diagram, there are only a few matrix cracks in the early stage, and the count curve grows slowly. When the middle stage is accompanied by interface failure, fiber pull-out and other failure methods, the slope of the count curve increases greatly, and in the later stage, due to fiber fracture The number of acoustic emission signals is small, so the slope of the counting curve does not change much, but there will still be a slight increase. From the amplitude-position curve, the sample with holes has a larger number of signals at the opening position and both ends of the sample, and the amplitude is also higher, while the sample without holes has a higher acoustic emission signal than the sample. The upper distribution is more even. The relationship between the dominant failure mode and the acoustic emission signal amplitude of the carbon fiber composites with different layup angles during the loading process is summarized in Table 1.
[0043] Table 1 Acoustic emission amplitudes corresponding to different failure modes of composite materials
[0044]
[0045] Acoustic emission testing is carried out on composite material samples with different lay angles and hole sizes under tensile load, and the following mapping relationship between the failure mode of carbon fiber composites and the amplitude of the acoustic emission signal is obtained:
[0046] (1) [0o/90o] The acoustic emission experiment results of the 4s layered samples with holes show that the early acoustic emission signals have a small number, small amplitude, and low energy value. The number of mid-term signals increases sharply, and the amplitude and energy value are also significantly improved. , And began to appear high-amplitude signals above 90dB. Before the fracture, the number of signals increased slightly, but the energy value increased sharply, and more high-amplitude signals above 90dB appeared. From the point of view of the breaking position, the number of signals in the part with a circular hole in the middle of the sample is large, and the high-amplitude signals above 90dB are also concentrated here. It can be seen that the sample is finally broken from the middle. This is because at the beginning of stretching, the fiber bundle There are not many failure points in the elastic change, mainly because a small amount of damage begins to occur at the interface. With the continuous increase of tensile stress, a large number of horizontal and vertical interfaces are destroyed. In the middle of the failure, part of the longitudinal fibers do not break at the same time, causing stress fluctuations and uneven distribution, thus accelerating the surrounding matrix and interfaces. Further destruction. The bonding effect between the longitudinal and transverse layers makes the transverse fiber bundles inhibit the development of longitudinal fiber fracture to a certain extent, but at the same time the transverse fiber bundles and the matrix also begin to debond at the interface, and the damage between the layers is further aggravated . In the late stage of failure, the interface effect between the layers and the transverse fiber bundles has no effect on the longitudinal tensile strength of the entire material. At this time, the longitudinal fiber bundles play a major role in the tension, and the number of breaks increases with different longitudinal fibers. , Making the remaining longitudinal fibers unable to withstand excessive tensile loads and break.
[0047] (2) [0o/45o/90o/-45o] 2s layered samples with holes in the acoustic emission test results show that from the signal number and amplitude time domain distribution, the number of early damage signals is small, and the number of mid- damage signals increases , The amplitude is mainly 50-80dB, the number of signals increases sharply when the break is approaching, mainly high-amplitude signals above 80dB. This is because in the early stage of tensile load, due to the large fiber layup angle of the 45o and -45o layers of the sample, the load is first borne by the fiber and the interface, and stress concentration occurs in the fiber direction and the interface, making the sample elastic stage. With the further increase of the load, the fiber pull-out and interface debonding occurred in the oblique cross layer, and the load gradually transferred to the 0o layer. At this time, a small amount of microscopic damage began to occur at the initial defect of the 0o layer interface, and the damage and the interface continued to develop. The matrix is ​​destroyed. Subsequent damage further intensified, causing some fibers to start to break at different times. This local stress fluctuation accelerated the damage to the matrix and interface at the broken fiber. In the later stage of failure, the load is applied to the 90o layer with poor tensile properties, and its weak interface performance results in the failure of the synergy of the composite material. At the same time, the interface failure also leads to the failure of the stress transmission effect, and the phenomenon of random fiber fracture is increasing. , The sample collapses, the energy rises sharply, and finally the remaining fiber bundle cannot bear the excessive load and the overall fracture occurs.
[0048] (3) [90o/45o/0o/-45o] The acoustic emission test results of the 2s layered sample with holes show that the energy distribution is that the signal in the early stage is less, the greater energy appears in the middle stage, and the decrease is slow in the later stage. . There are more acoustic emission signals, and there are many high-amplitude signals greater than 90dB, which are mainly concentrated in the middle and late stages. The acoustic emission signals distributed throughout the sample are also relatively uniform. It can be seen that the sample is seriously damaged and eventually fractured from the middle. This is because in the initial stage of stretching, due to the large angle of the fiber layup of the oblique layup, the load is mainly borne by the fiber and the interface, the tensile performance is good, and the damage to the sample is low. Later, with the continuous increase of the tensile load, the 90o layer began to be subjected to the load, and the original defects of the interface expanded along the fiber direction to form the interface transverse damage, and the interface cracks began to expand in the severely concentrated areas. The sample finally Separation and fracture due to severe debonding at the interface. The whole failure process has the main characteristics of stages, but various failure modes affect each other, especially the transverse crack propagation of the interface, which causes the damage of the matrix and fiber interface to increase, and accelerates the debonding of the interface and the final separation of the interface. The position of the fracture caused by the debonding of the interface is completely random, and mainly depends on the weakest part of the interface between the fiber bundle and the matrix. Afterwards, the 0o layer with better tensile properties limits the damage of the sample, so that the damage of the sample is alleviated. Finally, when the fibers in the 0o layer also began to break, the entire sample broke as a whole.

PUM

no PUM

Description & Claims & Application Information

We can also present the details of the Description, Claims and Application information to help users get a comprehensive understanding of the technical details of the patent, such as background art, summary of invention, brief description of drawings, description of embodiments, and other original content. On the other hand, users can also determine the specific scope of protection of the technology through the list of claims; as well as understand the changes in the life cycle of the technology with the presentation of the patent timeline. Login to view more.

Similar technology patents

Classification and recommendation of technical efficacy words

Why Eureka
Try Eureka